Lunar mission "Bereshit" - online portal with a simulator trajectory and monitoring of current flight parameters
The advantage of private space launches is the ability to provide users with visual data on the current situation at each stage during the project, thus popularizing astronomy and other sciences, as well as talking about scientific advances and research in a language understandable to commoners and even children. The moon is back in fashion!
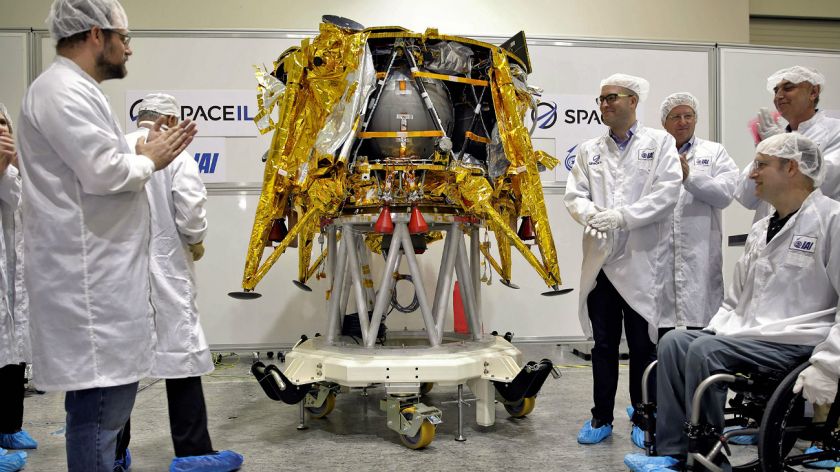
Previously, there was already a publication about the successful launch of the lunar module “Bereshit”, developed by SpaceIL organizations, which is mainly supported by private investors, including American magnate Sheldon Adelson and billionaire Morris Kahn, who are also co-determinants of Amdocs (DOX), one of the largest companies of Israel.
You can read about the mission of the SpaceIL team here .
')
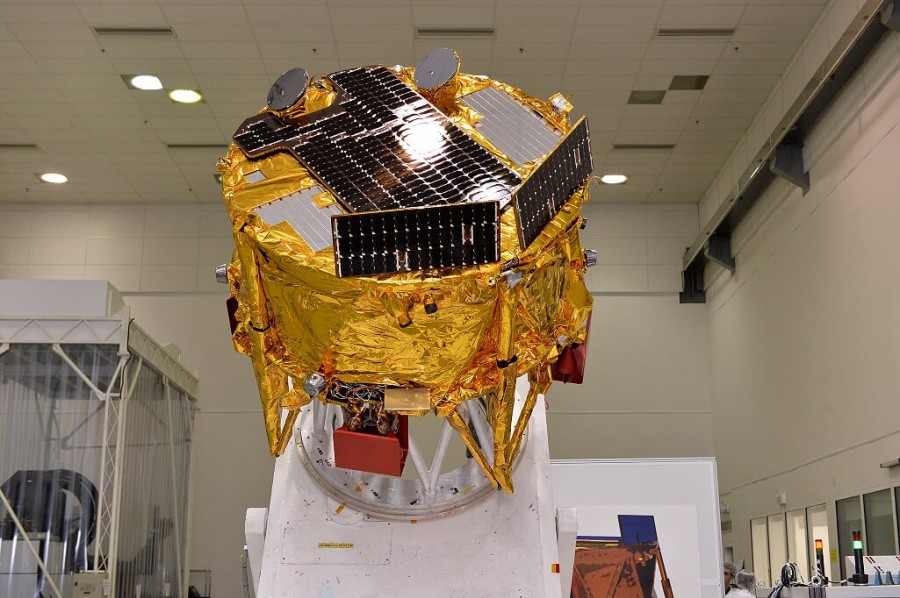
Characteristics of the lunar apparatus "Bereshit":
- The height is about 1.5 meters;
- weight 585 kilogram with fuel (fuel weight - 390 kg), 195 kg without fuel.
The Bereshit device has no thermal protection and cooling systems, the estimated operating time on the surface of the Moon is about two days (three days maximum), then its electronics and batteries will fail due to overheating, communication with the device will be lost, and it will become new lunar monument in the Sea of Clarity, next to Lunokhod-2 (Luna-21 mission) and modules of the Apollo-17 mission.
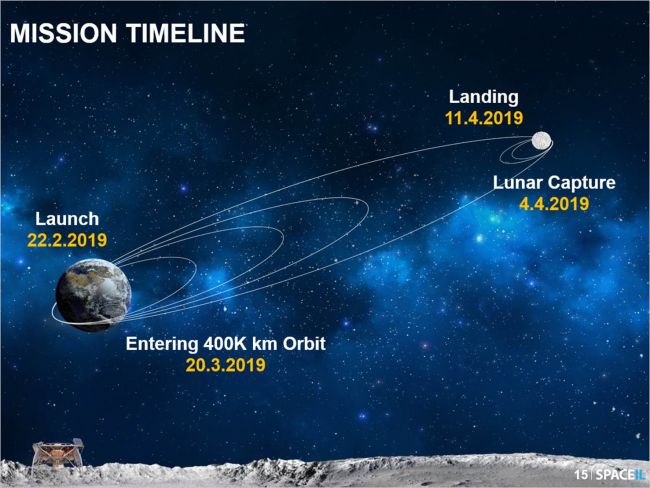
Stages of the space mission "Bereshit":
- February 22, 2019: the launch on the Falcon 9 rocket carrier from the launch site at Cape Canaveral (Florida);
- an exit to a geotransfer orbit, a series of maneuvers (switching on the engines for a few seconds) to increase the apogee of its elliptical upholstery after each orbit around the Earth;
- March 20, 2019: going into orbit with an apogee of 400,000 km;
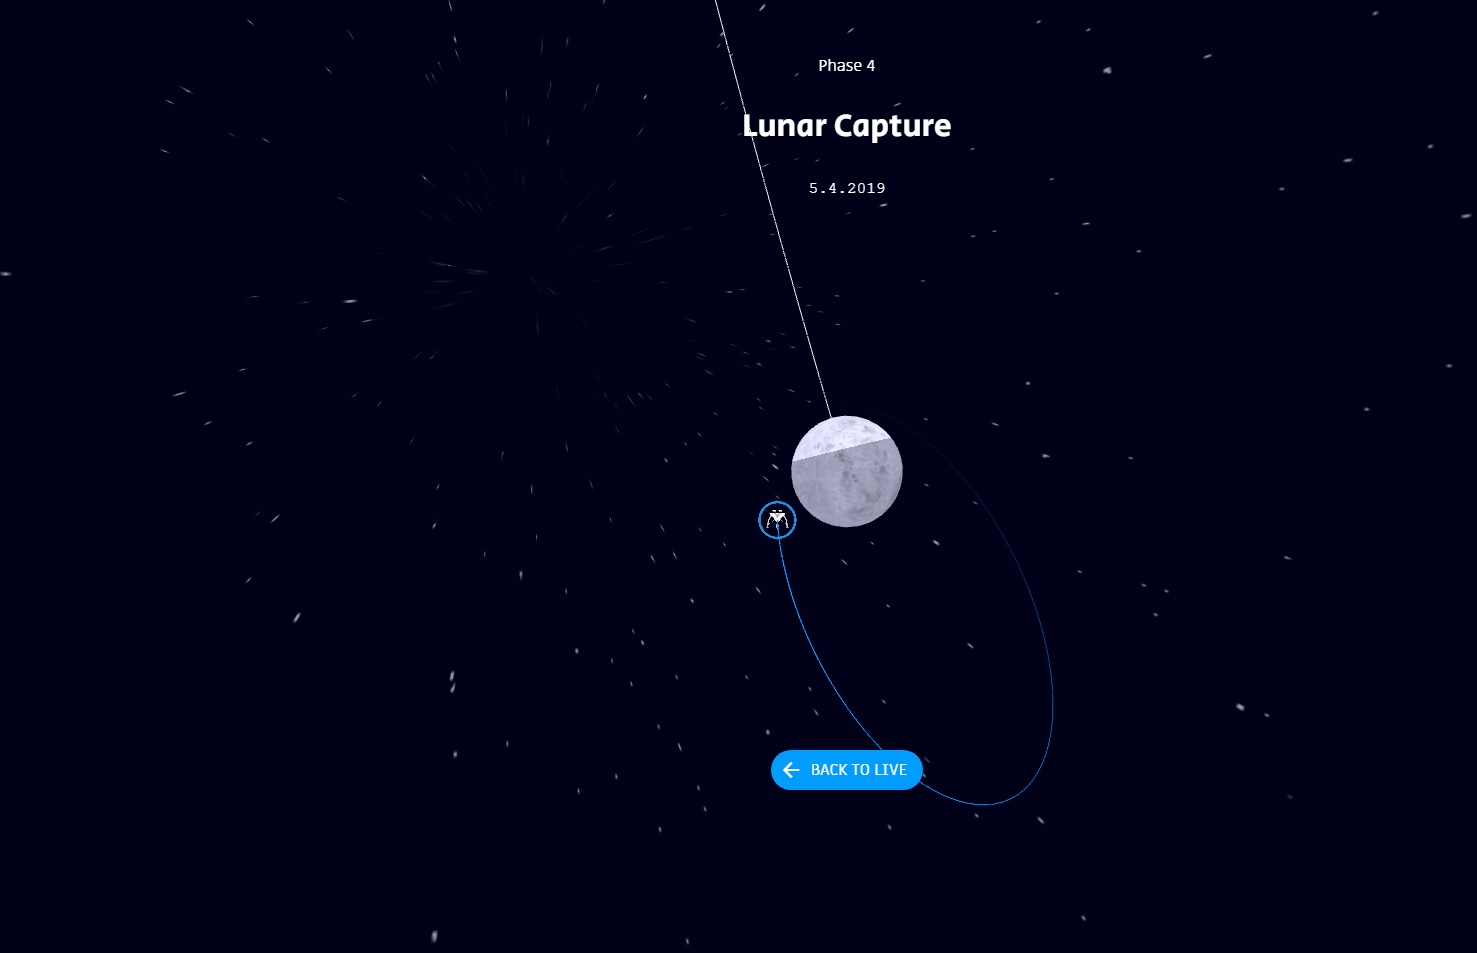
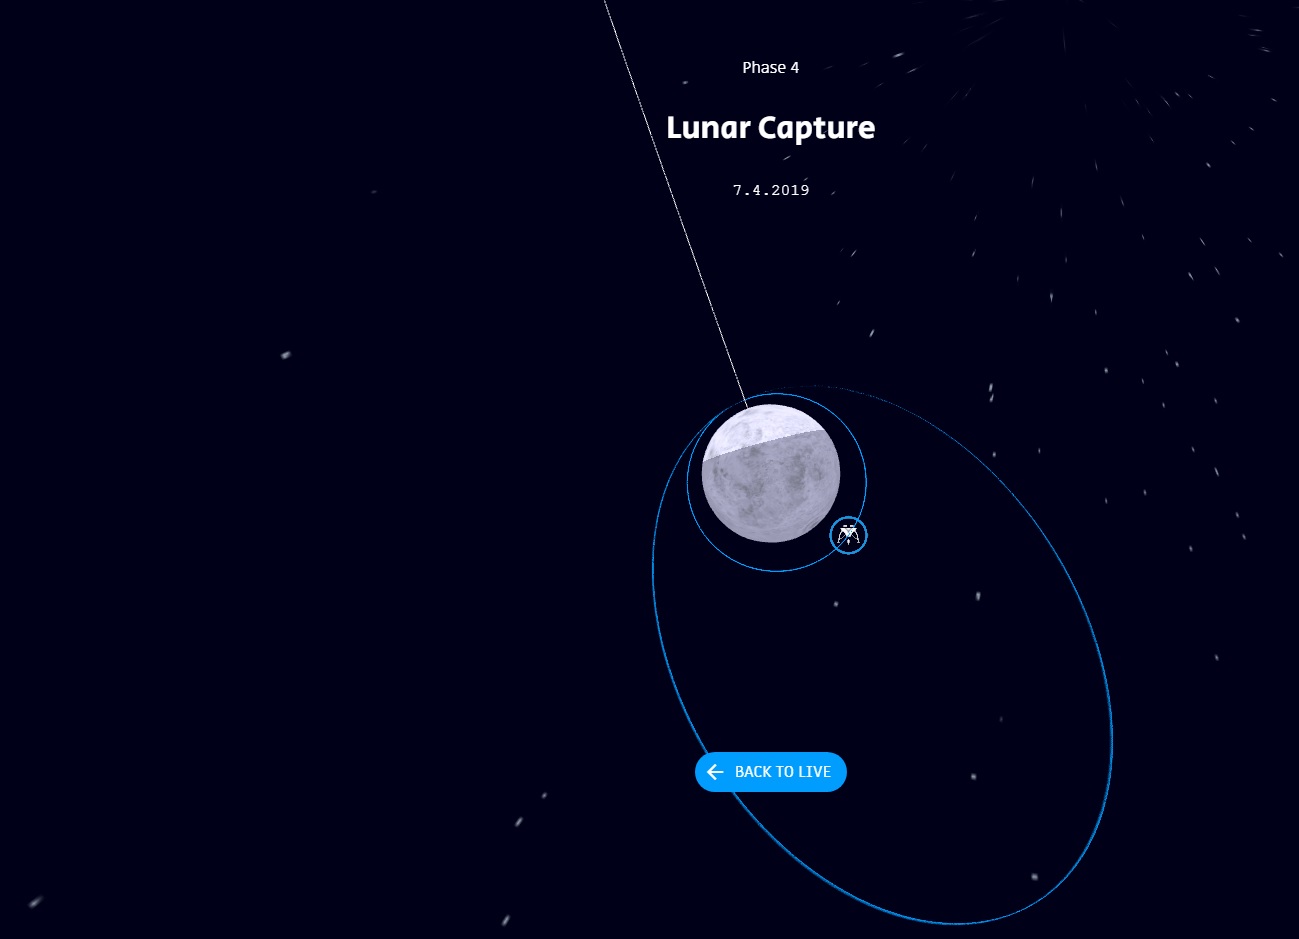
- April 4, 2019: access to the lunar orbit (capture by the gravitational field of the moon);
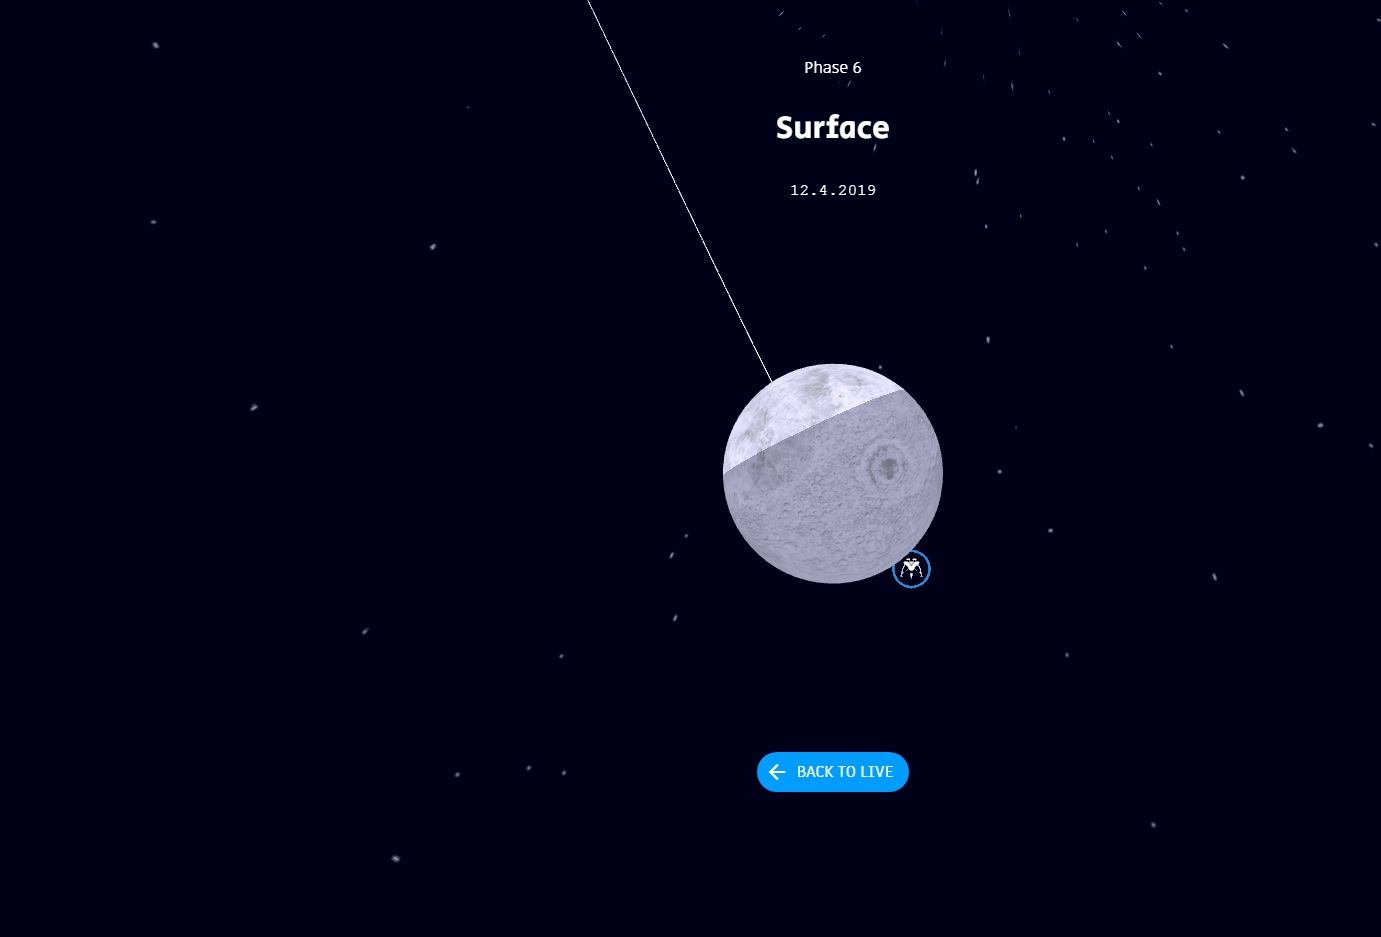
- April 11, 2019: the LRO - NASA lunar orbital probe will monitor the landing of the Bereshit after the landing procedure on the lunar surface.
At the same time, “Bereshit”, if successful, will beat a kind of record - it flies to the moon along the longest trajectory possible.
“We conducted our first successful maneuver at a distance of 69.4 thousand kilometers from the Earth, turning on the engines for 30 seconds. This is the first turning on of our main engine! The next correction will be made on February 25, ” the SpaceIL team reported .
Reports on the implementation of the stages from the SpaceIL team:
Reports on the status of the device are here Twitter Israel To The Moon SpaceIL team.
By the way, according to SpaceIL, for the first maneuver, the engines were switched on for 30 seconds at the apogee, and not at the perigee, as previously planned.
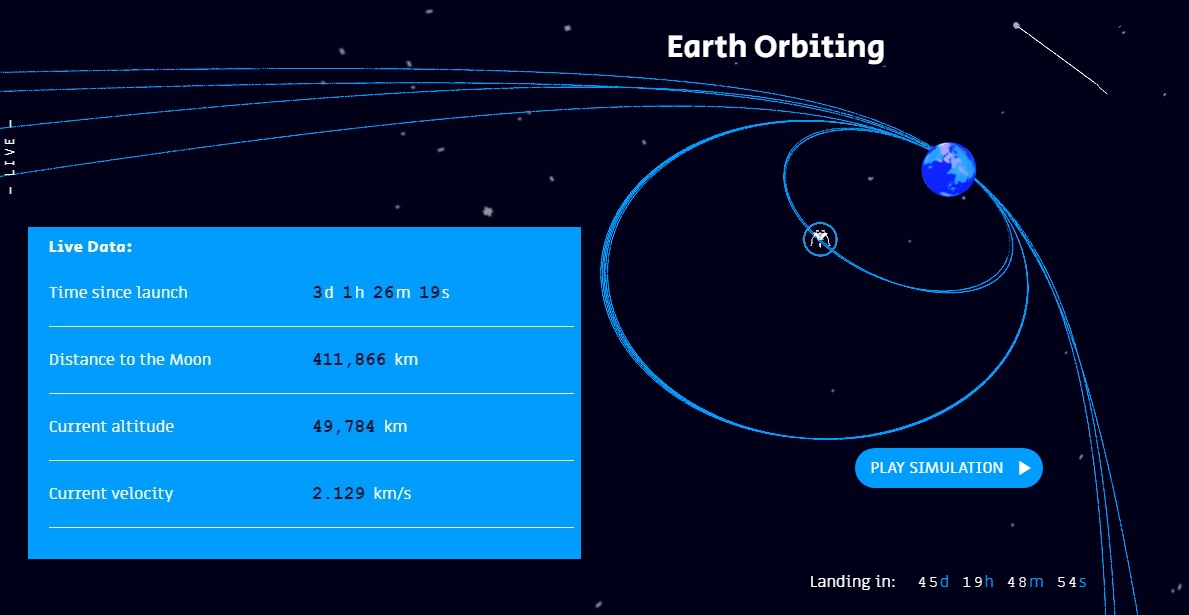
The non-profit organization SpaceIL has provided an open source online resource with a simulator and real-time data on the current status of the Bereshit mission.
We can find out on this resource:
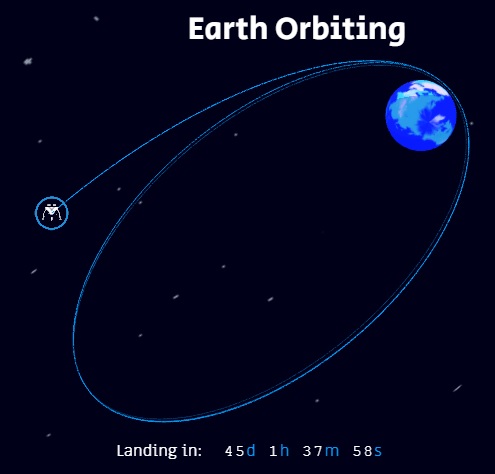
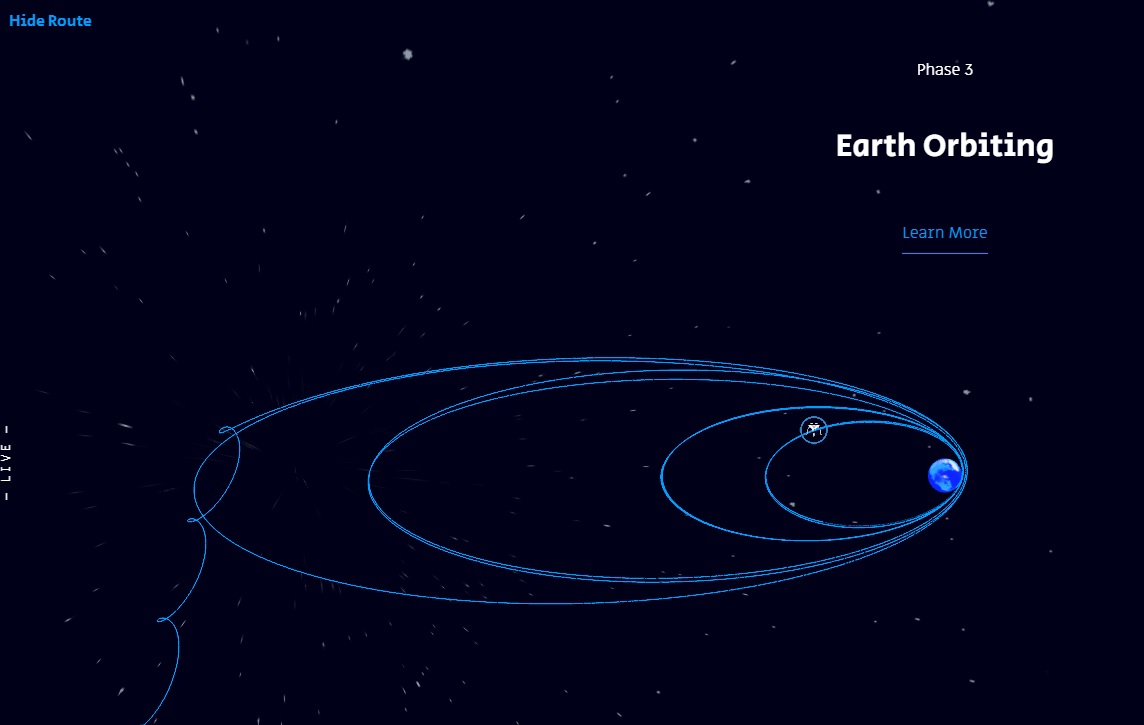
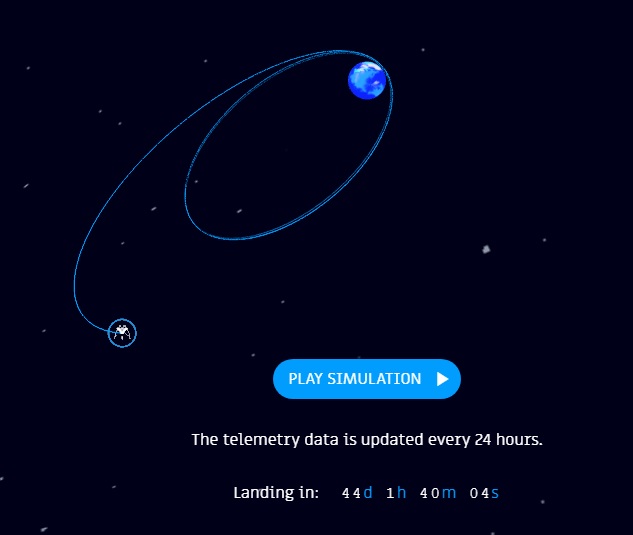
- the current visual location of the Bereshit spacecraft relative to the Earth and the Moon, including data on the remaining flight time:
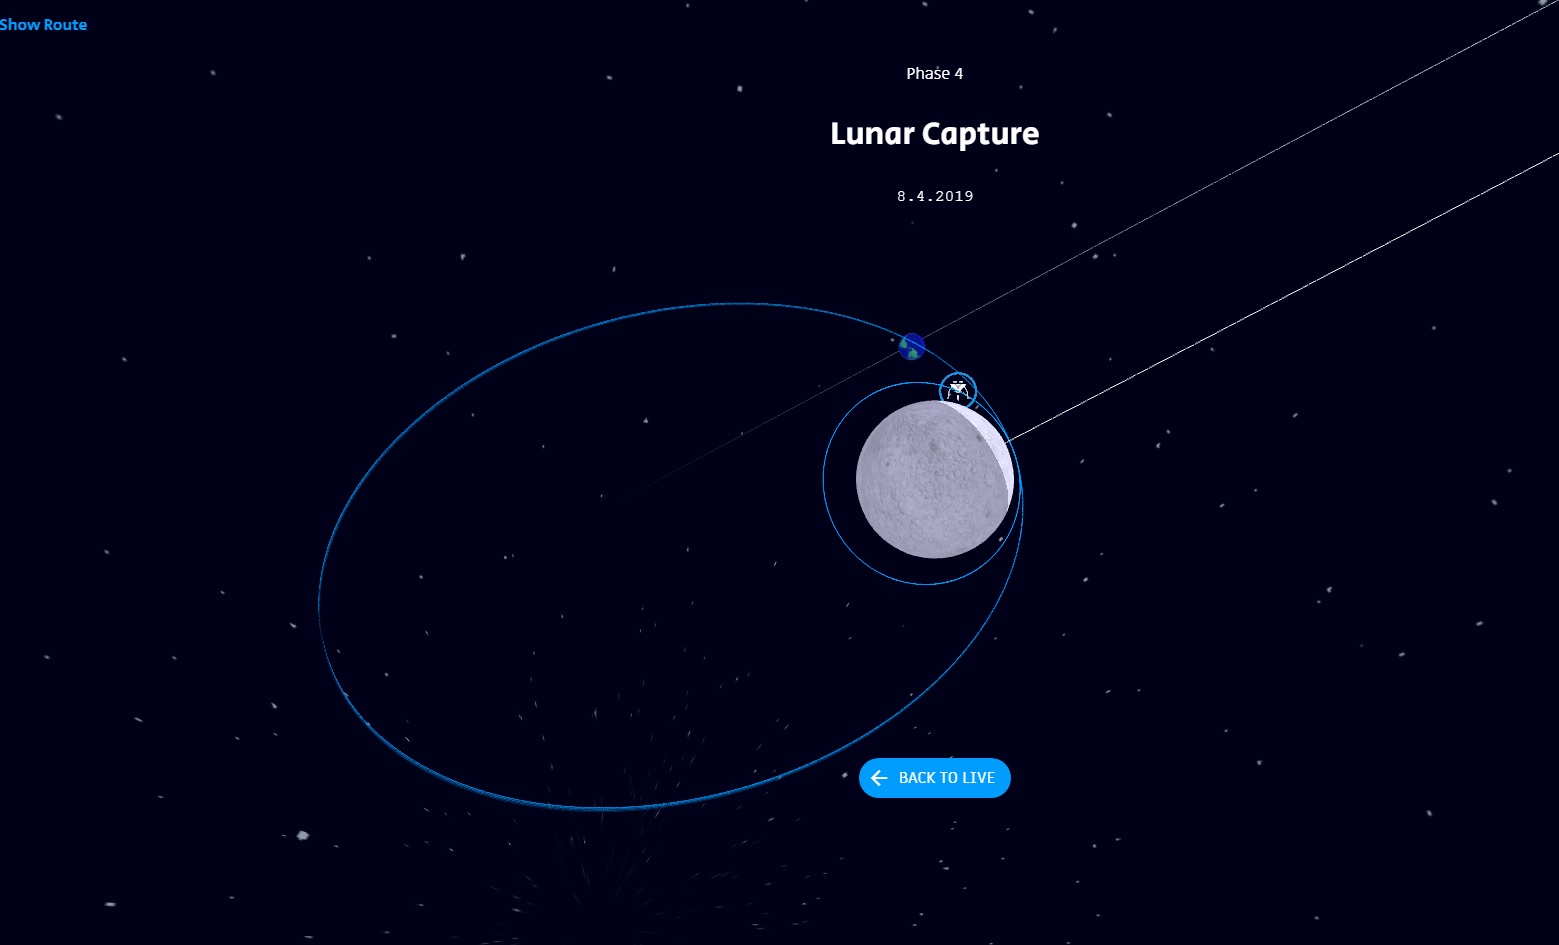
- using the mouse wheel, you can change the scale of the image, and holding the left mouse button, you can move the mouse and change the angle of inclination in the picture:
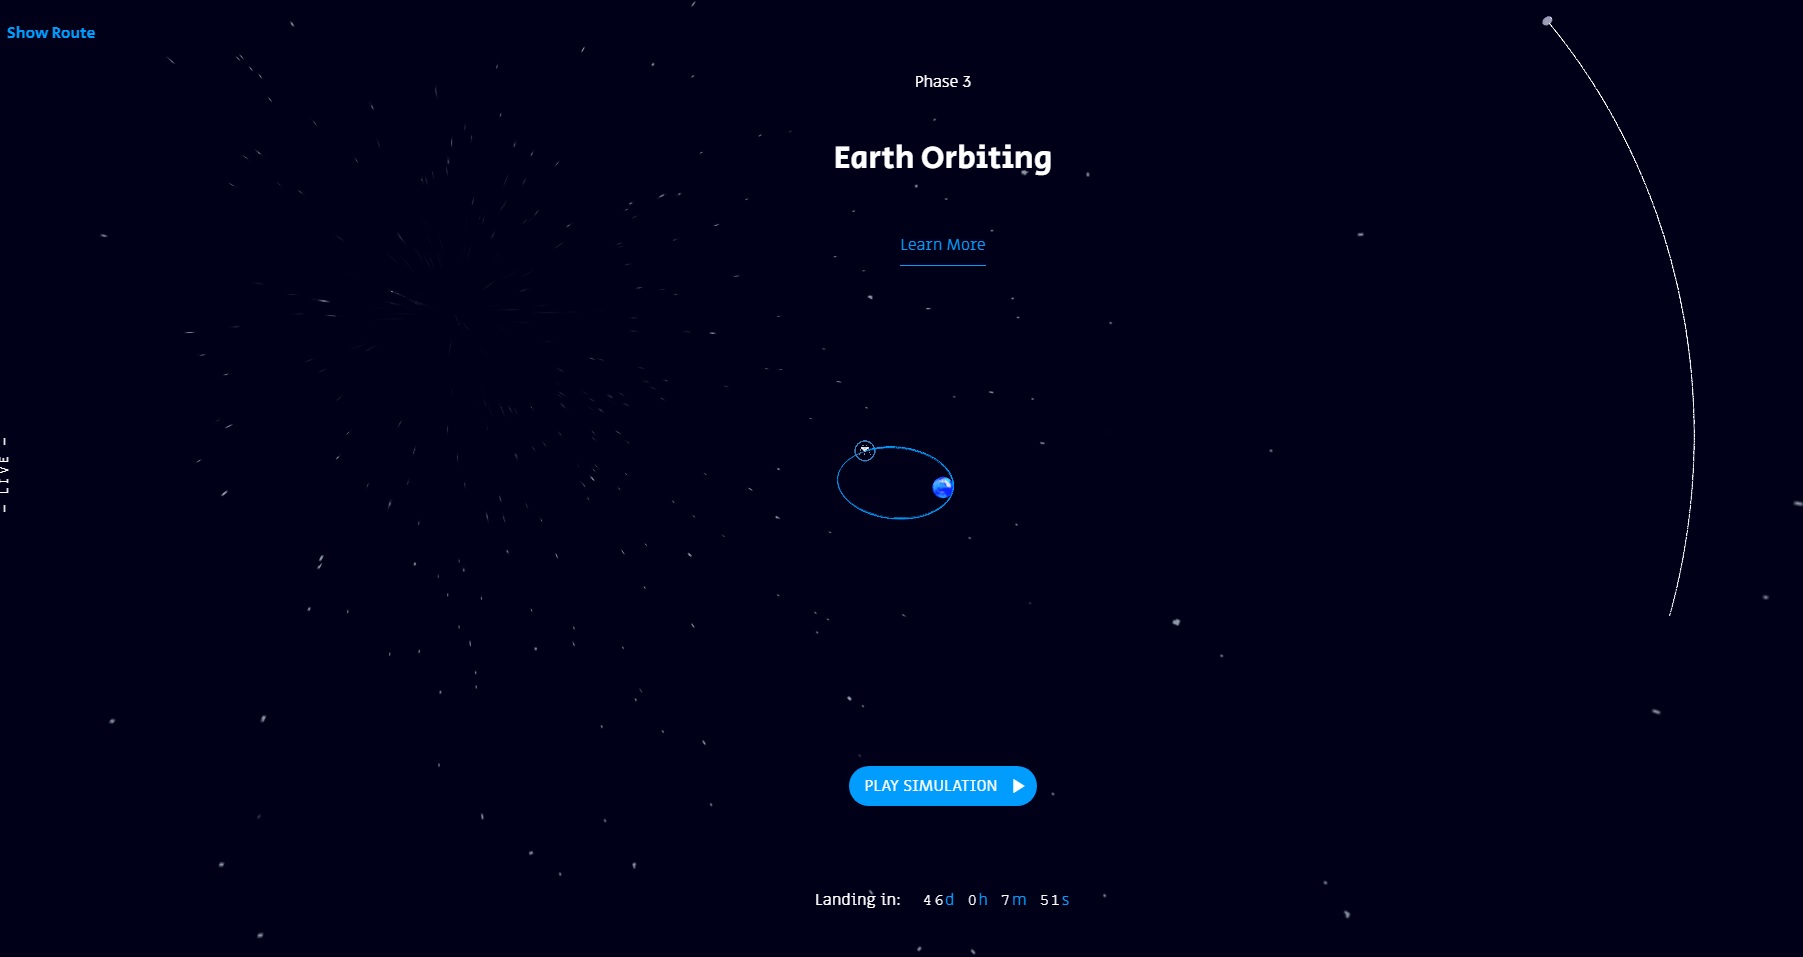
- the online data of the “Bereshit” parameters can be seen by clicking on the “Learn More” button in the middle of the screen (the data changes all the time, which is very interesting):
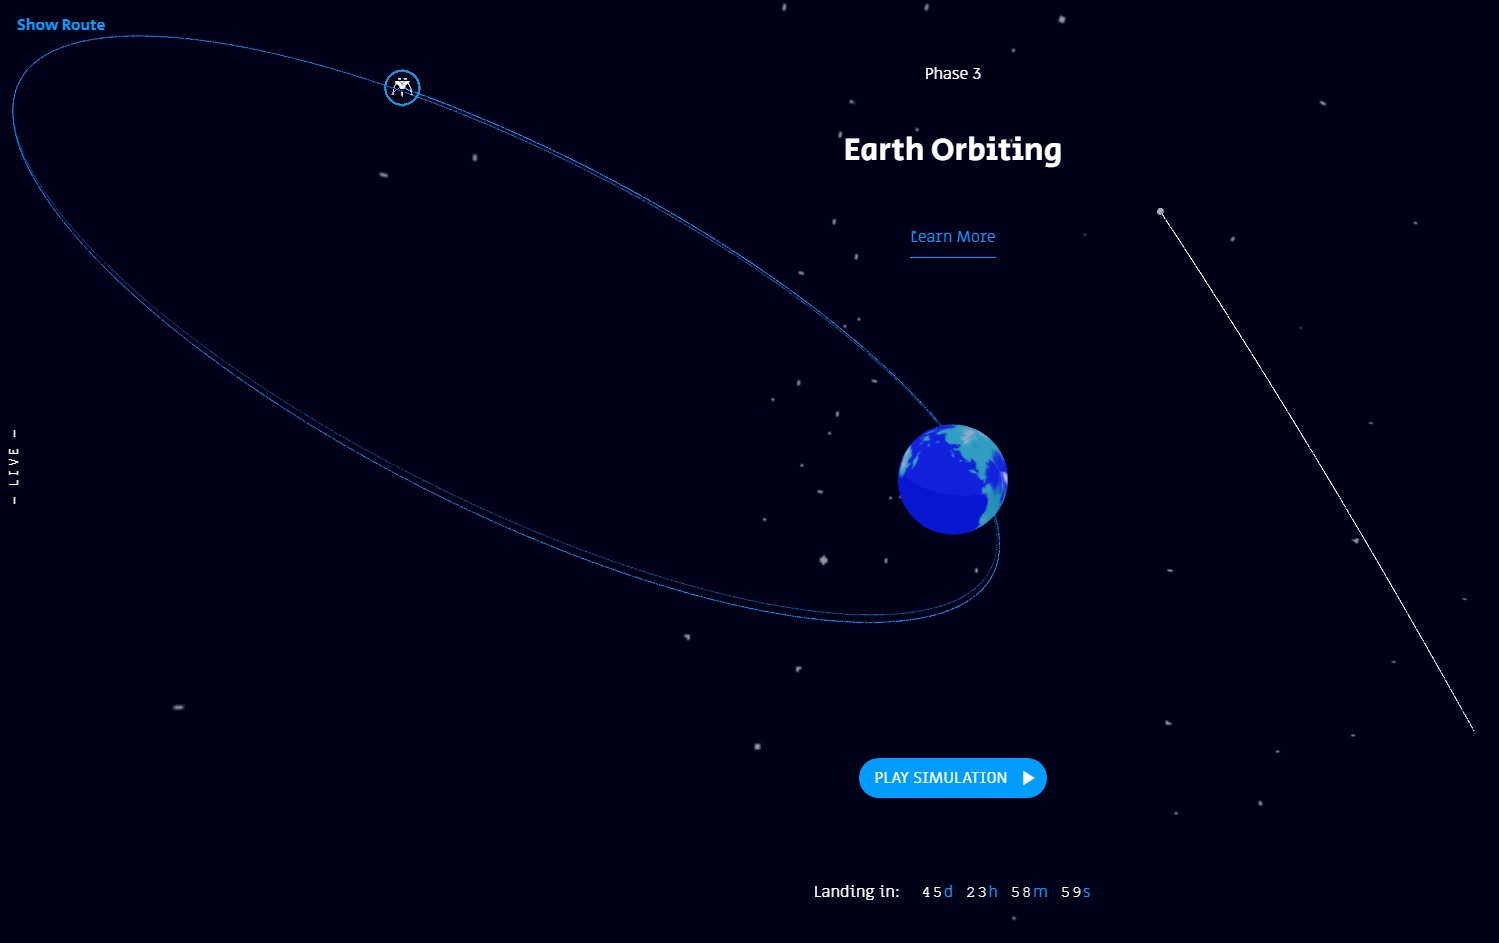
By clicking the “Show route” button in the upper left of the screen, you can see the planned trajectory of the Bereshit device (you can disable it by clicking the “Hide route” button in the same place):
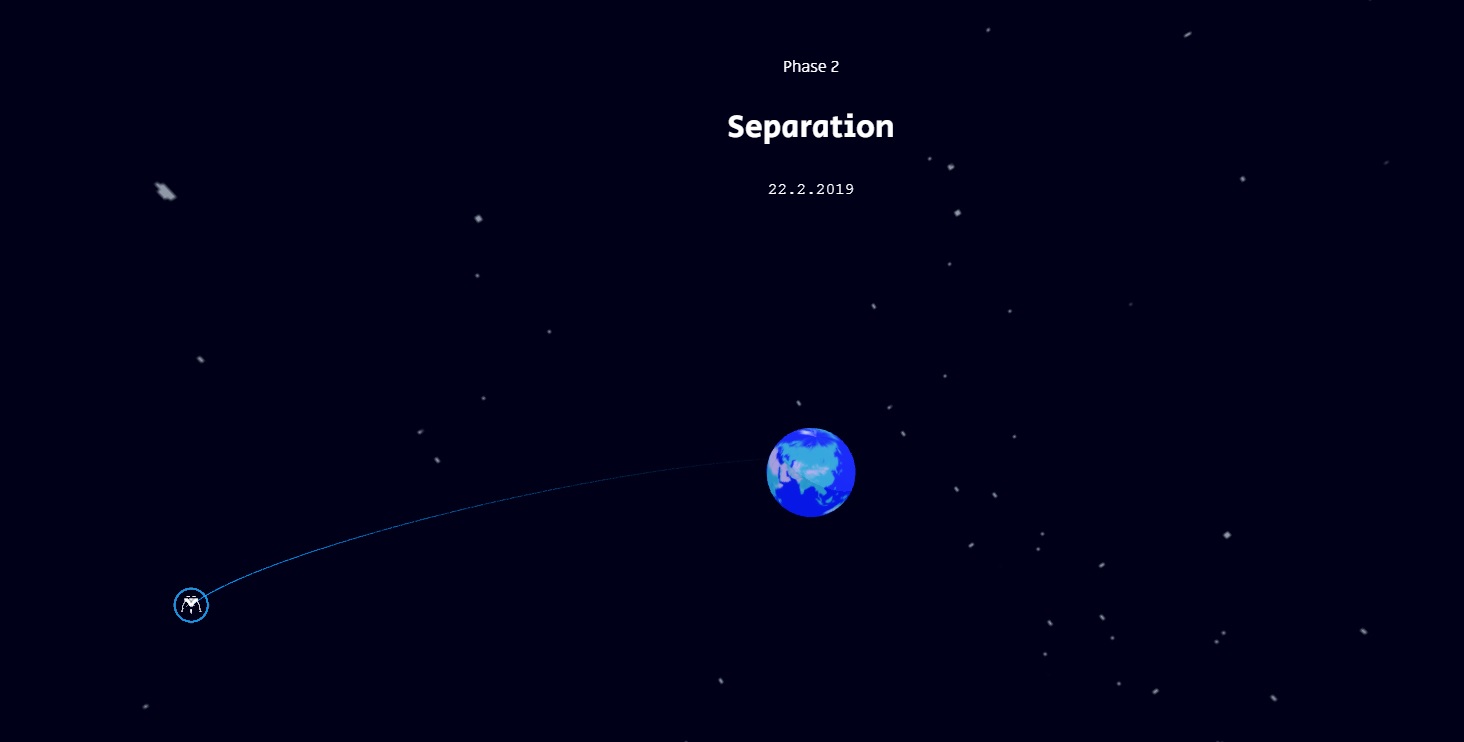
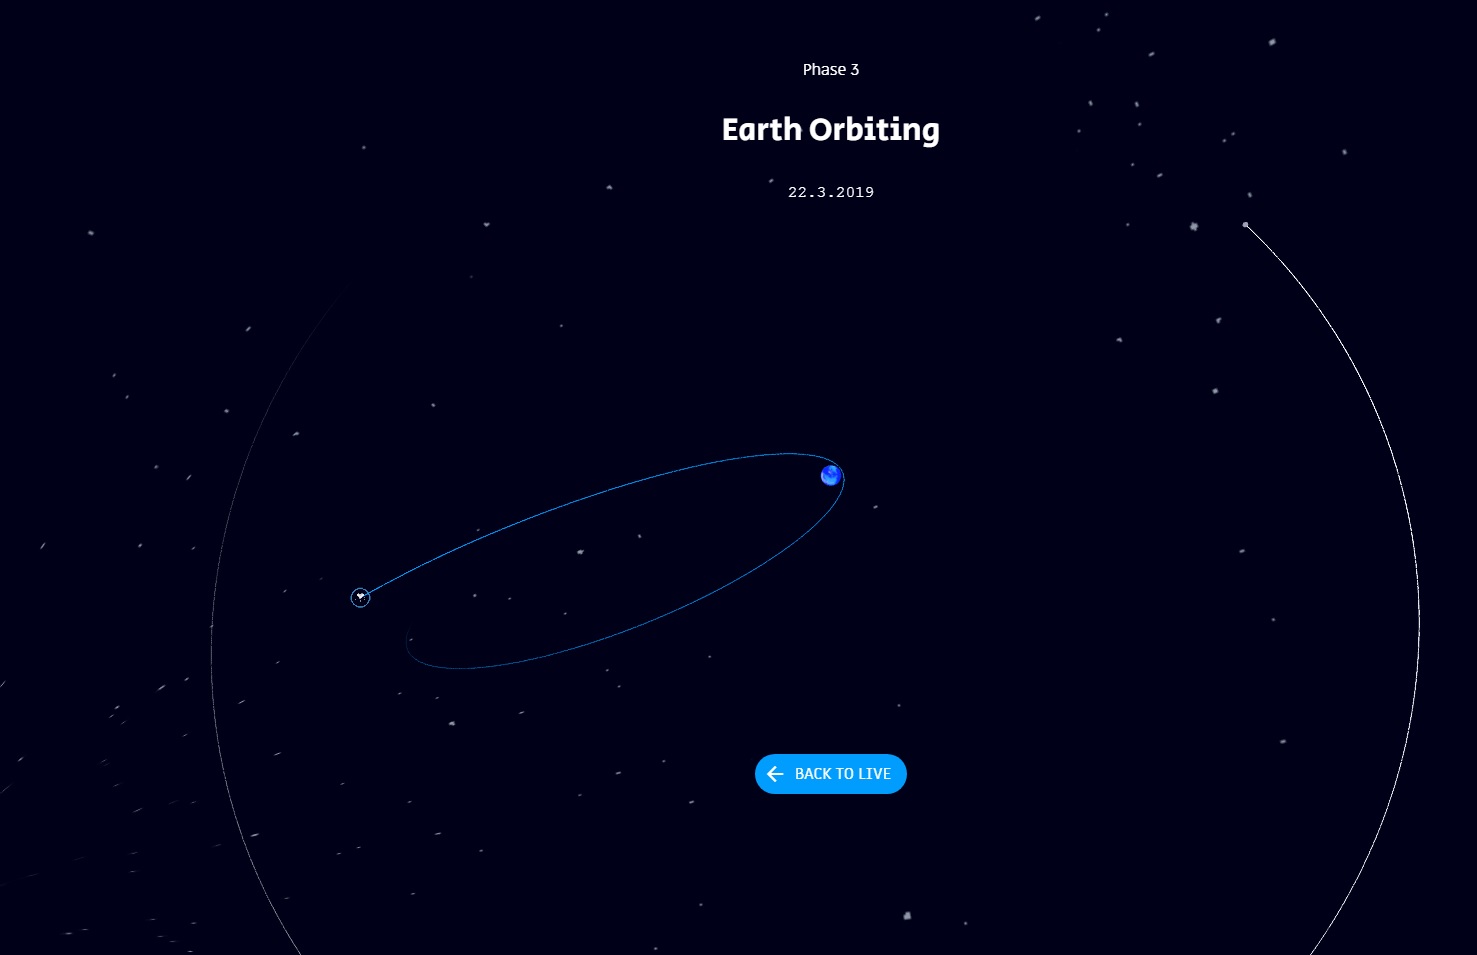
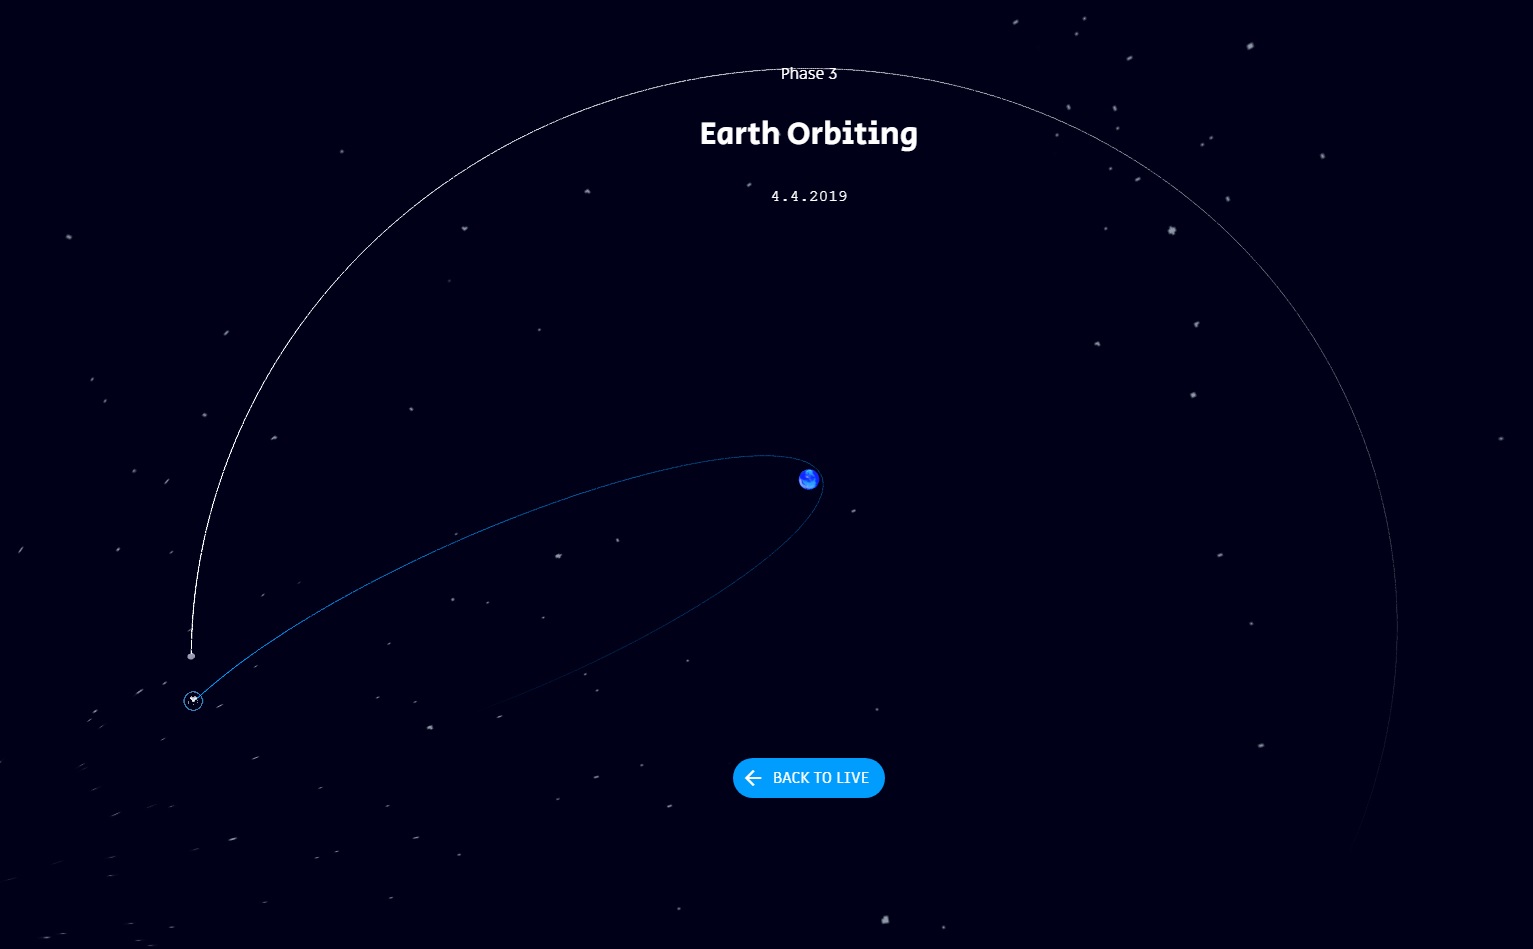
The most interesting part of this project is a simulation, which visually in accelerated time will be shown to us by all the stages that have already been passed and that the Bereshit device has yet to go.
So, click the “Play Simulator” button:


By the way, it was also interesting to look into the code of this site, maybe I missed something, but how to pause during the simulator or change its display speed is not clear if this is possible.
view-source: http: //live.spaceil.com
<script> var currentTime = (new Date()).getTime(); //This line SHOULD be the actual code when the site is online //var currentTime = 1541408502000; //This line is a temporary line for debug purposes var time = currentTime; var interval; var intervalTime = 20; var si = 1; //si stands for 'Speed Index' var speed = 1; // var speeds = [0,1, 30, 60, 300, 900, 1800, 3600, 21600, 43200, 86400]; var speeds = [0,1, 30, 60, 300, 900, 1800, 3600, 21600, 64800, 86400]; var speedsT = ["paused","1 sec/sec", "30 sec/sec", "1 min/sec", "5 min/sec", "15 min/sec", "30 min/sec", "1 hour/sec", "6 hours/sec", "12 hours/sec", "1 day/sec"] var pause = true; var loading = 0; let launchingTime, landingTime; if (Detector.webgl) { var visualizer = new SpaceI.Visualize(document.getElementById('image'), currentTime); //This objects handles everything related to the 3D environment directly. See Space.js for more details. $(document).ready(function () { $.ajax({ type: "GET", url: "data/man.txt", dataType: "text", success: function (data) { visualizer.addMan(data); loadMore(); } }); $.ajax({ type: "GET", url: "data/data_m.txt", dataType: "text", success: function (data) { visualizer.addRouteM(data); loadMore();} }); $.ajax({ type: "GET", url: "data/data_s1.txt", dataType: "text", success: function (data) { visualizer.addRoute(data, 0); loadMore(); } }); $.ajax({ type: "GET", url: "data/data_s2.txt", dataType: "text", success: function (data) { visualizer.addRoute(data, 1); loadMore(); } }); }); animate(); } else { document.getElementById("load").innerHTML = "Unfortunately your browser doesn't seem to support WebGL."; document.getElementById("orbitviewer").style.height = "0px"; } function loadMore() { //this function removes the loading screen and starts the simulation only when all the important files have been loaded. loading++; //4 out of 5 calls for this function are a few lines above this one (in the ajax), the 5th is called after the WebGL scene has been established (see Space.js) $('#loadingStatus').html(`RECEIVING DATA ─ ${loading}/5`); if (loading == 5) { $('#load').hide(); setSpeed(); visualizer.cameraSetup(currentTime); pause = false; document.dispatchEvent(new Event('loadingFinished')); } } function animate() { requestAnimationFrame(animate); visualizer.render(); visualizer.onWindowResize(); //it's important that this function is called whenever the window dimensions change. } function realTime() { time = (new Date()).getTime(); //This line will be used when the site is actually online // time = currentTime; // time = landingTime; si = 1; setSpeed(); visualizer.setTime(time); visualizer.cameraSetup(time); } function changeSpeed() { var s = document.getElementById("speed").value; si = s - 0; //converts string to int speed = Math.sign(speed) * speeds[si]; $("#speedT").text(speedsT[si]); } function setupLine(t, n) { //called from the visualizer object to set the beginning and end of the timeline if(n==0) { launchingTime = t; $('#line').attr('min', t); } else if (n == 1) { landingTime = t; $('#line').attr('max', t); } } function setSpeed() { speed = Math.sign(si) * speeds[Math.abs(si)]; //if 'si' is negative just take the negative speed. $("#speedT").text(((si < 0) ? "-" : "") + speedsT[Math.abs(si)]); } function timeC() { var t = document.getElementById("line").value; time = t - 0; //Converts string to number. If it's stupid and it works it ain't stupid. update(); } </script> The data in separate files for the simulator are here :
live.spaceil.com/data/man.txt
live.spaceil.com/data/data_m.txt
live.spaceil.com/data/data_s1.txt
live.spaceil.com/data/data_s2.txt
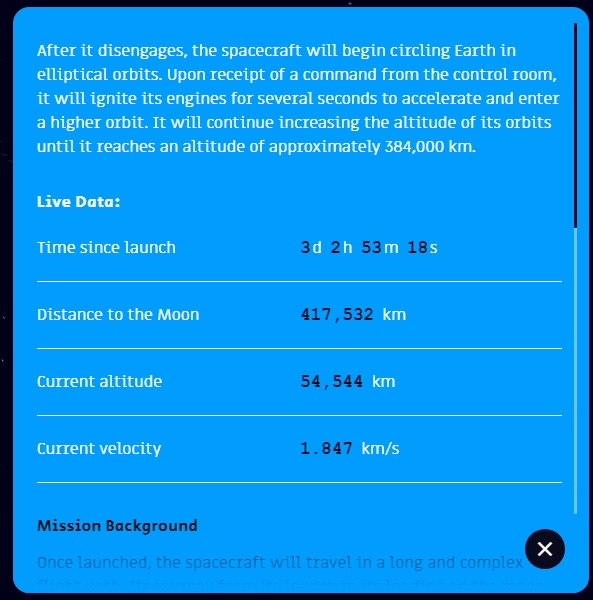
Data for Live Data is obtained as follows (I want to understand - these are calculated data or those that actually come from the device), it’s interesting, you can get it separately and build graphs on the parameter values:
Live data
<div id="live_data_title">Live Data: </div> <table class="more_info_container"> <tbody> <tr> <td id="time_since_launch_label">Time since launch:</td><td id="time_since_launch_number">-</td></tr> <tr> <td id="distance_moon_label">Distance to the Moon:</td><td id="distance_moon_number">-</td></tr> <tr> <td id="altitude_label">Current altitude:</td><td id="altitude_number">-</td></tr> <tr> <td id="current_velocity_label">Current velocity:</td><td id="current_velocity_number">-</td></tr> </tbody> </table>
I think that this resource will be further refined and new data will be added, so we are waiting.
Here is the first update from 26.02 - telemetry on the portal will be updated every 24 hours, this is due to the solution to the current problem of starting engines for maneuvers at the device:
It is wonderful that there are such interesting and informative online resources, studying which you can become part of the history of space research.
Source: https://habr.com/ru/post/441598/
All Articles