OpenStreetMap part average: visualization of hidden data
All of us are accustomed, considering the classic basic substrates on the Internet, to see settlements, roads and their names, houses with their number. But even these property objects are much more than just a name or a number. Buildings have a number of floors, roads have a number of lanes, and cities have a number of inhabitants. But this is only the tip of the iceberg - OpenStreetMap is so rich in a variety of spatial data that you simply never saw some of them. And without specialized renderers you will never see, unless you are interested in editing data, what is this line with strange tags. Today we will make such an ultra-specialized render for showing forest areas.
Step 1. Research.
You can certainly guess with your finger in the sky how they could be denoted, but it’s safer to go to wiki osm. And there we can find the following: boundary = forest_compartment
Therefore, forest areas are designated by polygons with the tag boundary=forest_compartment . True, there is a clarification that it was originally designated as boundary=forestry_compartment , but was less literate. And since the number of uses with the old designation is significant (according to taginfo about 4 thousand times) we will not discount it.
Step 2. Data.
Take data from Geofabrik . Download the file to the whole of Russia - russia-latest.osm.pbf . Using osmconvert we get data in o5m format for subsequent filtering.
osmconvert russia-latest.osm.pbf -o=russia-latest.o5m Now we filter only the data we need using osmfilter
osmfilter russia-latest.o5m --keep="boundary=forest_compartment =forestry_compartment" -o=forest_compartment-local.o5m Step 3. Vector tiles.
A little bit of theory. The old approach is to request some data from a large database, get a picture from them, save it in order to give it to the client in the future. In the new - from a large database to request some data and save them for later transfer to the client. And let the client himself turns them into a picture. Profit, as it were, on the face - we rendered the load on the rendered image onto the client’s shoulders. Of the minuses - on the coffee machine may not be able to see the map, need support WebGL.
And so Mapbox suggested a vector tile format and a container for them in the form of an sqlite database. Therefore, now it is not a scattering of files in folders, but a neat single file. A vector tile contains logical layers (houses, roads, etc.) that consist of geometry and attributes.
Here we will prepare them for our forest quarters. I will use the TileMaker tool. At the input it accepts OSM data in pbf format, so after filtering we need to convert it back to this format.
osmconvert forest_compartment-local.o5m -o=forest_compartment-local.pbf Now we need to explain to TileMaker which layers and with which attributes we need, according to the documentation .
Step 4. Layers?
And what layers do we need? And it depends on what we show. Those. first of all, we must already somehow visualize the visual part. And how it can be achieved from the available data. From OSM data we have a polygon mesh and their attributes. In the attributes there is the name of the forest district and the number of the quarter.

From this the easiest to display the quarter and sign it with your number. Those. we need a polygonal layer, in the center of the polygon we will display an inscription with its number.
And here the first feature of vector tiles comes up. When a large source polygon falls on different tiles, only its parts fall into tiles. And when drawing it, there are two different polygons, respectively, for them there will be two signatures in the center of their halves.

Therefore, for the vector tiles prepare a separate layer with the inscriptions, when there is still all the necessary information about the geometry.
Bottom line: we need two layers, polygonal for the fill and dot for the signature. Create a file config.json .
{ "layers": { }, "settings": { "minzoom": 11, "maxzoom": 11, "basezoom": 14, "include_ids": false, "author": "freeExec", "name": "Forest Compartment RUS", "license": "ODbL 1.0", "version": "0.1", "description": "Forest compartment from OpenStreetMap", "compress": "gzip", "metadata": { "attribution": "<a href=\"http://www.openstreetmap.org/copyright/\" target=\"_blank\">© OpenStreetMap</a>", "json": { "vector_layers": [ ] } } } } In the layers section we specify what we need.
"layers": { "forest_compartment": { "minzoom": 11, "maxzoom": 11 }, "forest_compartment_label": { "minzoom": 11, "maxzoom": 11 } }, The names of the layers are indicated and on what scale we will show them.
"json": { "vector_layers": [ { "id": "forest_compartment", "description": "Compartment", "fields": {}}, { "id": "forest_compartment_label", "description": "Compartment", "fields": {"ref":"String"}} ] } In the metadata, we tell the future visualizer what attributes we have available. For the label layer, we will have the block number in ref .
Step 5. Data processing.
For this purpose, a script in the lua language serves, which will decide which objects from the OSM data we need, to which layer to send them and with which attributes.
Let's start with the process.lua file template.
-- Nodes will only be processed if one of these keys is present node_keys = { } -- Initialize Lua logic function init_function() end -- Finalize Lua logic() function exit_function() end -- Assign nodes to a layer, and set attributes, based on OSM tags function node_function(node) end -- Similarly for ways function way_function(way) end What we have here:
Node_keys - there are a lot of points in the OSM data, if we poke into this script with each, the processing will last a very long time. This is a kind of filter that tells us which points are interesting to us with which keys.
function node_function (node) - the function will be called for every point that is interesting to us from the previous item. Here we must decide what to do with it.
function way_function (way) is a function that will be called on any line and on relations with the multipolygon and boundary type, since they are considered area objects.
Start writing code. First we will indicate which points we need:
node_keys = { "boundary" } Now we write the function for processing them:
function node_function(node) local boundary = node:Find("boundary") if boundary == "forestry_compartment" or boundary == "forest_compartment" then local ref = node:Find("ref") if ref ~= "" then node:Layer("forest_compartment_label", false) node:Attribute("ref", ref) end end end What happens here: read the value of the boundary key through the node:Find("") . If it is forest_compartment , then we read the block number from the ref tag. If it is not empty, then this object is added to our layer with labels, via the Layer("_", ___) . In the attribute of the layer ref save the block number.
Almost as easy for areal quarters:
function way_function(way) local boundary = way:Find("boundary") if way:IsClosed() and ( boundary == "forestry_compartment" or boundary == "forest_compartment" ) then way:Layer("forest_compartment", true) way:AttributeNumeric("nomerge", way:Id()) local ref = way:Find("ref") if ref ~= "" then way:LayerAsCentroid("forest_compartment_label", false) way:Attribute("ref", ref) end end end Here we additionally check that the line is closed, since It happens that the tags are present simply on the segments. It is worth noting that the forest_compartment layer forest_compartment areal (therefore, the second argument in the Layer("", true)) function Layer("", true)) , and we take the place for the signature as the center of the LayerAsCentroid figure.
It is also worth paying attention to the attribute that we add, although we did not specify it in the config - nomerge . It is needed to defeat another feature, this time already the TileMaker converter (although in the new version there is a parameter to disable it).
The peculiarity is that for optimization, when there are many objects with the same attributes in one layer, the converter for them combines the geometry into one. For example, we have a street consisting of three separate segments, which in the end will be sent to the render three times. This is longer, compared to the system that we would send a single object to the render, but with a slightly more complex (uniting them all) geometry.
In our case, all adjacent neighborhoods would be united into one large polygon, and we do not need this. Therefore, we add the number of the object so that they are different and not combined.
Now it's time to start the process of creating vector tiles.
tilemaker forest_compartment-local.pbf --output forest_compartment-local.mbtiles As a result, we should have a forest_compartment-local.mbtiles file forest_compartment-local.mbtiles
Step 6. Create a style.
We get an account on mapbox.com . In Mapbox Studio, in the Tileset section, create a new tileset by dragging our previously created file into the download window. Within a minute, it should be processed and added to the list.
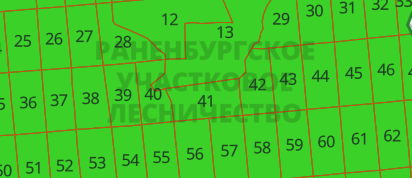
Now go to the Styles section and create a new one based on the finished Light, so that we can see the main map elements, such as roads, settlements, etc. We are going to Cheboksary because forest quarters were noticed there.
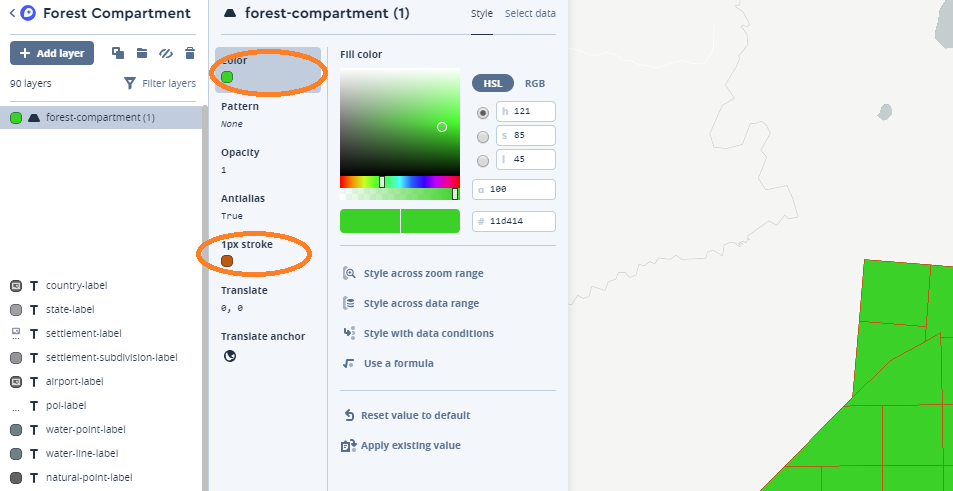
We descend to the 11th level of the scale (we only created tiles for it) and click the Add layer button. In the data source tab we find our data source forest_compartment-local-XXXXX , in it we select the polygonal layer. It should be highlighted on the right green.

Next on the style tab, set the fill color to green and the strokes to brown.
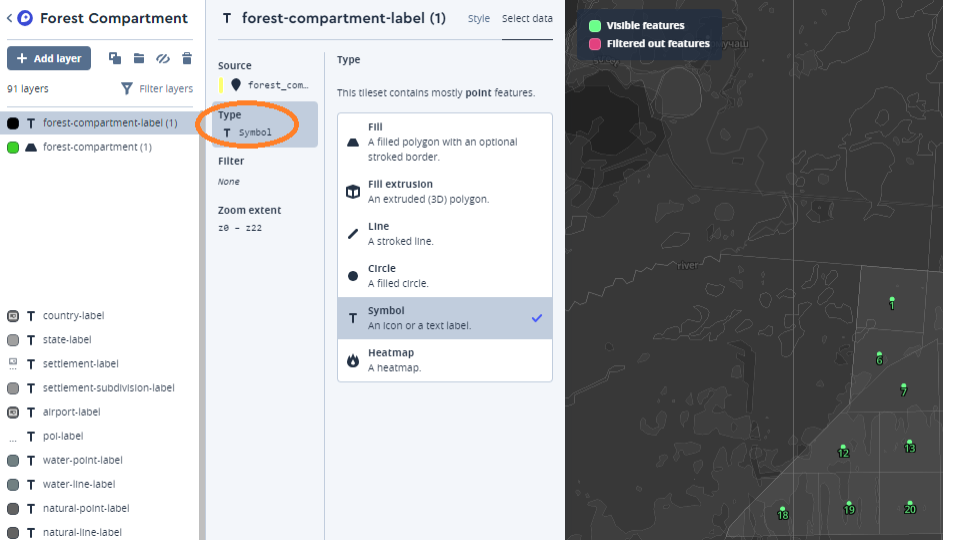
Now it remains to add a signature. We add a new layer, only this time we select forest_compartment_label in the data, and type select symbol , the numbers should appear on the right.
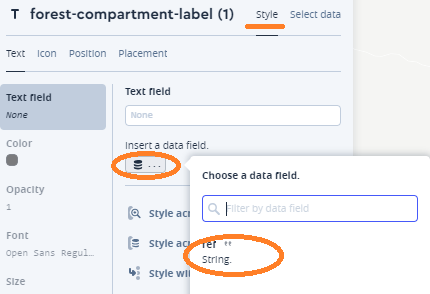
In the style tab, we indicate that we need to display our ref attribute.
That's as if everything, click on the right side of the screen publish and we can share the link so that others can look at our creation. But the display of maps is not free, as elsewhere, so I will not give you my link, so as not to get to the effect.
PS: Perhaps in an additional article I will tell you how I achieved the location of the signature with the name of the forest area on a group of neighborhoods in it.
')
Source: https://habr.com/ru/post/441296/
All Articles