Kibana User Guide. Visualization. Part 2
The second part of the translation of official documentation on data visualization in Kibana.
Link to original material: Kibana User Guide [6.6] "Visualize
Link to 1 part: Kibana User Guide. Visualization. Part 1
Visualization of controls
A warning. This feature is experimental and may be modified or removed in a future release. Elastic will make every effort to correct any problems, but the experimental features are not subject to the support of the official GA functions of the GA.
The visualization of controls allows you to add interactive input data to Kibana dashboards. You can create two types of input information: a drop-down list or a one-of-many switch.
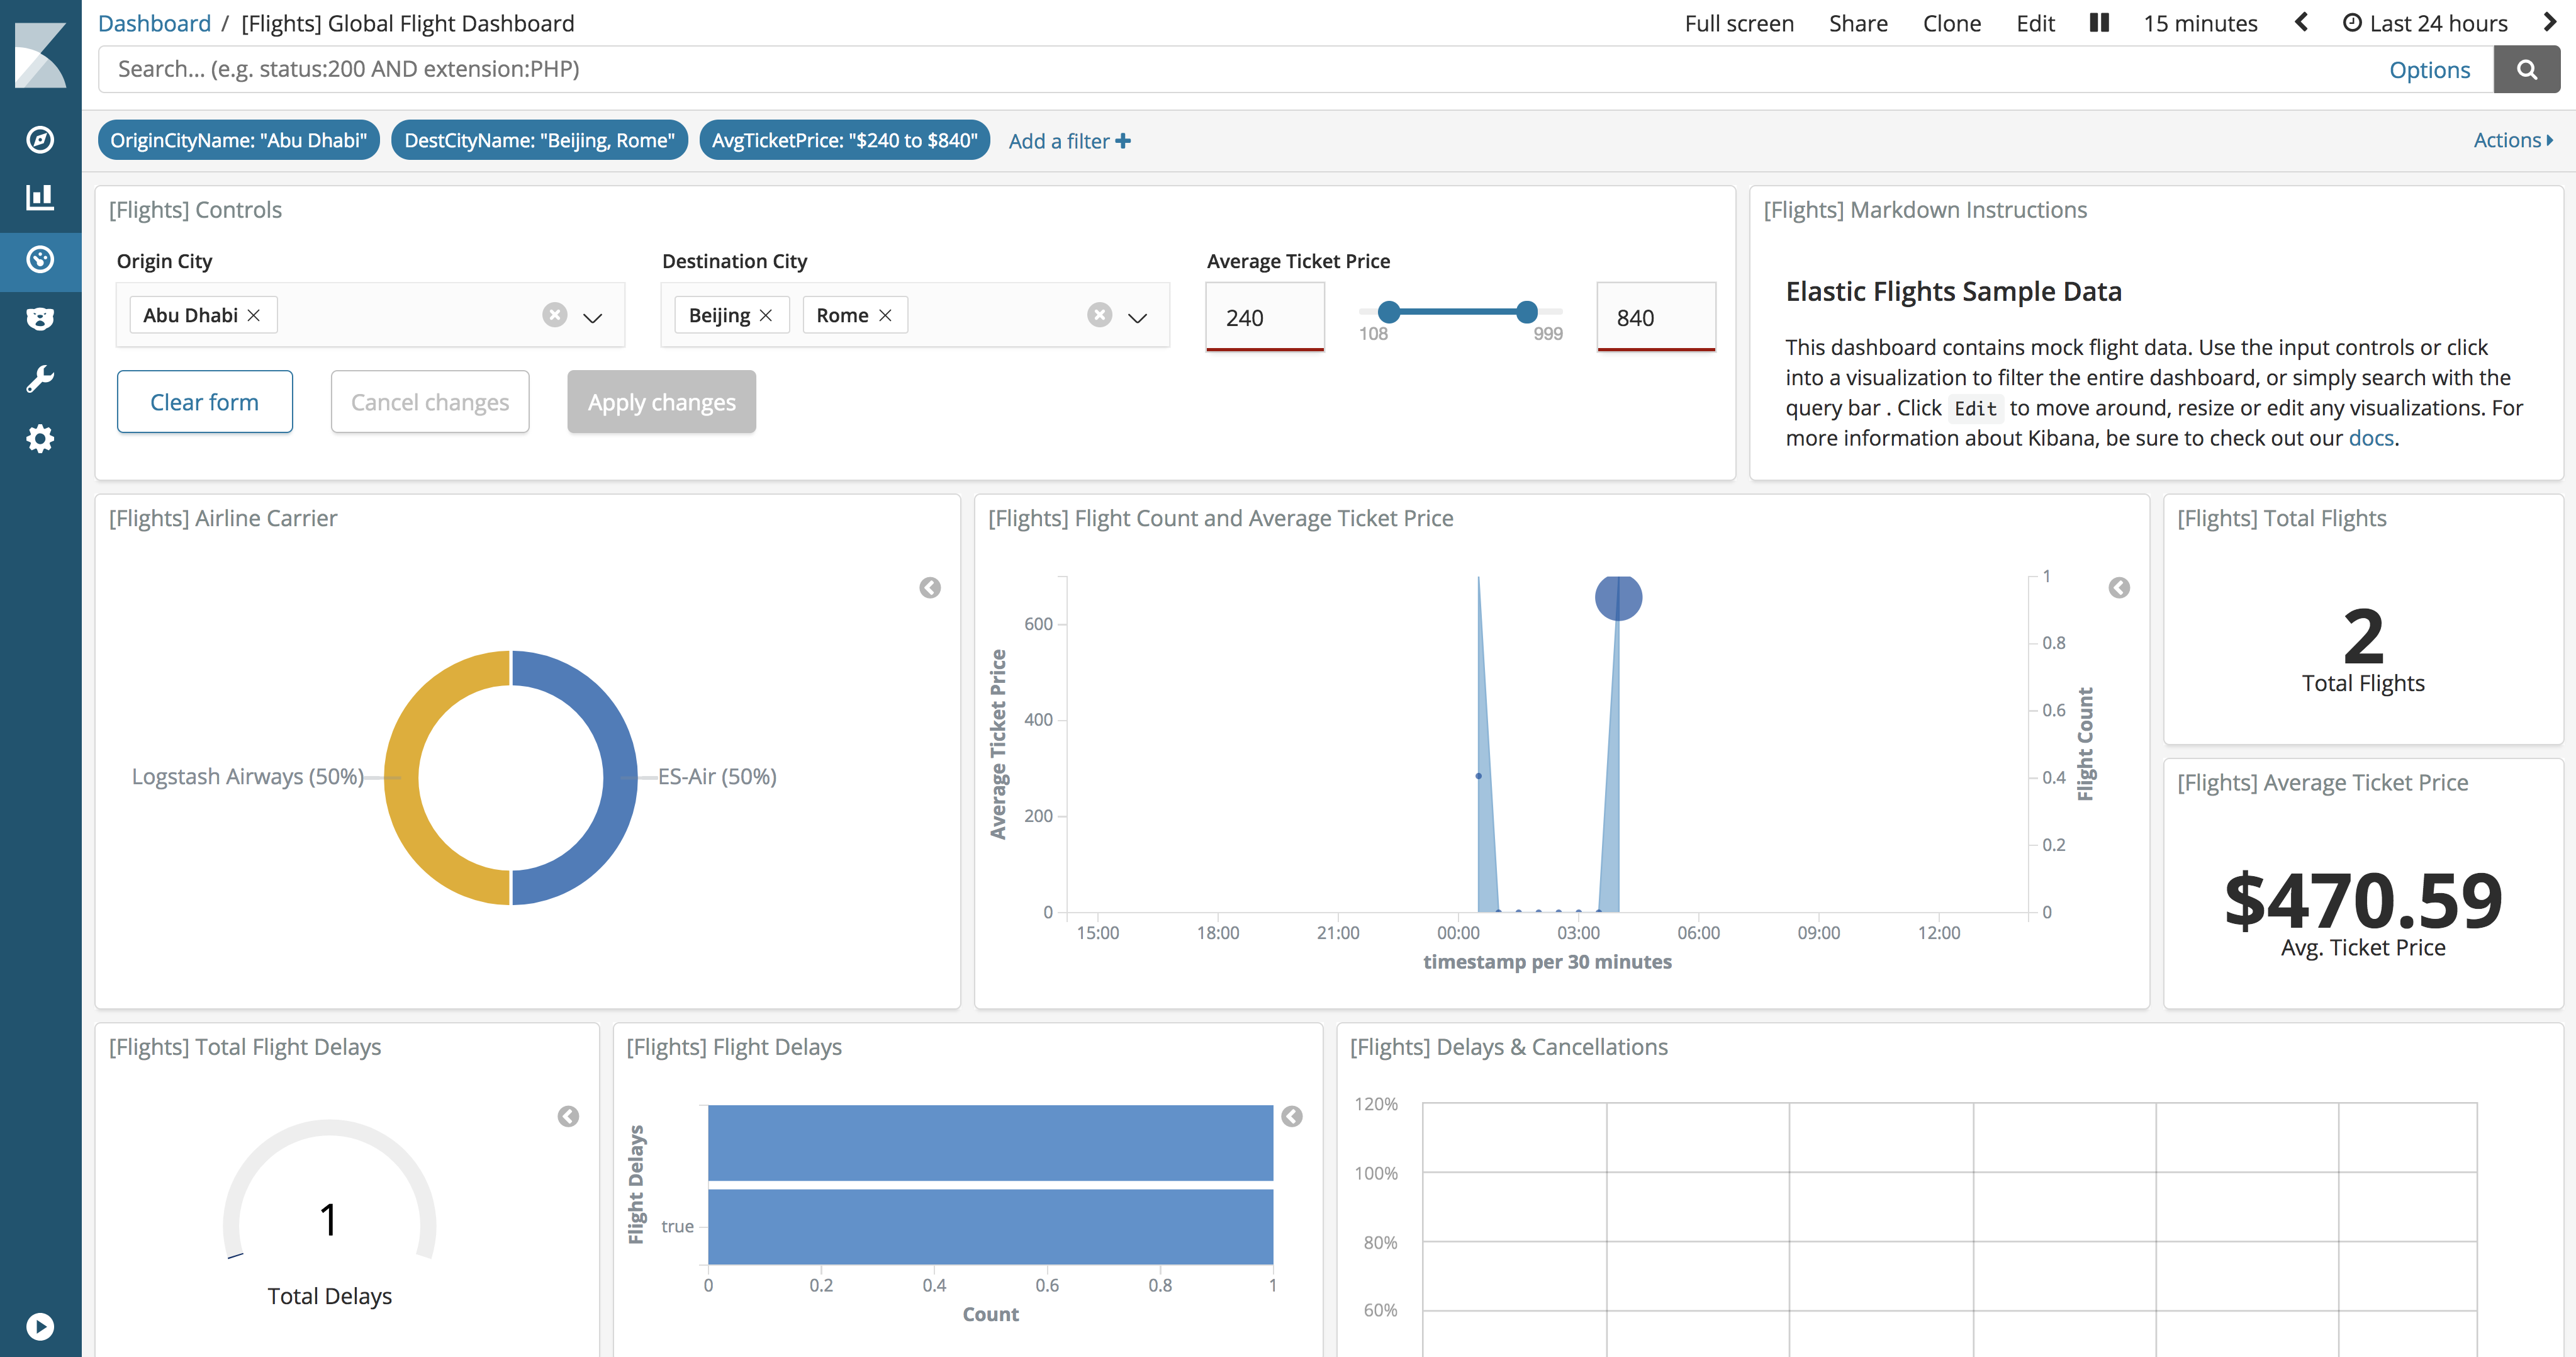
Adding Controls
To initialize the visualization of controls, open the Visualization tab and click the + button . Scroll down to the Others section and select Controls .
Dropdown menu
A drop-down menu allows users to filter content by selecting one or more options from the list. The drop-down menu is dynamically filled with the results of aggregation of values (terms, approx. Lane).
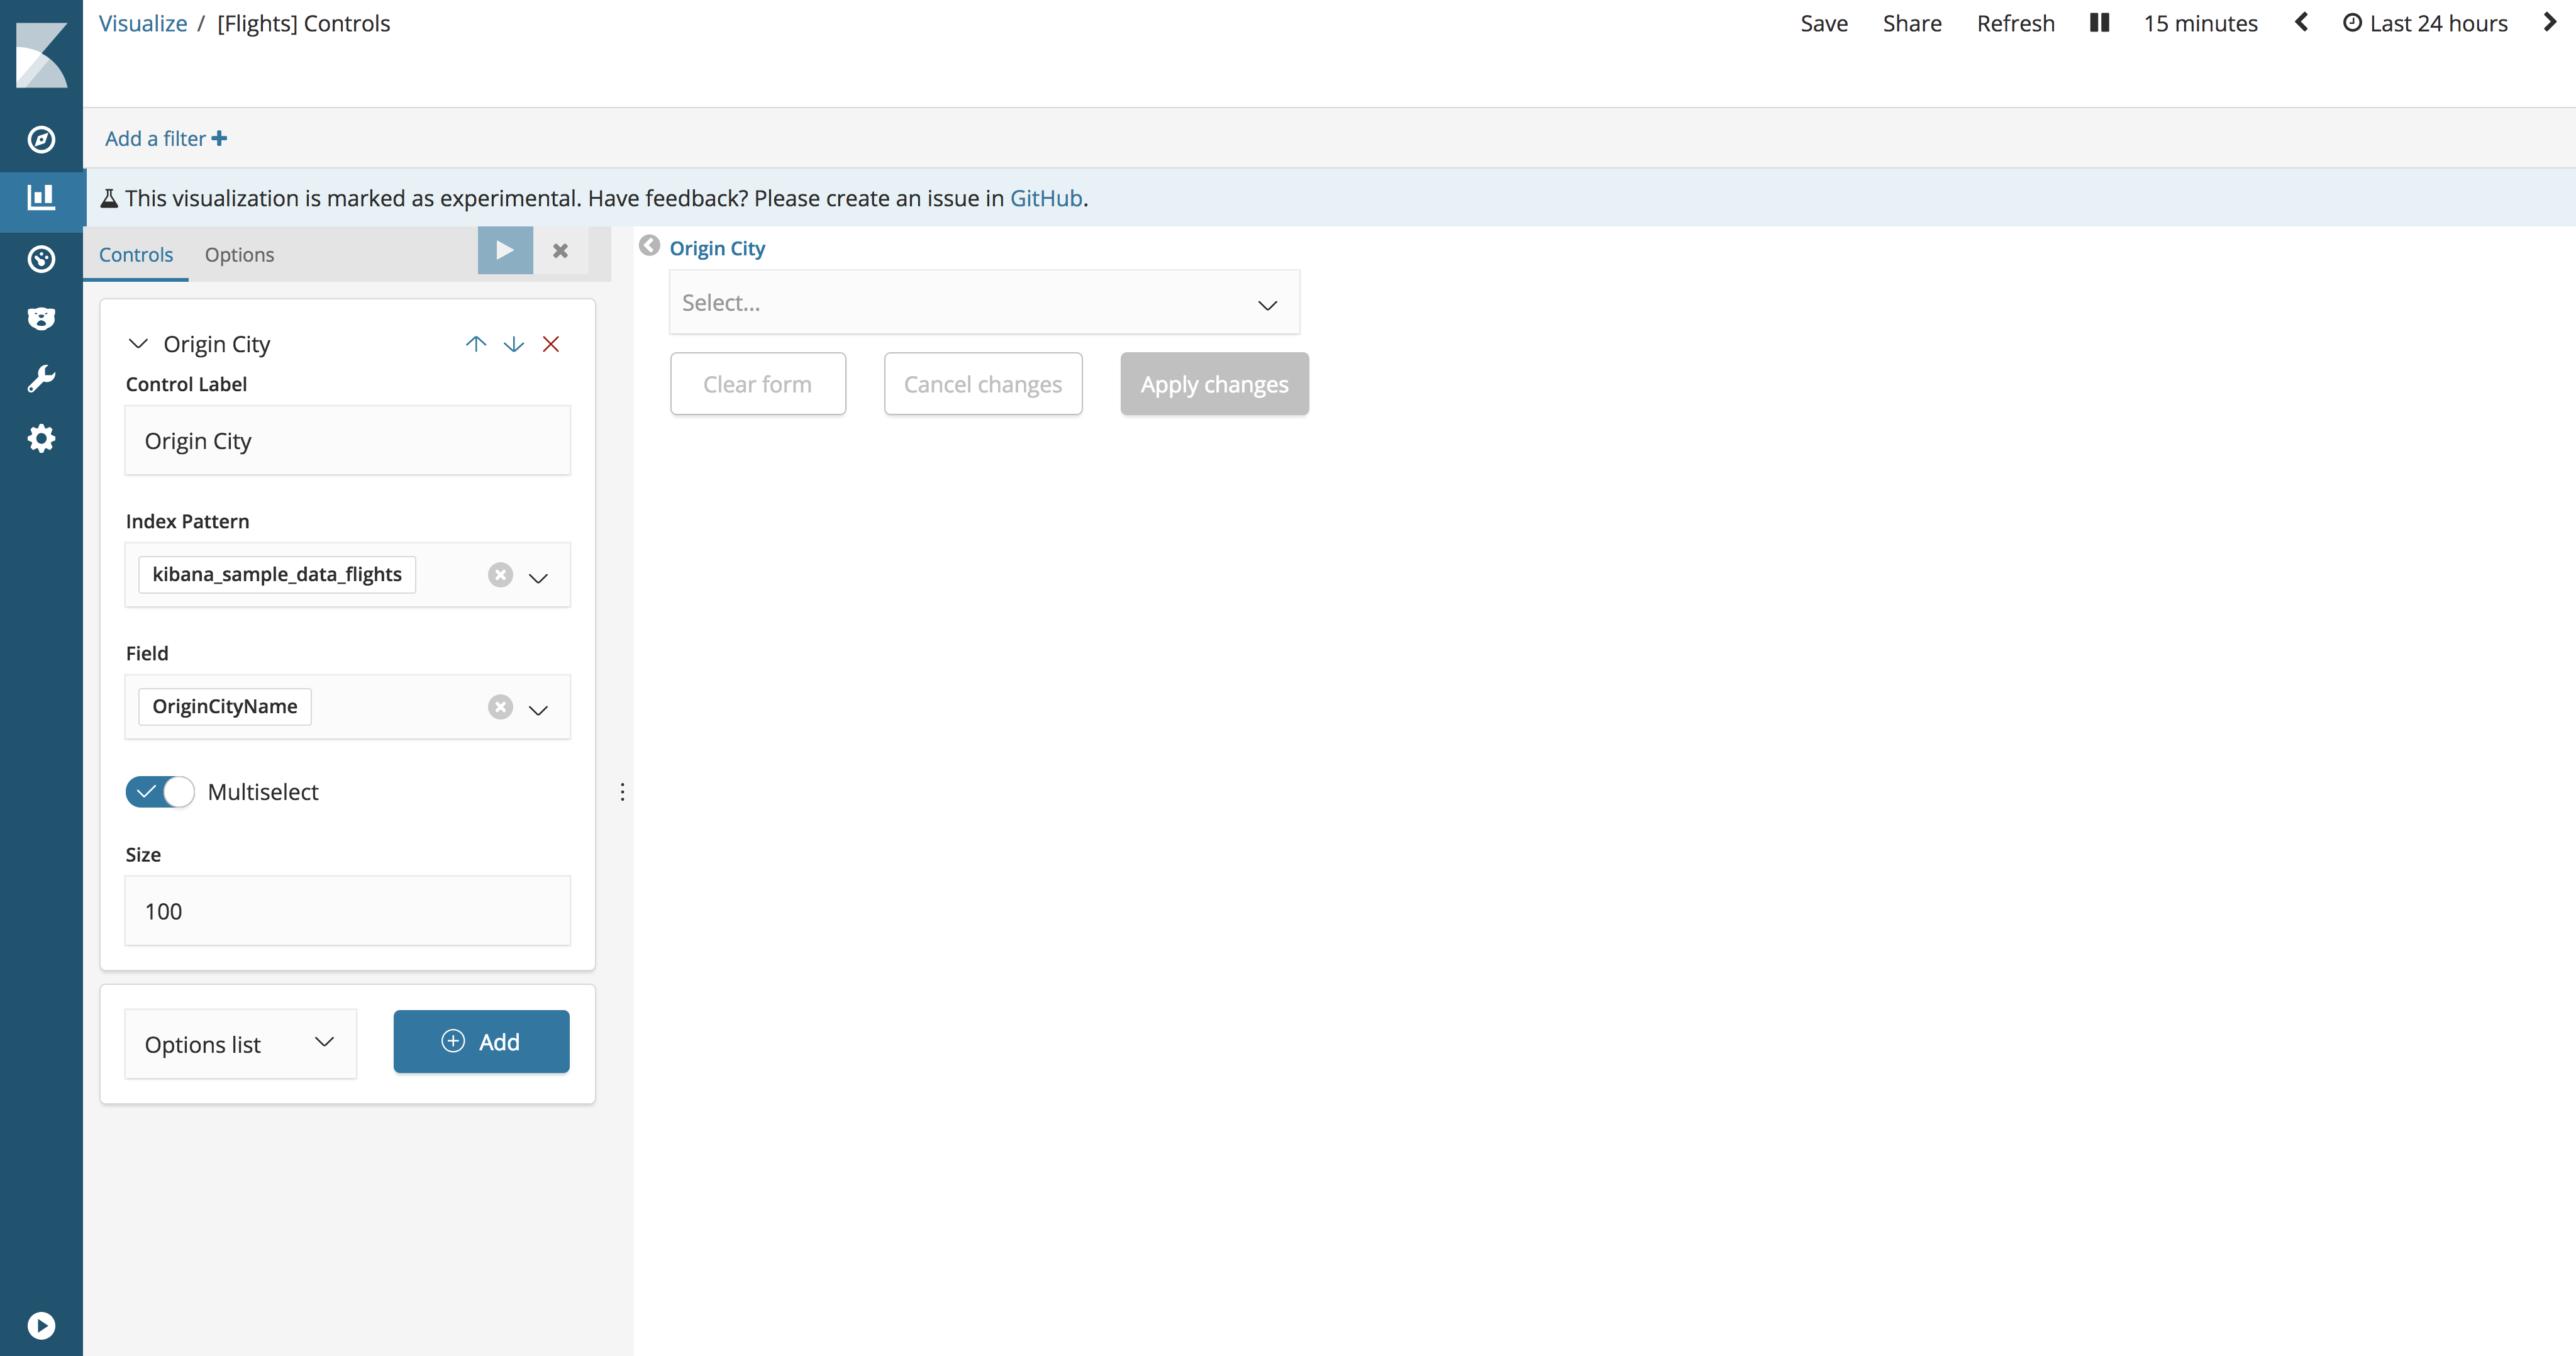
Control Label. Signature for dropdown list. By default, the label is the name of the field.
Index Pattern. An index template that contains a dataset for visualization.
Field. The field is used to populate the list of options and is filtered when users interact with the input. The list of available fields is obtained from a defined index pattern.
Parent control. A control for creating chains of drop-down menus, such that the selection in the first menu filters the values in the second menu. Only available when creating multiple drop-down lists.
Multiselect. When enabled, a drop-down menu allows users to select multiple options.
Size. The number of options to include in the list.
Range slider
Adjustable range allows users to filter content within a rank of numbers. The minimum and maximum values of the adjustable range are dynamically determined by the minimum and maximum values of the aggregation.
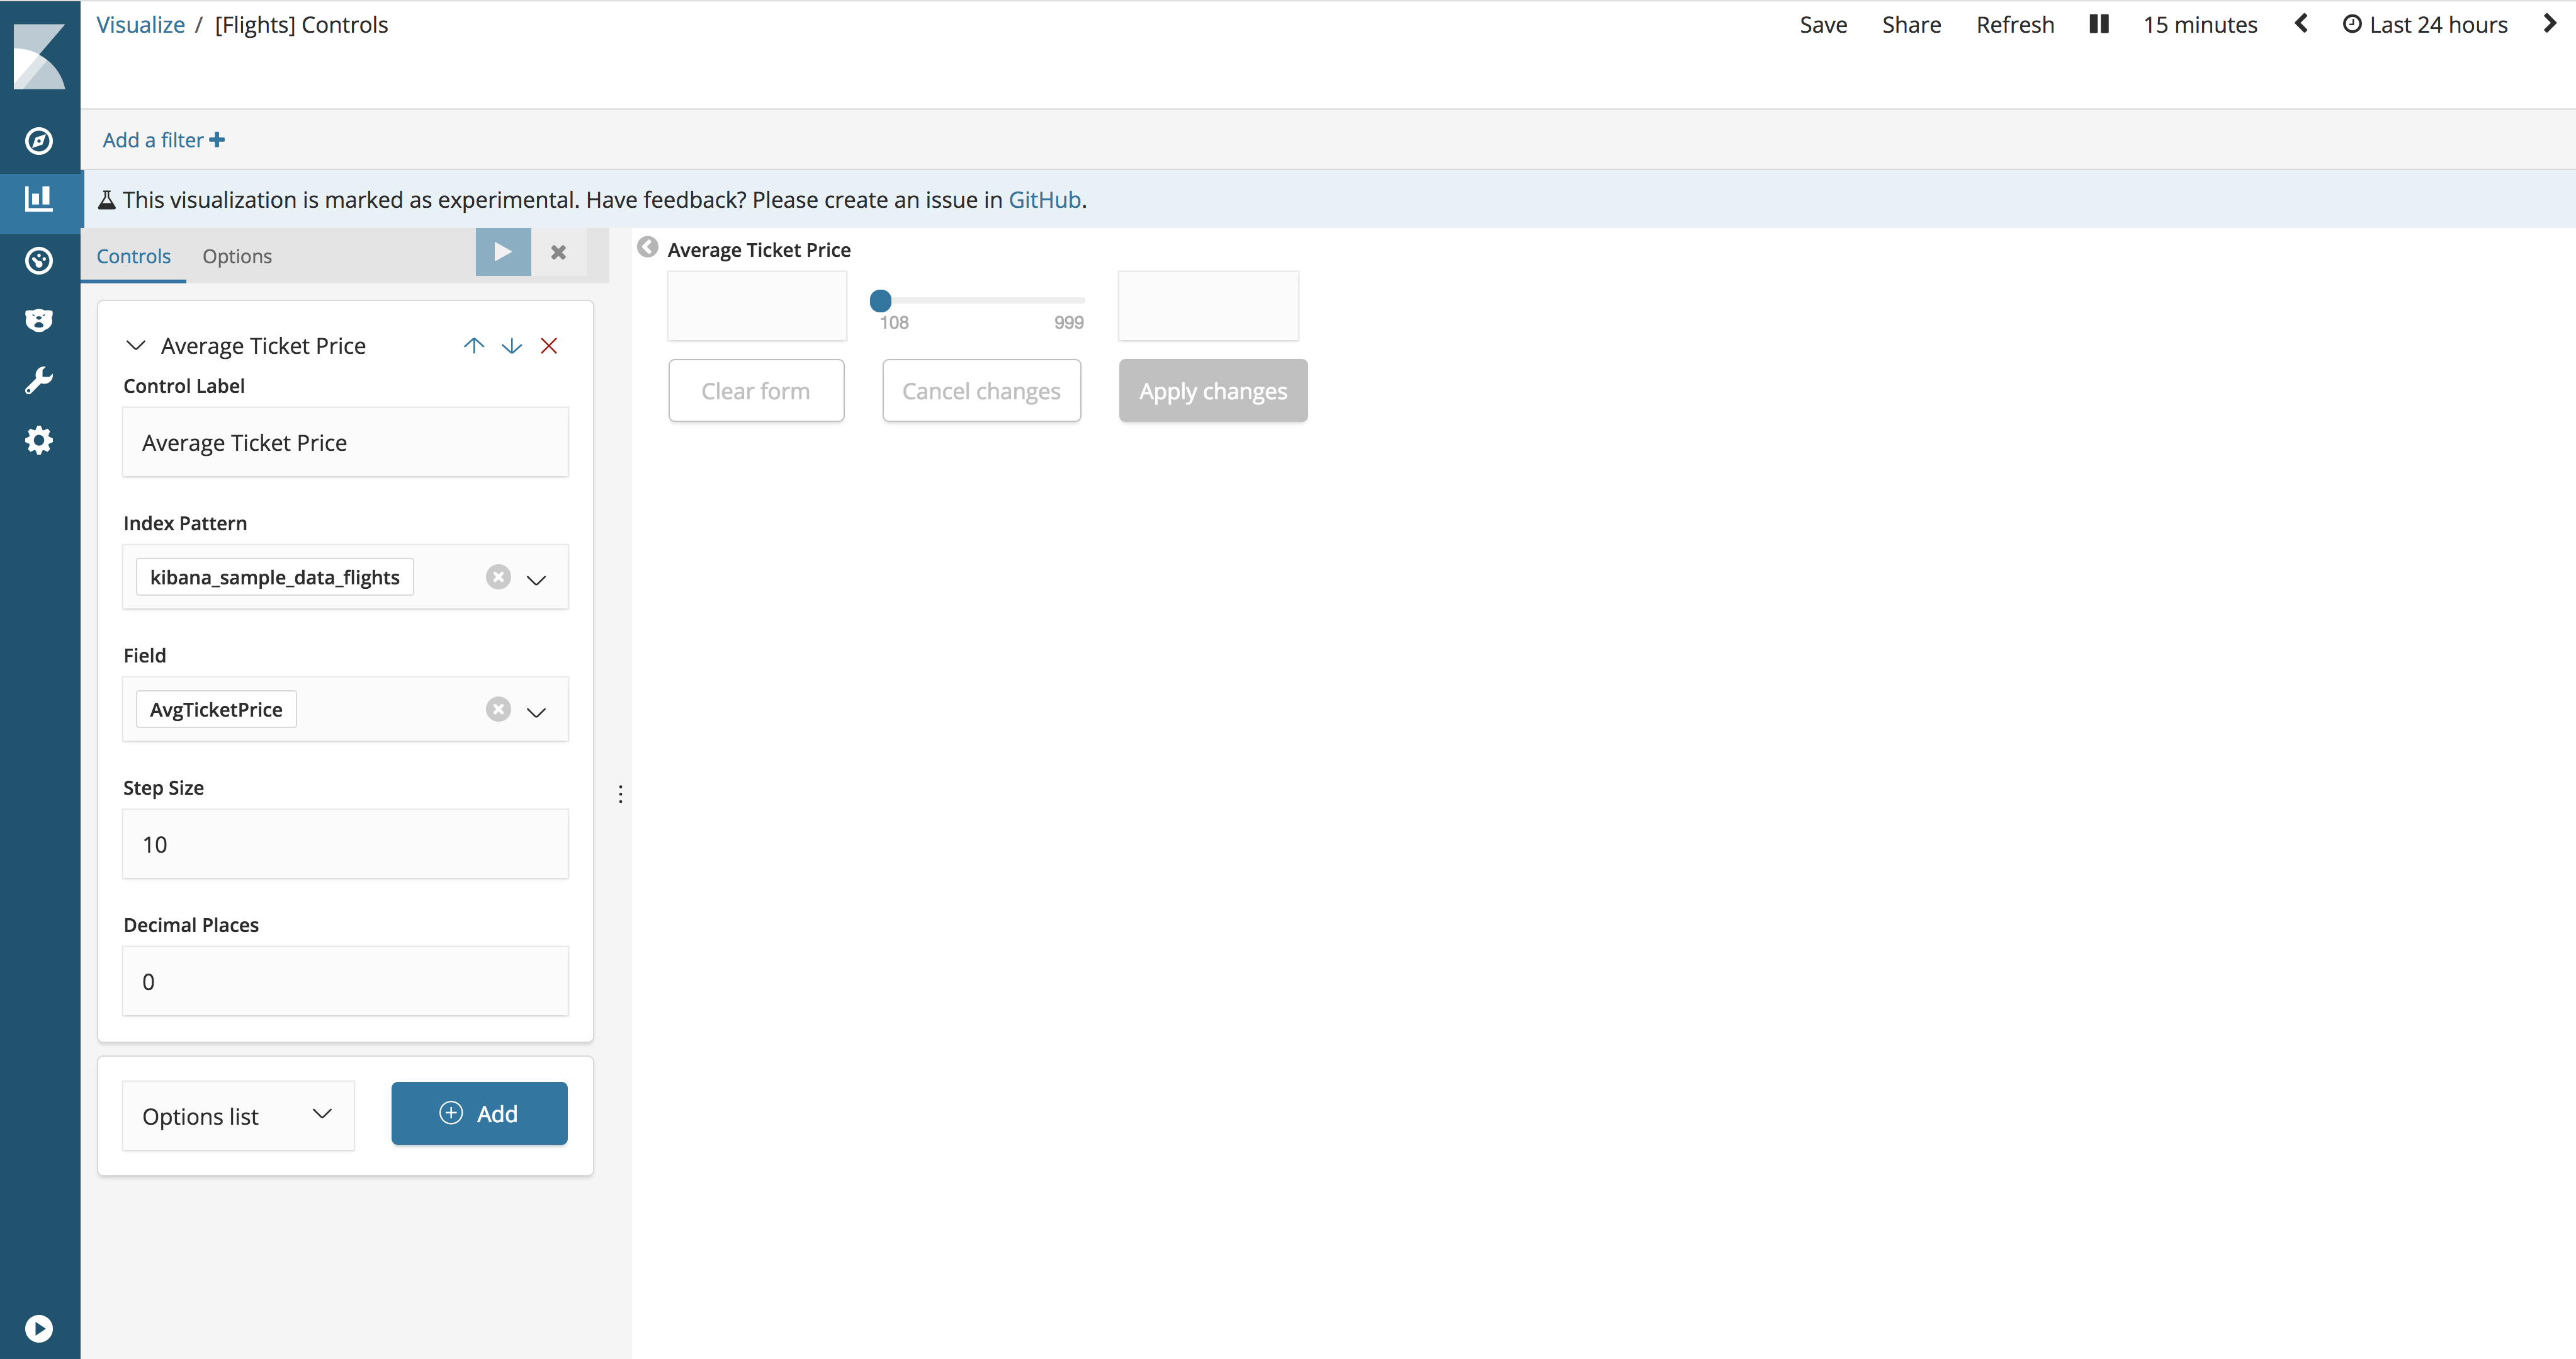
Control Label. Signature adjustable range. By default, the signature is the name of the field.
Index Pattern. An index template that contains a dataset for visualization.
Field. The field is used to populate the adjustable range and filter it when users interact with the input data. The list of available fields is populated from a specific index pattern.
Step Size. Increases / decreases slider size.
Decimal Places. The number of decimal places after the comma.
Global variables
Click the Options tab to customize the settings that apply to all input controls in the Controls visualization.
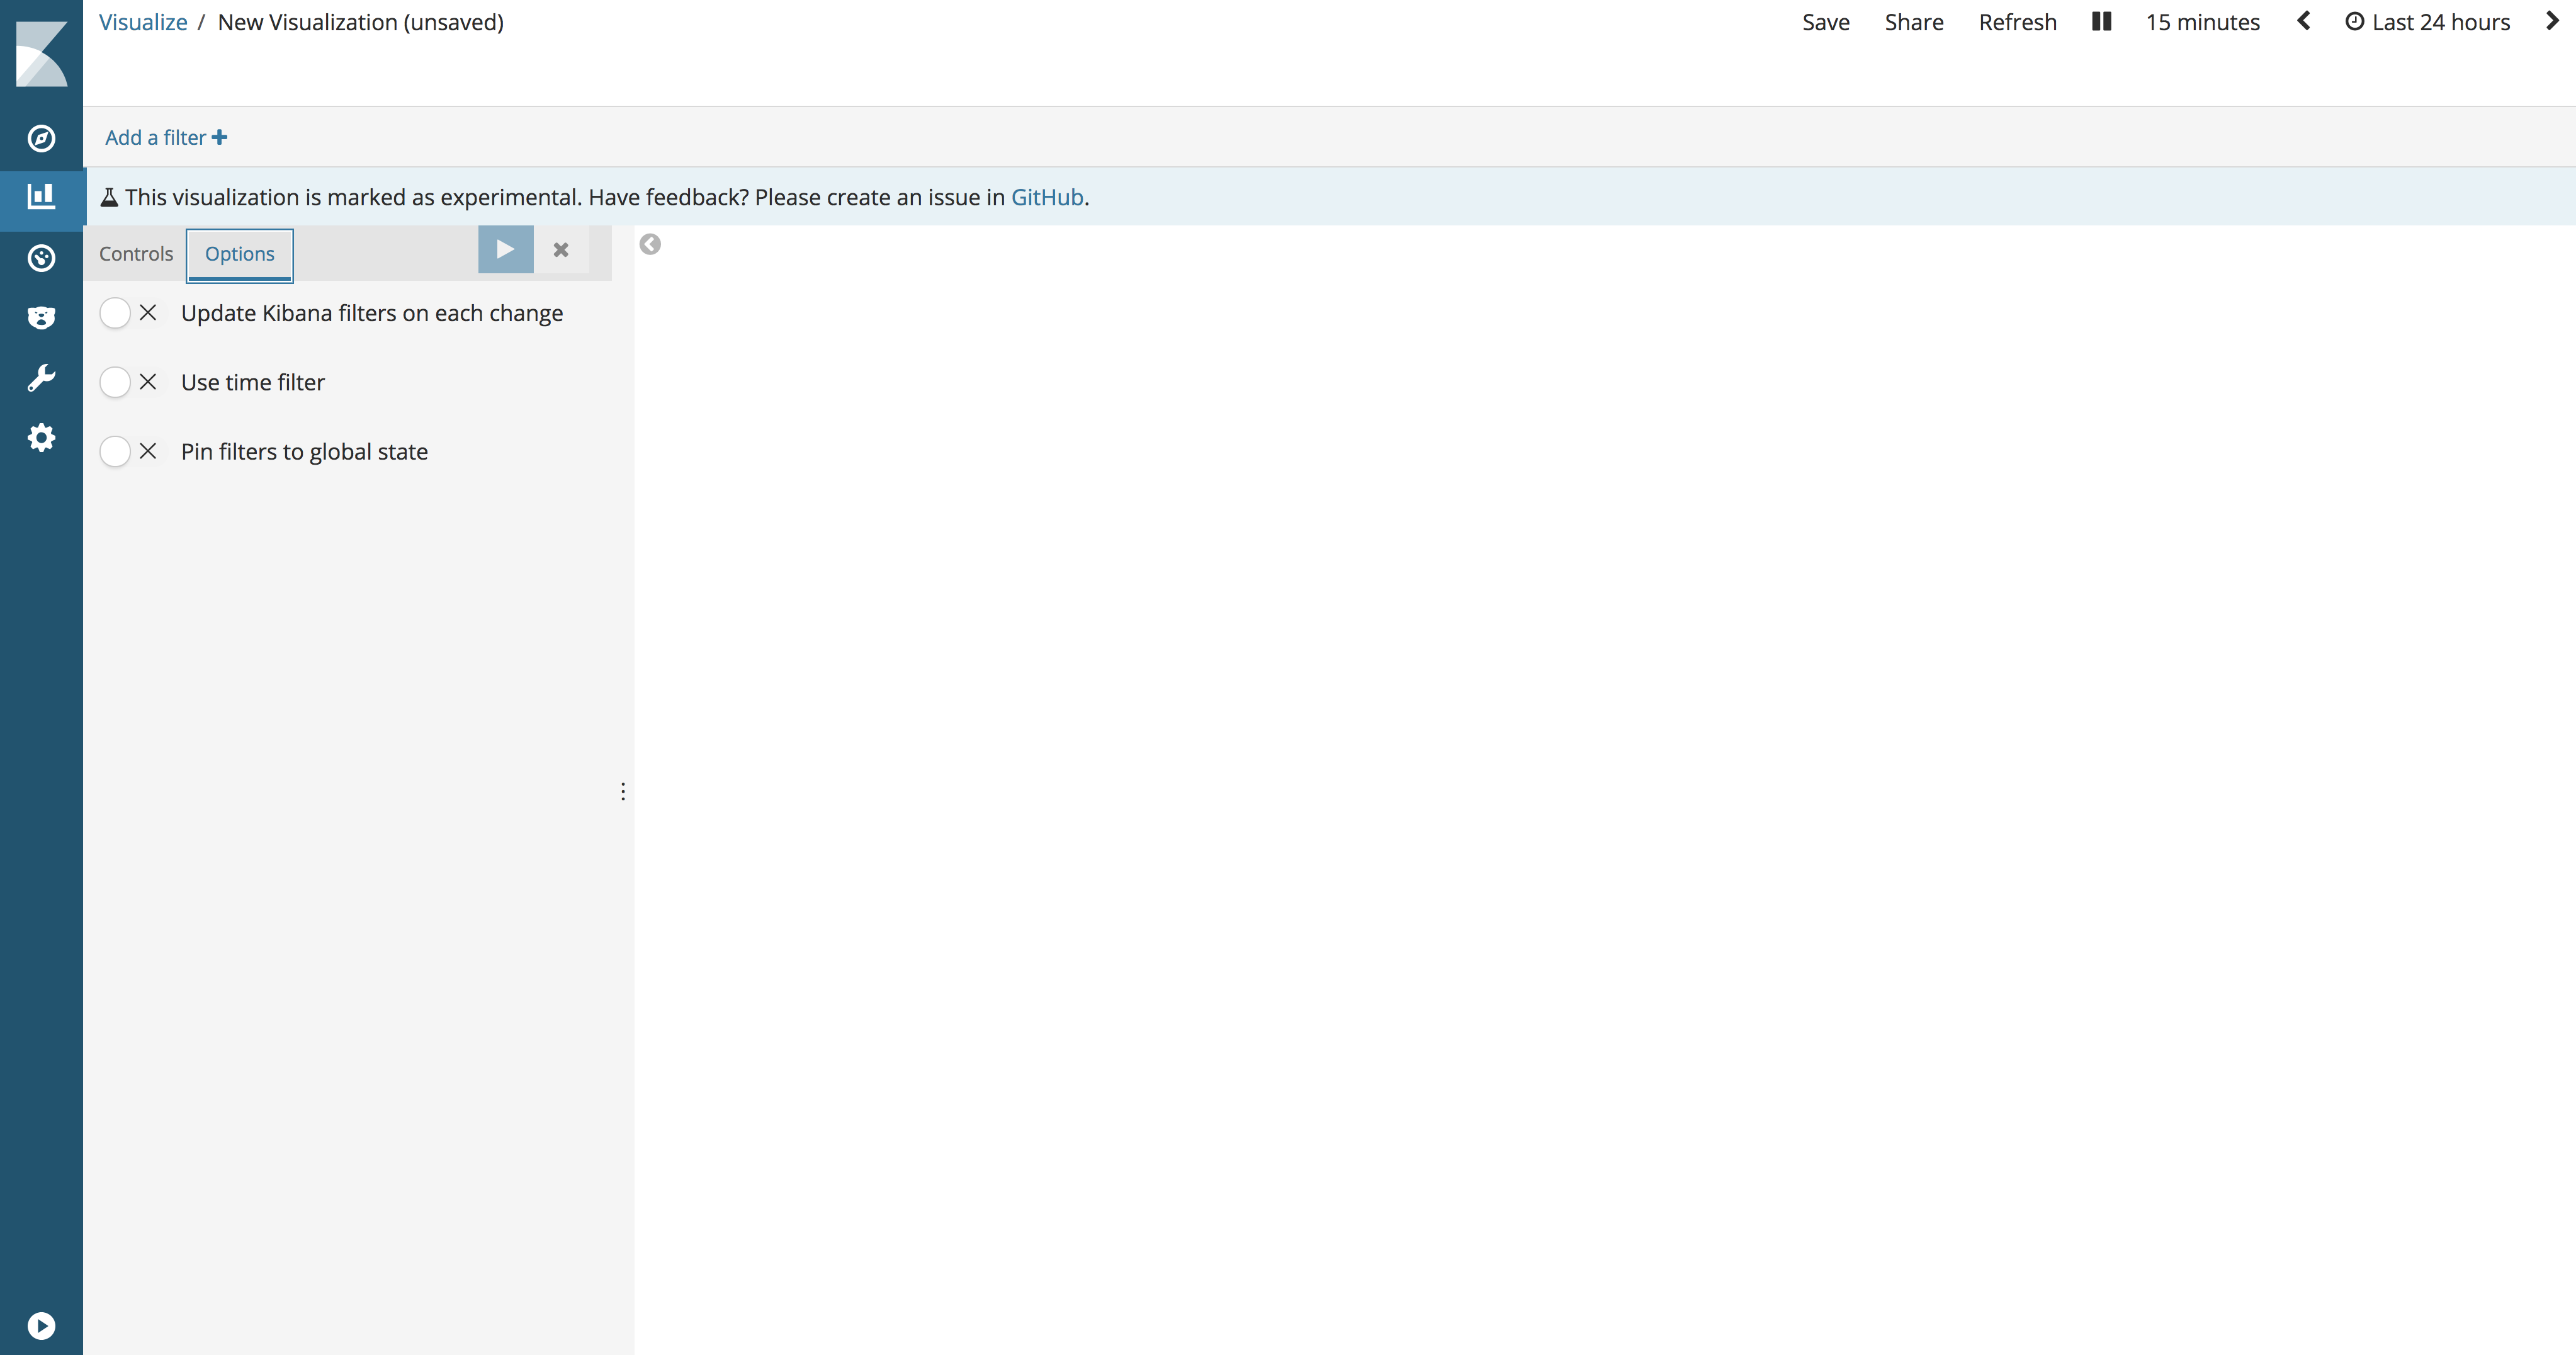
Update Kibana filters on each change. When enabled, all incoming interactions create filters the same hour, which cause the dashboard to be updated. When disabled, Kibana filters are created when the user clicks Apply changes. 
Use time filter. When enabled, aggregations that are used to generate a drop-down list of options and a minimum-maximum range are tied to Kibana global time.
Pin filters to global state. When enabled, all filters created by interacting with the input data are automatically fixed.
Data table
Metric aggregations:
Count. Counting aggregation returns the net count of the elements in the selected index pattern.
Average. This aggregation returns the average of a number field. Select a field from the drop-down list.
Sum. Returns the total amount of a numeric field. Select a field from the drop-down list.
Min. Returns the minimum value in a numeric field. Select a field from the drop-down list.
Max. Returns the maximum value in a numeric field. Select a field from the drop-down list.
Unique Count. Cardinal aggregation returns the number of unique values in a field. Select a field from the drop-down list.
Standard Deviation. Aggregation of general statistics returns the standard deviation of data in a numeric field. Select a field from the drop-down list.
Top Hit Aggregation of top values returns one or more top values from a special field in your document. Choose the field from the drop-down list, the type of document sorting, the number of values to be returned.
Percentiles Interest Aggregation divides numeric field values into specified ranges. Select a field from the drop-down list, then define one or more areas in the Percentiles fields. Click the X to remove the percent field. Click + Add to add a percentage field.
Percentile Rank Aggregation of percentage rank returns the percentage ranking of the selected numeric field. Select a field from the drop-down list, then define one or more percentage rank values in the Values fields. Click the X to remove the value field. Click + Add to add a value field.
Aggregations of parent data sources:
For each aggregation of the parent information source, it is necessary to determine the metric for which the aggregation is calculated. This may be one of the existing metrics or a new one. You can also invest these aggregations (for example, to obtain a third derivative).
Derivative. Derivative aggregation counts the derivative of certain metrics.
Cumulative Sum. The aggregation of the cumulative sum counts the cumulative sum of certain metrics in the parent histogram.
Moving average. Moving average aggregation will insert a window through the data and write the average value of this window.
Serial Diff. Sequential differentiation is a method where values in a time series are subtracted from themselves in another time period or delay.
Related Source Aggregations:
As in the case of aggregation of parent sources, you need to specify the metric for which the aggregation of the related source will be calculated. In addition, you need to provide for the aggregation of segments, which will determine on which segments the aggregation will run.
Average Bucket. The segment average calculates the average value of certain metrics in the aggregation of related sources.
Sum Bucket. Calculates the sum of the values of a specific metric in the aggregation of a related source.
Min Bucket. Returns the minimum value of a specific metric in a relative source aggregation.
Max Bucket. Returns the maximum value of a specific metric in a related source aggregation.
You can create an aggregation by clicking on the + Add Metrics button.
Enter a string in the Custom Label field to change the label.
Date Histogram. The time histogram is based on a numerical field and is organized by date. You can define time frames for intervals in seconds, minutes, hours, days, weeks, months, or years. You can also define a default interval by selecting Custom as the interval and specifying the number and unit of time in the text field. The default time interval units are: s for seconds, m for minutes, h for hours, d for days, w for weeks, y for years. Different units support different levels of accuracy, up to one second. Intervals are signed at the beginning of the interval using the key-date, which is returned from Elasticsearch. For example, the first day of the month will be displayed in the tooltip for the monthly interval.
Histogram. The standard histogram is based on a numeric field. Determine the integer interval for this field. Check the Show empty buckets box to include empty intervals in the histogram.
Range. Using rank aggregation, you can determine the ranks for the numeric field values. Click Add Range to add a set of rank endpoints. Click the red symbol (x) to remove the rank.
Date Range. Time rank aggregation reports values that are in the specified date range. You can specify date ranges using mathematical date expressions. Click Add Range to add a set of rank endpoints. Click the red symbol (/) to remove the rank.
IPv4 Range. IPv4 rank aggregation allows you to define IPv4 address ranges. Click Add Range to add a set of rank endpoints. Click the red symbol (/) to remove the rank.
Terms. Aggregation of values allows you to define the top or bottom n elements of this field for display, ordered by number or custom metric.
Filters. You can define a set of filters for data. It is possible to specify a filter as a query string or in JSON format, as well as in the Discover search tab. Click Add Filter to add another filter. Click the label button to open the label field where you can type the name to display on the visualization.
Significant Terms. Displays the results of experimental aggregation of signed values.
Geohash Geohash aggregation displays points based on geographic coordinates.
Once you have determined the aggregation type of a segment, you can define aggregation subgroups to improve visualization. Click + Add sub-buckets to create a nested segment, then select Split Rows or Split Table , then select an aggregation from the type list.
You can use the up / down arrows to the right of the aggregation type to change the aggregation priority.
Enter a string in the Custom Label field to change the label.
You can click on the Advanced link to display more options for your metrics or segment aggregation:
Exclude Pattern. Specify a template in this field to exclude from the results.
Include Pattern. Specify a template in this field to include in the results.
JSON Input. A text field where you can add specific properties in JSON format to merge with a specific aggregation, as in the following example:
{ "script" : "doc['grade'].value * 1.2" }
Note. In Elasticsearch 1.4.3 and later, this functionality needs Groovy dynamic scripting enabled.
The availability of these parameters depends on the aggregation you choose.
Select the Options tab to change the following aspects of the table:
Per Page. This field controls the numbering of the pages of the table. By default, the value is ten lines per page.
Enable / disable checkboxes are available for the following actions:
Show metrics for every bucket / level. Mark this position to display intermediate results for each segment aggregation.
Show partial rows. Mark this position to display the string even if there is no result.
Note. Enabling these options can seriously affect performance.
Markdown Widget
The Markdown widget is a text entry field that accepts GitHub-marked Markdown text. Kibana executes the text you enter in this field and displays the results in the information panel. You can click the Help link to go to the GitHub help page on the nick Markdown. Click Apply to display the executable text in the preview pane or Discard to return the previous version.
Metric
Metric visualization displays one number for each selected aggregation.
Metric aggregations:
Count. Counting aggregation returns the net count of the elements in the selected index pattern.
Average. This aggregation returns the average of a number field. Select a field from the drop-down list.
Sum. Returns the total amount of a numeric field. Select a field from the drop-down list.
Min. Returns the minimum value in a numeric field. Select a field from the drop-down list.
Max. Returns the maximum value in a numeric field. Select a field from the drop-down list.
Unique Count. Cardinal aggregation returns the number of unique values in a field. Select a field from the drop-down list.
Standard Deviation. Aggregation of general statistics returns the standard deviation of data in a numeric field. Select a field from the drop-down list.
Top hit. Aggregation of top values returns one or more top values from a special field in your document. Choose the field from the drop-down list, the type of document sorting, the number of values to be returned.
Percentiles. Percent Aggregation divides numeric field values into specified ranges. Select a field from the drop-down list, then define one or more areas in the Percentiles fields. Click the X to remove the percent field. Click + Add to add a percentage field.
Percentile Rank. Percentage rank aggregation returns percent ranking by selected numeric field. Select a field from the drop-down list, then define one or more percentage rank values in the Values fields. Click the X to remove the value field. Click + Add to add a value field.
Aggregations of parent data sources:
For each aggregation of the parent information source, it is necessary to determine the metric for which the aggregation is calculated. This may be one of the existing metrics or a new one. You can also invest these aggregations (for example, to obtain a third derivative).
Derivative. Derivative aggregation counts the derivative of certain metrics.
Cumulative Sum. The aggregation of the cumulative sum counts the cumulative sum of certain metrics in the parent histogram.
Moving average. Moving average aggregation will insert a window through the data and write the average value of this window.
Serial Diff. Sequential differentiation is a method where values in a time series are subtracted from themselves in another time period or delay.
Related Source Aggregations:
As in the case of aggregation of parent sources, you need to specify the metric for which the aggregation of the related source will be calculated. In addition, you need to provide for the aggregation of segments, which will determine on which segments the aggregation will run.
Average Bucket. The segment average calculates the average value of certain metrics in the aggregation of related sources.
Sum Bucket. Calculates the sum of the values of a specific metric in the aggregation of a related source.
Min Bucket. Returns the minimum value of a specific metric in a relative source aggregation.
Max Bucket. Returns the maximum value of a specific metric in a related source aggregation.
You can create an aggregation by clicking on the + Add Metrics button.
Enter a string in the Custom Label field to change the label.
You can click on the Advanced link to display more options:
JSON Input. A text field where you can add specific properties in JSON format to merge with a specific aggregation, as in the following example:
{ "script" : "doc['grade'].value * 1.2" }
Note. In Elasticsearch 1.4.3 and later, this functionality needs Groovy dynamic scripting enabled.
The availability of these parameters depends on the aggregation you choose.
Click the Options tab to display the font size slider.
')
Source: https://habr.com/ru/post/441264/
All Articles