Fully functional dynamic tracing in Linux using eBPF and bpftrace

“In the trace mode, the programmer sees the sequence of command execution and variable values at this step of the program, which makes it easier to detect errors,” Wikipedia tells us. As Linux fans themselves, we regularly face the question of which tools are best to implement. And we want to share the translation of the article by programmer Hongli Lai, who recommends bpftrace. Looking ahead, I will say that the article ends concisely: "bpftrace is the future." So why was he so impressed with Lai's colleague? Detailed answer under the cut.
Linux has two main trace tools:
strace allows you to see which system calls are being made;
ltrace allows you to see which dynamic libraries are called.
Despite their usefulness, these tools are limited. And if you need to figure out what's going on inside a system or library call? And if you need to not only make a list of calls, but also, for example, collect statistics on certain behavior? And if you need to trace multiple processes and compare data from multiple sources?
')
In 2019, we finally got a decent answer to these questions on Linux: bpftrace , based on eBPF technology. Bpftrace allows you to write small programs that run every time an event occurs.
In this article I will describe how to install bpftrace and teach it basic usage. And also I will review what the trace ecosystem looks like (for example, “what is eBPF?”) And how it evolved into what we have today.
What is tracing?
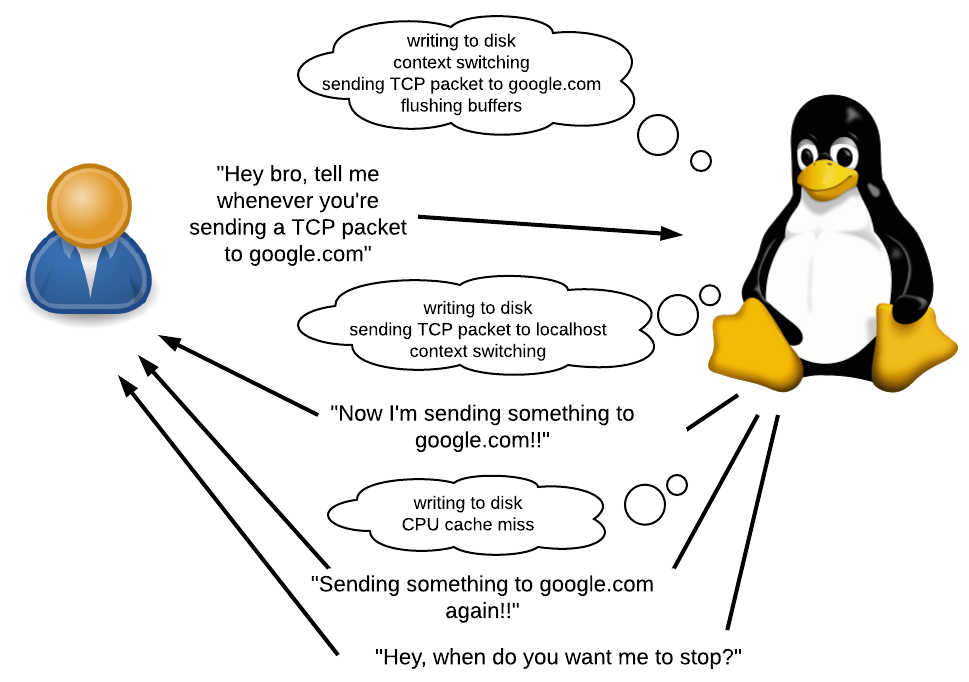
As mentioned earlier, bpftrace allows you to write small programs that run every time an event occurs.
What is an event? This may be a system call, a function call, or even something that occurs within such requests. It can also be a timer or a hardware event, for example, “50 ms has passed since the last such event”, “page failure occurred”, “context switch occurred” or “processor cashe-miss occurred”.
What can be done in response to an event? You can pledge something, collect statistics and execute arbitrary shell commands. You will have access to various contextual information, such as the current PID, stack trace, time, call arguments, return values, etc.
When to use? In many. You can figure out why the application is running slowly by collecting a list of the slowest calls. You can determine if the application has memory leaks and, if so, where it came from. I use it to figure out why Ruby uses so much memory.
The big plus bpftrace is that you do not need to recompile the application. There is no need to prescribe calls to print or any other debugging code in the source code of the application under investigation. There is even no need to restart applications. And all this with very low overheads. This makes bpftrace especially useful for debugging systems right on the prod or in another situation where there are difficulties with recompiling.
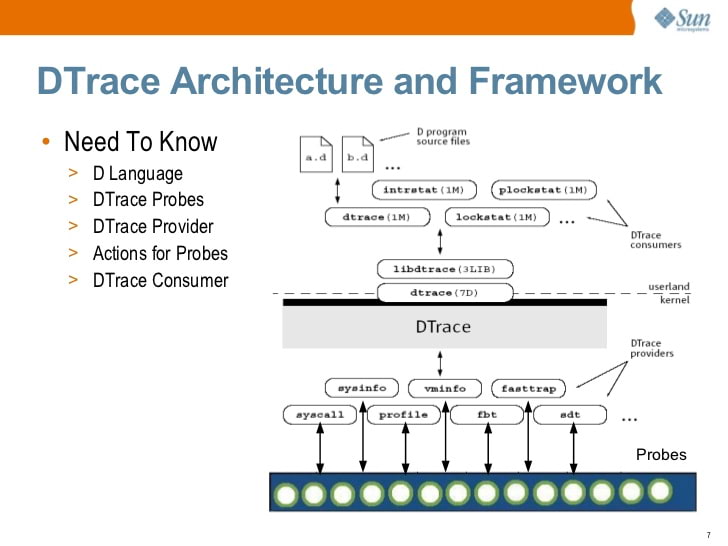
DTrace: Trace Father
For a long time, the best tracing tool was DTrace , a full-fledged dynamic tracing framework originally developed by Sun Microsystems (the creators of Java). Like bpftrace, DTrace allows you to write small programs that run in response to events. In fact, many of the key elements of the ecosystem are largely developed by Brendan Gregg , a famous DTrace expert who now works at Netflix. That explains the similarities between DTrace and bpftrace.
Solaris DTrace introduction (2009) by S. Tripathi, Sun Microsystems
At some point, Sun discovered the DTrace source. Today DTrace is available on Solaris, FreeBSD, and macOS (although the version for macOS is generally inoperable, since the Protection of System Integrity, SIP, broke many of the principles on which DTrace works).
Yes, you correctly noted ... Linux is missing from this list. This is not an engineering problem, it is a licensing problem. DTrace was licensed under the CDDL instead of the GPL. The DTrace port on Linux has been available since 2011, but it has never been supported by major Linux developers. In early 2018, Oracle re-discovered DTrace under the GPL , but by that time it was too late.
Linux Tracing Ecosystem
Without a doubt, the traceability feature is very useful, and the Linux community sought to develop their own solutions for this topic. But, unlike Solaris, Linux is not regulated by one particular vendor, and therefore there was no deliberate effort to develop a fully functional replacement for DTrace. The Linux trace ecosystem has evolved slowly and naturally, solving problems as they arise. And only recently has this ecosystem grown enough to compete seriously with DTrace.
Because of its natural growth, this ecosystem may seem a bit chaotic, consisting of many different components. Fortunately, Julia Evans wrote a review of this ecosystem (note, the publication date is 2017, before bpftrace appeared).
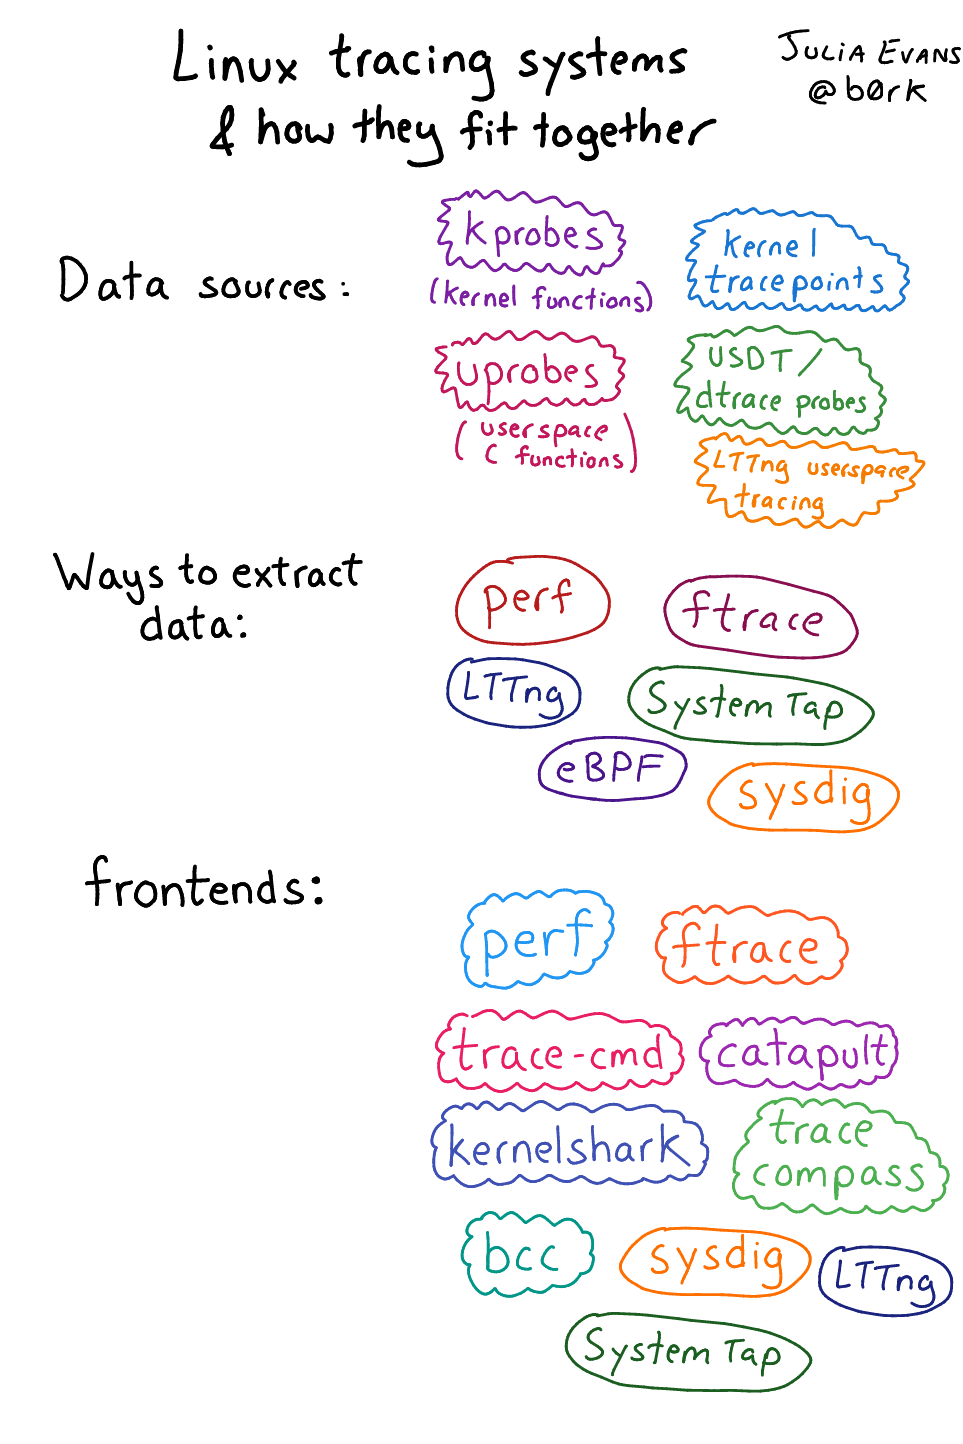
Linux tracing ecosystem described by Julia Evans
Not all elements are equally important. Let me briefly summarize which elements I consider most important.
Sources of events
Event data can come from both the kernel and user space (applications and libraries). Some of them are available automatically, without additional efforts of developers, the rest require manual announcements.
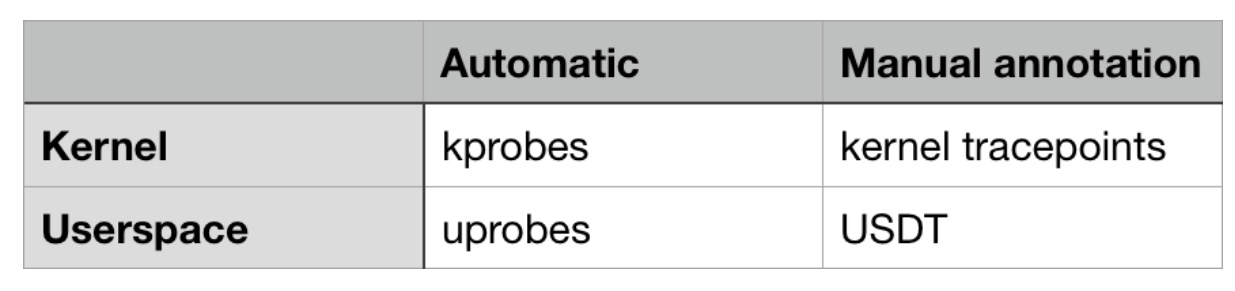
An overview of the most important sources of traced events in Linux.
From the side of the kernel, there is kprobes ( from kernel probes, kernel sensor, approx. Lane ) - a mechanism that allows you to trace any function call inside the kernel. With it, you can trace not only the system calls themselves, but also what happens inside them (because the entry points of the system calls cause other internal functions). You can also use kprobes to trace kernel events that are not system calls, for example, “buffered data is written to disk”, “TCP packet is sent over the network” or “context switching is currently taking place”.
Kernel tracepoints allow you to trace non-standard events defined by kernel developers. These events are not at the level of function calls. To create such points, kernel developers manually place the TRACE_EVENT macro in the kernel code.
Both sources have pros and cons. Kprobes works "automatically", because does not require manual code markup from kernel developers. But kprobe events can arbitrarily change from one version of the kernel to another, because functions are constantly changing — they are added, deleted, renamed.
Kernel trace points are generally more stable over time and can provide useful contextual information that may not be available when using kprobes. Using kprobes, you can access the arguments of function calls. But with the help of trace points, you can get any information that the kernel developer decides to manually describe.
In user space, there is an analogue of kprobes - uprobes. It is intended for tracing function calls in user space.
USDT sensors (“Statically Defined Traces of User Space”) are analogous to kernel trace points in user space. Application developers need to manually add USDT sensors to their code.
Interesting fact: DTrace for a long time provided the C API to determine its own analogue of USDT sensors (using the DTRACE_PROBE macro). The Linux trace ecosystem developers decided to keep the source code compatible with this API, so any DTRACE_PROBE macros will automatically be converted to USDT sensors!
Therefore, in theory, strace can be implemented using kprobes, and ltrace using uprobes. I'm not sure if this is practiced already or not.
Interfaces
Interfaces are applications that allow users to easily use event sources.
Let's take a look at how event sources work. The workflow is as follows:
- The kernel represents a mechanism — usually the file / proc or / sys, open for writing — that registers both the intention to trace the event and what should follow the event.
- By registering, the kernel localizes the kernel / function in user space / trace points / USDT sensors in memory and changes their code so that something else happens.
- The result of this “something else” can be collected later with the help of some mechanism.
I would not like to do all this manually! Therefore, interfaces come to the rescue: they do all this for you.
There are interfaces for every taste and color. In the area of eBPF - based interfaces, there are low-level ones that require a deep understanding of how to interact with event sources and how eBPF byte code works. And there are high-level and easy to operate, although during their existence they have not demonstrated great flexibility.
This is why bpftrace - the newest interface - is my favorite. It is easy to use and flexible, like DTrace. But it is quite new and requires grinding.
eBPF
eBPF is a new Linux tracing star , on which bpftrace is based. When you trace an event, you want something to happen in the kernel. How flexible is it to determine that there is this “something”? Of course, using a programming language (or using machine code).
eBPF (enhanced version of Berkeley Packet Filter). This is a high-performance virtual machine that runs in the kernel and has the following properties / limitations:
- All interactions with user space occur through eBPF “maps”, which are key-value data storage.
- There are no cycles for each eBPF program to complete at a specific time.
- Wait, did we say “packet filter”? You are right: they were originally designed for filtering network packets. This is a similar task: when forwarding packets (the occurrence of an event), you need to perform some administrative action (accept, drop, log, or redirect the packet, etc.) To perform such actions quickly, a virtual machine was invented (with JIT compilations). The “enhanced” version is considered due to the fact that, compared to the original version of Berkeley Packet Filter, eBPF can be used outside the network context.
Like this. With bpftrace, you can determine which events to monitor and what should happen in response. Bpftrace compiles your high-level bpftrace-written program into eBPF bytecode, tracks events, and loads the bytecode into the kernel.
Dark days before eBPF
Before the advent of eBPF, the solutions were, to put it mildly, awkward. SystemTap is something like the “most serious” predecessor of bpftrace in the Linux family. SystemTap scripts are translated to the C language and loaded into the kernel as modules. The resulting kernel module is then loaded.
This approach was very fragile and poorly supported outside of Red Hat Enterprise Linux. He never worked well for me on Ubuntu, which tended to break SystemTap on every kernel update due to a change in the kernel data structure. They also say that in the first days of its existence SystemTap easily led to the kernel panic .
Install bpftrace
It's time to roll up your sleeves! In this guide, we will look at installing bpftrace on Ubuntu 18.04. Newer versions of the distribution are undesirable because during installation, we will need packages that have not yet been compiled for them.
Installing dependencies
First, install Clang 5.0, lbclang 5.0 and LLVM 5.0, including all header files. We will use the packages provided by llvm.org, because those in the Ubuntu repositories are problematic .
wget -O - https://apt.llvm.org/llvm-snapshot.gpg.key | sudo apt-key add - cat <<EOF | sudo tee -a /etc/apt/sources.list deb http://apt.llvm.org/xenial/ llvm-toolchain-xenial main deb-src http://apt.llvm.org/xenial/ llvm-toolchain-xenial main deb http://apt.llvm.org/xenial/ llvm-toolchain-xenial-5.0 main deb-src http://apt.llvm.org/xenial/ llvm-toolchain-xenial-5.0 main EOF sudo apt update sudo apt install clang-5.0 libclang-5.0-dev llvm-5.0 llvm-5.0-dev Further:
sudo apt install bison cmake flex g++ git libelf-dev zlib1g-dev libfl-dev And finally, install libbfcc-dev from upstream, and not from the Ubuntu repository. In the package that is in Ubuntu, there are no header files . And this problem was not solved even at 18.10.
sudo apt-key adv --keyserver keyserver.ubuntu.com --recv-keys 4052245BD4284CDD echo "deb https://repo.iovisor.org/apt/$(lsb_release -cs) $(lsb_release -cs) main" | sudo tee /etc/apt/sources.list.d/iovisor.list sudo apt update sudo apt install bcc-tools libbcc-examples linux-headers-$(uname -r) Basic bpftrace installation
It's time to install bpftrace itself from source! Let's clone it, build it, and install it in / usr / local:
git clone https://github.com/iovisor/bpftrace cd bpftrace mkdir build && cd build cmake -DCMAKE_BUILD_TYPE=DEBUG .. make -j4 sudo make install And you're done! The executable will be installed in / usr / local / bin / bpftrace. You can change the target location using the argument for cmake, which by default looks like this:
DCMAKE_INSTALL_PREFIX=/usr/local. Single line examples
Let's run a few bpftrace one-liners to understand our capabilities. These I took from the leadership of Brendan Gregg , in which there is a detailed description of each of them.
# 1. Display the list of sensors
bpftrace -l 'tracepoint:syscalls:sys_enter_*' # 2. Welcome word
bpftrace -e 'BEGIN { printf("hello world\n"); }' # 3. Opening a file
bpftrace -e 'tracepoint:syscalls:sys_enter_open { printf("%s %s\n", comm, str(args->filename)); }' 4. Number of system calls per process
bpftrace -e 'tracepoint:raw_syscalls:sys_enter { @[comm] = count(); }' # 5. Distribution of read () calls by the number of bytes.
bpftrace -e 'tracepoint:syscalls:sys_exit_read /pid == 18644/ { @bytes = hist(args->retval); }' # 6. Dynamic tracing of read () content
bpftrace -e 'kretprobe:vfs_read { @bytes = lhist(retval, 0, 2000, 200); }' # 7. Time spent reading () calls
bpftrace -e 'kprobe:vfs_read { @start[tid] = nsecs; } kretprobe:vfs_read /@start[tid]/ { @ns[comm] = hist(nsecs - @start[tid]); delete(@start[tid]); }' 8. Process level event counting
bpftrace -e 'tracepoint:sched:sched* { @[name] = count(); } interval:s:5 { exit(); }' # 9. Profiling of core workstations.
bpftrace -e 'profile:hz:99 { @[stack] = count(); }' # 10. Tracer scheduler
bpftrace -e 'tracepoint:sched:sched_switch { @[stack] = count(); }' 11. Tracing blocking I / O
bpftrace -e 'tracepoint:block:block_rq_complete { @ = hist(args->nr_sector * 512); }' Take a look at the Brendan Gregg website to find out what output the commands listed above can generate .
Script syntax and I / O timing example
The string passed through the '-e' key is the contents of the bpftrace script. The syntax in this case is, conditionally, a set of structures:
<event source> /<optional filter>/ { <program body> } Let's look at the seventh example, about the file system read timings:
kprobe:vfs_read { @start[tid] = nsecs; } <- 1 -><-- 2 -> <---------- 3 ---------> We trace the event from the kprobe mechanism, i.e., we trace the beginning of the kernel function.
The kernel tracing function is vfs_read , this function is called when the kernel performs a read operation from the file system (VFS from “Virtual FileSystem”, file system abstraction inside the kernel).
When vfs_read begins to run (i.e. before the function has completed any useful work), the bpftrace program is started. It saves the current timestamp (in nanoseconds) to a global associative array called st art . The key is tid , a link to the current thread identifier (thread id).
kretprobe:vfs_read /@start[tid]/ { @ns[comm] = hist(nsecs - @start[tid]); delete(@start[tid]); } <-- 1 --> <-- 2 -> <---- 3 ----> <----------------------------- 4 -----------------------------> 1. We trace the event from the kretprobe mechanism, which is similar to kprobe , except that it is called when the function returns the result of its execution.
2. Kernel tracing function - vfs_read .
3. This is an optional filter. It checks if the start time has been previously recorded. Without this filter, the program can be run while reading and catch only the end, resulting in getting the estimated time nsecs - 0 , instead of nsecs - start .
4. The body of the program.
nsecs - st rt [tid] calculates how much time has passed since the start of the vfs_read function.
@ns [comm] = hist (...) adds the specified data to a two-dimensional histogram stored in @ns . The comm key refers to the name of the current application. So we will have a pokandnaya histogram.
delete (...) removes the start time from the associative array, because we no longer need it.
This is the final conclusion. Please note that all histograms are displayed automatically. Explicit use of the "print histogram" command is not required. @ns is not a special variable, so the histogram is not displayed because of it.
@ns[snmp-pass]: [0, 1] 0 | | [2, 4) 0 | | [4, 8) 0 | | [8, 16) 0 | | [16, 32) 0 | | [32, 64) 0 | | [64, 128) 0 | | [128, 256) 0 | | [256, 512) 27 |@@@@@@@@@ | [512, 1k) 125 |@@@@@@@@@@@@@@@@@@@@@@@@@@@@@@@@@@@@@@@@@@@@@ | [1k, 2k) 22 |@@@@@@@ | [2k, 4k) 1 | | [4k, 8k) 10 |@@@ | [8k, 16k) 1 | | [16k, 32k) 3 |@ | [32k, 64k) 144 |@@@@@@@@@@@@@@@@@@@@@@@@@@@@@@@@@@@@@@@@@@@@@@@@@@@@| [64k, 128k) 7 |@@ | [128k, 256k) 28 |@@@@@@@@@@ | [256k, 512k) 2 | | [512k, 1M) 3 |@ | [1M, 2M) 1 | | USDT sensor example
Let's take this C code and save it in the tracetest.c file:
#include <sys/sdt.h> #include <sys/time.h> #include <unistd.h> #include <stdio.h> static long myclock() { struct timeval tv; gettimeofday(&tv, NULL); DTRACE_PROBE1(tracetest, testprobe, tv.tv_sec); return tv.tv_sec; } int main(int argc, char **argv) { while (1) { myclock(); sleep(1); } return 0; } This program runs infinitely, calling myclock () once a second. myclock () requests the current time and returns the number of seconds since the beginning of the epoch.
The DTRACE_PROBE1 call here defines the static point of the USDT trace.
- The DTRACE_PROBE1 macro is taken from sys / sdt.h. The official USDT macro, which does the same thing, is called STAP_PROBE1 (STAP from SystemTap, which was the first Linux mechanism supported in USDT). But since USDT is compatible with DTrace user-space sensors, DTRACE_PROBE1 is simply a reference to STAP_PROBE1 .
- The first parameter is the name of the provider. I guess this is a rudiment from DTrace, because it doesn't seem like bpftrace does anything useful with it. However, there is a nuance ( which I found when debugging the problem on request 328 ): the provider name must be identical to the name of the application's binary file, otherwise bpftrace will not be able to find the trace point.
- The second parameter is the proper name of the trace point.
- Any additional parameters are the context provided by the developers. The number 1 in DTRACE_PROBE1 means that we want to pass one additional parameter.
Let's make sure that sys / sdt.h is available to us and build the program:
sudo apt install systemtap-sdt-dev gcc tracetest.c -o tracetest -Wall -g We instruct bpftrace to display the PID and “time is [number]” whenever the testprobe is reached:
sudo bpftrace -e 'usdt:/full-path-to/tracetest:testprobe { printf("%d: time is %d\n", pid, arg0); }' Bpftrace continues to work until we press Ctrl-C. Therefore, we will open a new terminal and run tracetest there:
# In the new terminal
./tracetest
Go back to the first terminal with bpftrace, there you should see something like:
Attaching 1 probe... 30909: time is 1549023215 30909: time is 1549023216 30909: time is 1549023217 ... ^C An example of allocating a memory area with glibc ptmalloc
I use bpftrace to figure out why Ruby uses so much memory. And in part of my research, I need an understanding of how the glibc memory allocator uses memory areas .
In order to optimize multi-core performance, the glibc memory allocator allocates several “areas” from the OS. When an application requests a memory allocation, the allocator selects an area that is not used, and marks part of that area as “in use”. Since threads use different regions, the number of locks decreases, resulting in improved multi-thread performance.
But this approach generates a lot of garbage, and it seems that such a high memory consumption in Ruby is precisely because of it. In order to better understand the nature of this garbage, I asked myself: what does it mean to “choose an area that is not used”? This may mean one of:
- With each call to malloc (), the allocator iterates through all areas and finds the one that is not currently locked. And only if they are all blocked, will he try to create a new one.
- The first time malloc () is called for a specific thread (or at the start of a thread), the allocator will choose the one that is not currently blocked. And if they are all blocked, he will try to create a new one.
- When you first call malloc () on a specific thread (or when starting a thread), the allocator will try to create a new area, regardless of whether there are unlocked areas. Only if a new area cannot be created (for example, when the limit is exhausted) will it reuse the existing one.
- There are probably more options that I did not consider.
The documentation does not have a specific answer, which of these possibilities allows you to select an area that is not used. I studied the glibc source code, which suggested that option 3 could do this. But I wanted to experimentally check whether I interpreted the source code correctly, without having to enter the debugging code in glibc.
Here is the glibc memory allocator function, which creates a new region. But you can call it only after checking the limit.
static mstate _int_new_arena(size_t size) { mstate arena; size = calculate_how_much_memory_to_ask_from_os(size); arena = do_some_stuff_to_allocate_memory_from_os(); LIBC_PROBE(memory_arena_new, 2, arena, size); do_more_stuff(); return arena; } Is it possible to use uprobes to trace the _int_new_arena function? Unfortunately not. For some reason, this symbol is not available in glibc Ubuntu 18.04. Even after installing debug symbols.
Fortunately, there is a USDT sensor in this function. LIBC_PROBE is a macro alias for STAP_PROBE .
The name of the provider is libc.
The sensor name is memory_arena_new.
The number 2 means that there are 2 additional arguments given by the developer.
arena is the address of the area that was allocated from the OS, and size is its size.
Before we can use this sensor, we need to work around problem 328 . glibc - libc , bpftrace , ( libc-2.27.so ) (libc) .
ln -s /lib/x86_64-linux-gnu/libc-2.27.so /tmp/libc bpftrace USDT memory_arena_new , libc :
sudo bpftrace -e 'usdt:/tmp/libc:memory_arena_new { printf("PID %d: created new arena at %p, size %d\n", pid, arg0, arg1); }' Ruby, . - Ruby malloc() .
ruby -e '3.times { Thread.new { } }; sleep 1' bpftrace, :
Attaching 1 probe... PID 431: created new arena at 0x7f40e8000020, size 576 PID 431: created new arena at 0x7f40e0000020, size 576 PID 431: created new arena at 0x7f40e4000020, size 576 ! Ruby glibc .
? ?
, , kprobe , :
sudo bpftrace -l uprobe ( ) , :
nm /path-to-binary USDT , :
/usr/share/bcc/tools/tplist -l /path-to/binary , : , . .
:
. , , /sys/kernel/debug/tracing/events!
, , madvise(..., MADV_DONTNEED) :
sudo bpftrace -l | grep madvise — , tracepoint:syscalls:sys_enter_madvise.
sudo cat /sys/kernel/debug/tracing/events/syscalls/sys_enter_madvise/format — :
name: sys_enter_madvise ID: 569 format: field:unsigned short common_type; offset:0; size:2; signed:0; field:unsigned char common_flags; offset:2; size:1; signed:0; field:unsigned char common_preempt_count; offset:3; size:1; signed:0; field:int common_pid; offset:4; size:4; signed:1; field:int __syscall_nr; offset:8; size:4; signed:1; field:unsigned long start; offset:16; size:8; signed:0; field:size_t len_in; offset:24; size:8; signed:0; field:int behavior; offset:32; size:8; signed:0; print fmt: "start: 0x%08lx, len_in: 0x%08lx, behavior: 0x%08lx", ((unsigned long)(REC->start)), ((unsigned long)(REC->len_in)), ((unsigned long)(REC->behavior)) madvise : (void *addr, size_t length, int advice) . !
MADV_DONTNEED? grep MADV_DONTNEED /usr/include, 4:
/usr/include/x86_64-linux-gnu/bits/mman-linux.h:80:# define MADV_DONTNEED 4 /* Don't need these pages. */ bpftrace :
sudo bpftrace -e 'tracepoint:syscalls:sys_enter_madvise /args->behavior == 4/ { printf("madvise DONTNEED called\n"); }' Conclusion
Bpftrace ! Bpftrace — !
, , 2019 .
!
Source: https://habr.com/ru/post/441258/
All Articles