Long-term storage of Prometheus metrics (Alexey Palazhchenko, Percona)
In a short time, Prometheus has become one of the most popular monitoring tools. Thanks, including, and the high speed of their work. Its local storage is great for short-term storage of metrics and working with them. Sometimes you want to store metrics distributed months and years, automatically cutting old data, but without changing the interface for working with them.
Just about this is the decoding of the report by Alexey Palazhchenko at RootConf 2018. In the report: Prometheus, Local Storage TSDB, Remote Storage Prometheus, PromQL, TSDB, lickhouse, PromHouse, a little InfluxDB.
Who cares, I ask under the cat.
Friends! Hello! My name is Alexey Palazhchenko. I work for Percona. I would like to tell you about the long-term storage of metrics in Prometheus.
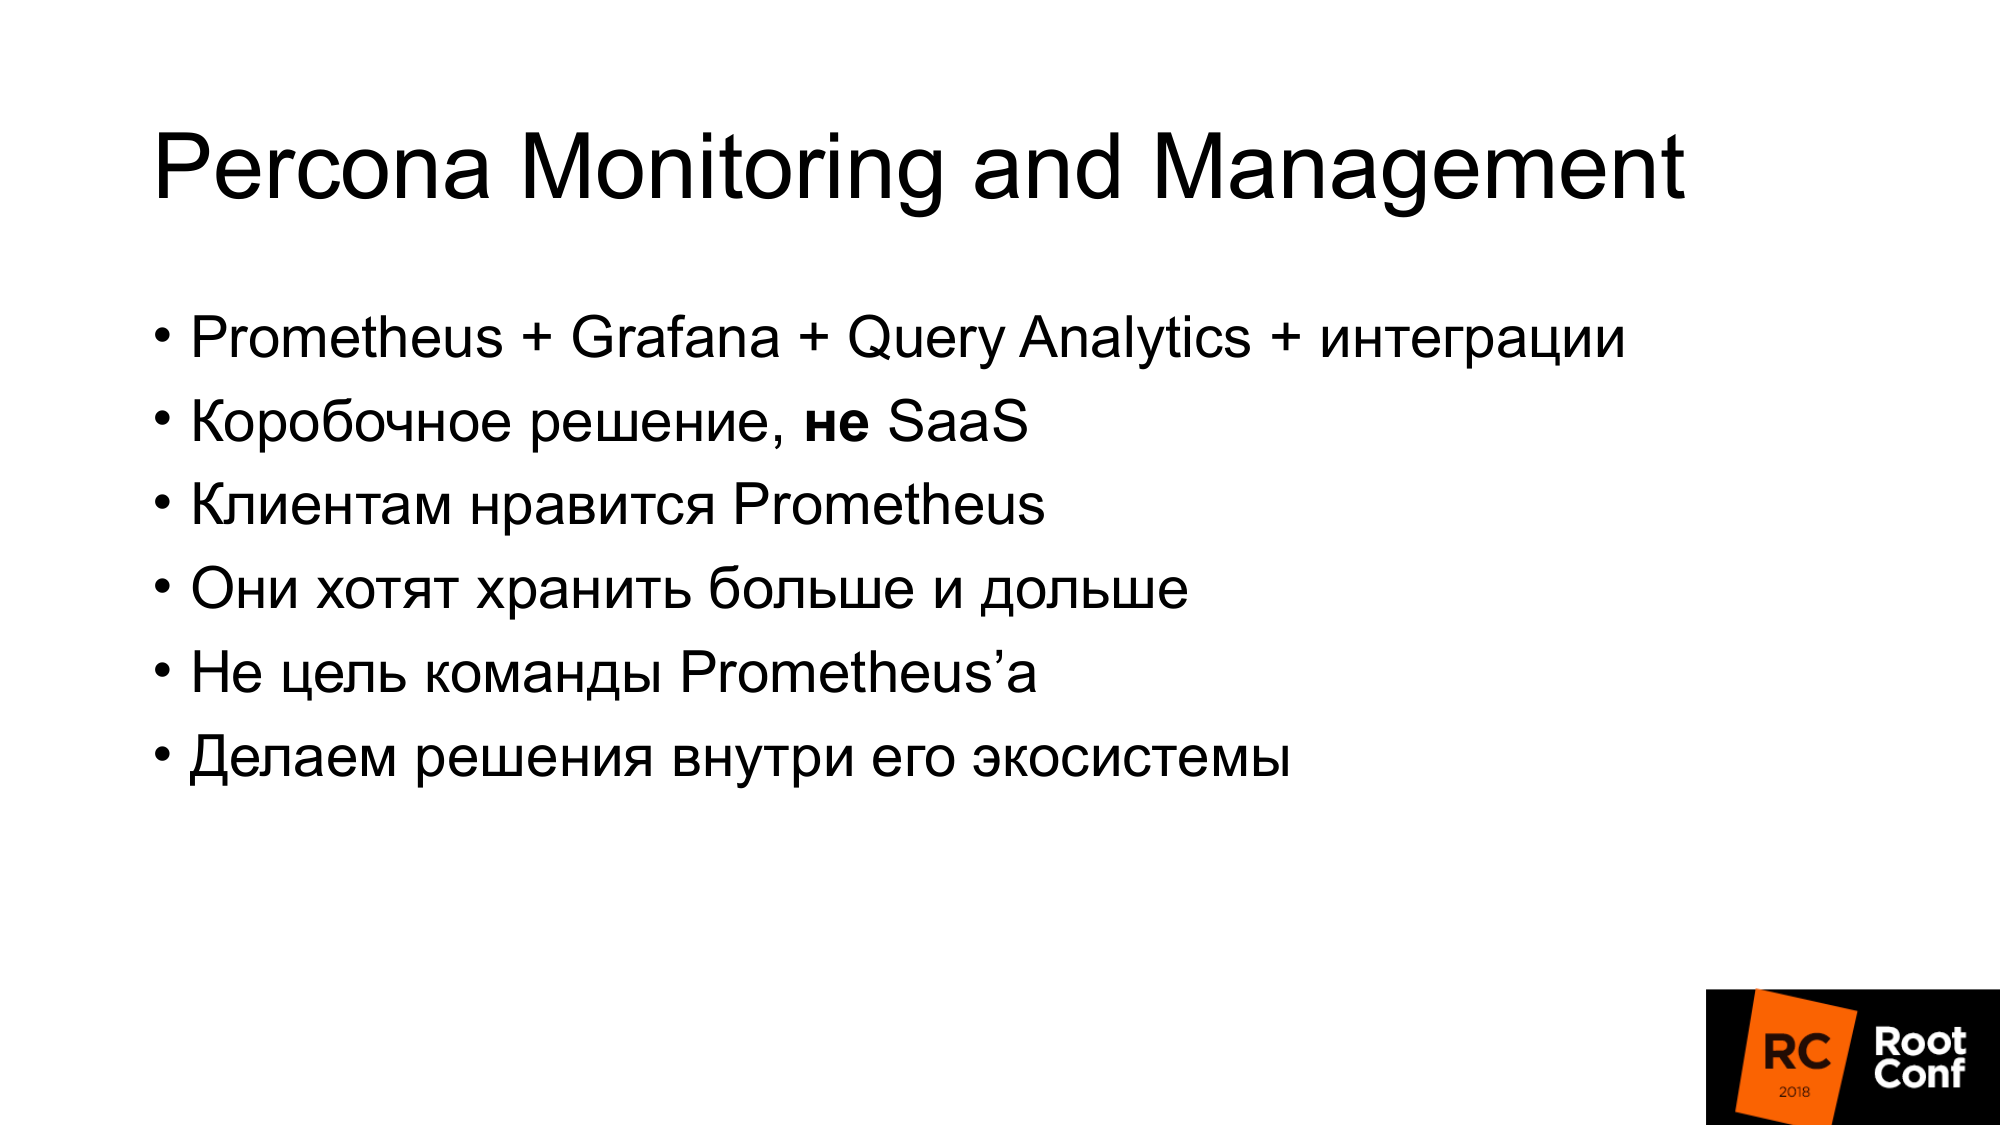
I work for Percona and make a product called percona monitoring and management. This is a boxed solution that our customers set for themselves. PMM is fully open source. It consists of Prometheus, Grafana for drawing graphs, custom query analytics software and our own wrapper, which allows you to do some control. For example, you can add scrape target in Prometheus. These are new sources, from where it will take metrics without having to go into the container or virtual machine and edit the configuration file.
It is important to understand that this is not SaaS. We do not have production. Our production is at our customers. To experiment on it is not very good. We have the nearest thing that could be called production - this is https://pmmdemo.percona.com/ . At the time of the report, pmmdemo.percona.com had to be turned off due to the GDPR.
We put PMM to customers - a boxed solution: a docker-container or a virtual machine. They all like Prometheus. Some people who are looking at the Prometheus for the first time face a pull model. For beginners, this is inconvenient. Generally a separate big conversation. One can argue about pull or push methods. On average, they are about the same.
Some things in Prometheus are very cool.
Prometheus query language is a really cool thing that has no analogue almost anywhere.
The second thing you like is service discovery. If you have some kind of dynamic infrastructure, kubernetes, then you do not need to manually add all target'y for monitoring. If static - this can also be done quite simply. Need to use a configuration file.
Prometheus customers like it. They want to keep metrics longer and longer. Someone uses Prometheus for operational monitoring only. But someone wants to keep the metrics longer, watch the dynamics, compare with the charts a year ago. At the same time, the goal of long-term storage of metrics is not a goal for the Prometheus project. Initially, it was created in order to store metrics for long. SoundCloud stores metrics in just a few days. There are mechanisms in Prometheus that allow you to do this longer, but they are arranged a little to the side. Therefore, we can make a solution for the Prometheus ecosystem without changing the core of the system itself. Based on them, we can make our own decision within the framework of the same ecosystem.

This is not a report about ready-made solutions. This is a report about our experience, about our pain, about our attempts. If you expected that after this report you download the repository or the docker-container, run it and everything will work, then this is not so. But at the same time it is close enough to being so. We have groundwork. They all opensource. You can take a try. They are not ready for production yet. But with the information that is in this report, you will be able to understand why so that you can do better. You can make your decision that will suit you well.
How are metrics stored in Prometheus? There is a local storage. There is a remote storage. These are actually two different worlds. They weakly intersect. Therefore, the report is also divided into 2 parts.
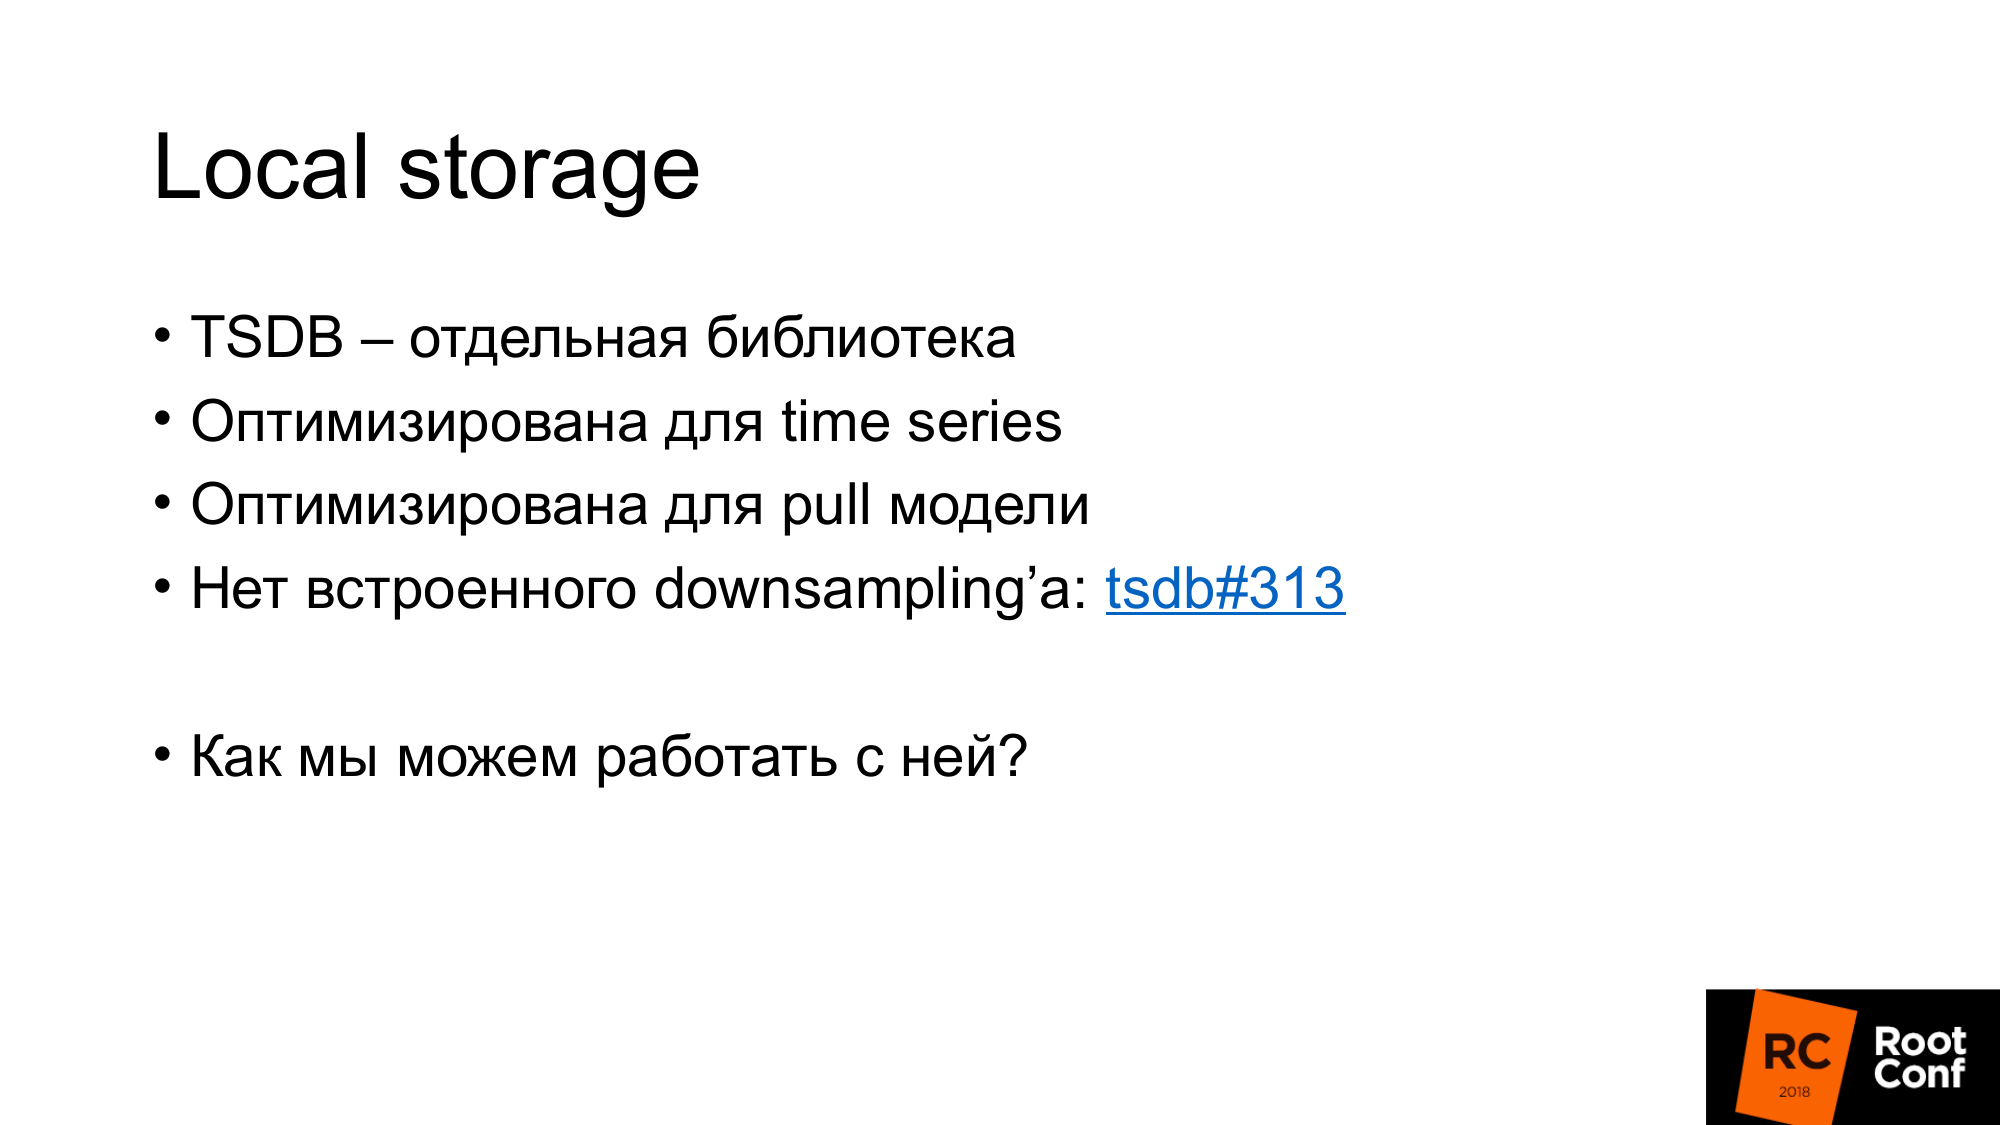
If you were on a previous report in the main room, where there was a good intro in Prometheus, you know that local storage is a separate library called TSDB. TSDB has nothing to do with OpenTSDB. TSDB is a separate Go package that you can use from your Go program. At the TSDB library level, there is no client and server.
This library is optimized to work with time series data. For example, in TSDB there is a delta encoding, which allows you to store not the numbers themselves, but exactly the changes between these numbers. This allows you, instead of storing 16 bytes - to store 1 byte. 1 byte for time and 1 byte for value. That is, you store an average of 1 or 2 bytes due to this good compression.
TSDB is optimized for pull models. Data there is only added. No historical data can be recorded in Prometheus. There is no API for this. The maximum delta is about 5 minutes. If the data is older, they will not be accepted.
There is no built-in downsampling tsdb # 313 in TSDB. There is an open issue in which there was a discussion on the fact that in general there are projects that do something around Prometheus and there are downsampling. So far, the solution is that the TSDB will not add downsampling.
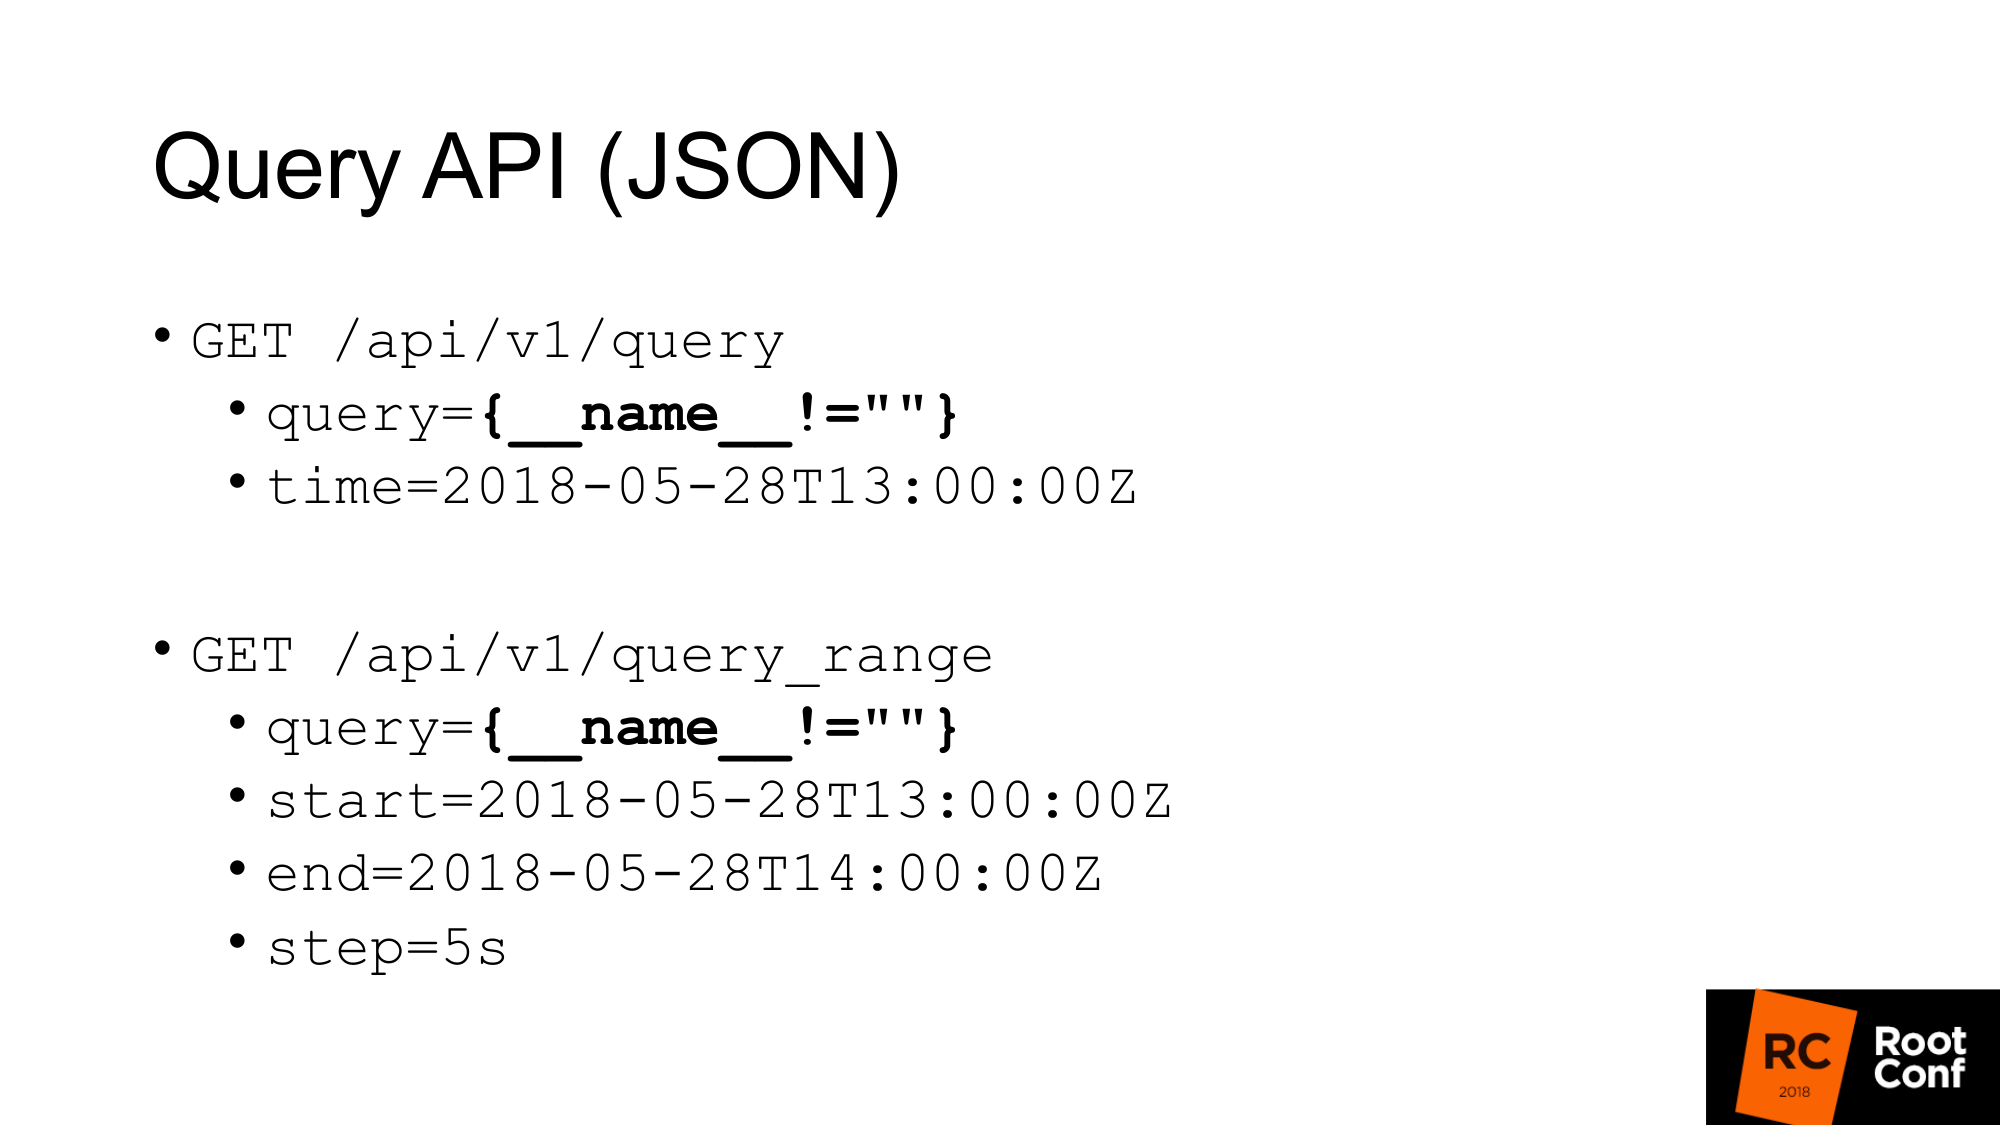
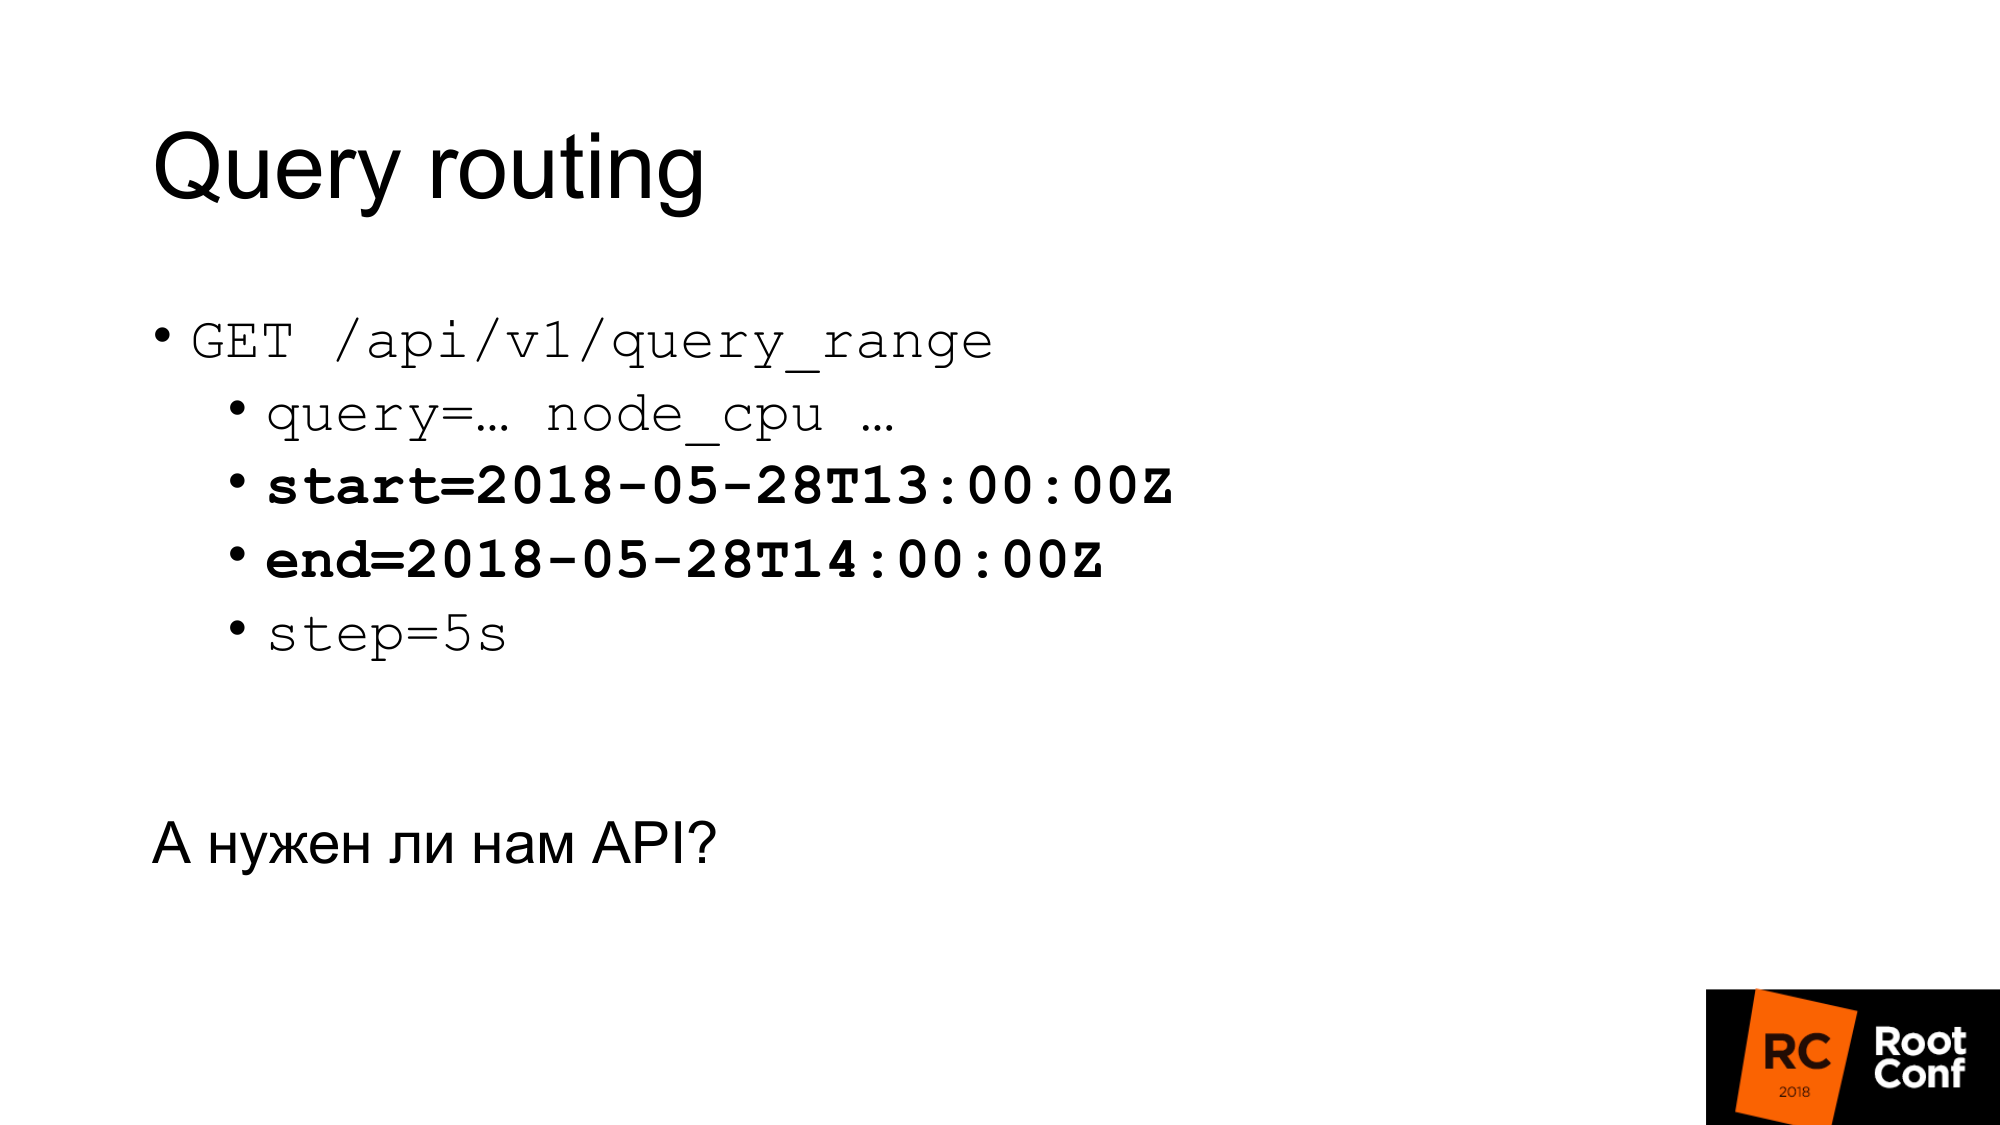
How would we get data from TSDB? TSDB is a database on disk. You can work with it if you write Go program. But if you do not write a program on Go, then there is a JSON API that allows you to make query requests. If you have ever used Prometheus and at least once built a graph, you know the standard Query API, in which there is a query parameter, in which you can execute any PromQL query and optionally time. If there is no time, the current time is taken.
The slide highlights a specific query that you rarely see in real life. This is a hack. This allows us to pull out all the metrics that are in Prometheus. How it works? At the level of PromQL it is said that it is impossible to write such an expression that would patch all time seriers. This is written in the rules. Another rule says that you can not make a matcher, in which all values are empty. If you write just curly braces this will not work. If you write name is not equal to anything (not empty value), it will not work. But this is a real hack that allows you to do this. However, he is not even particularly documented. In the code itself there are comments that it works.
The second query is query_range, which does the same thing, but returns data to you in a range and with some step. It essentially does the query several times for each step, from beginning to end. This is the API that is used to draw graphics. The first API uses to get instant values.
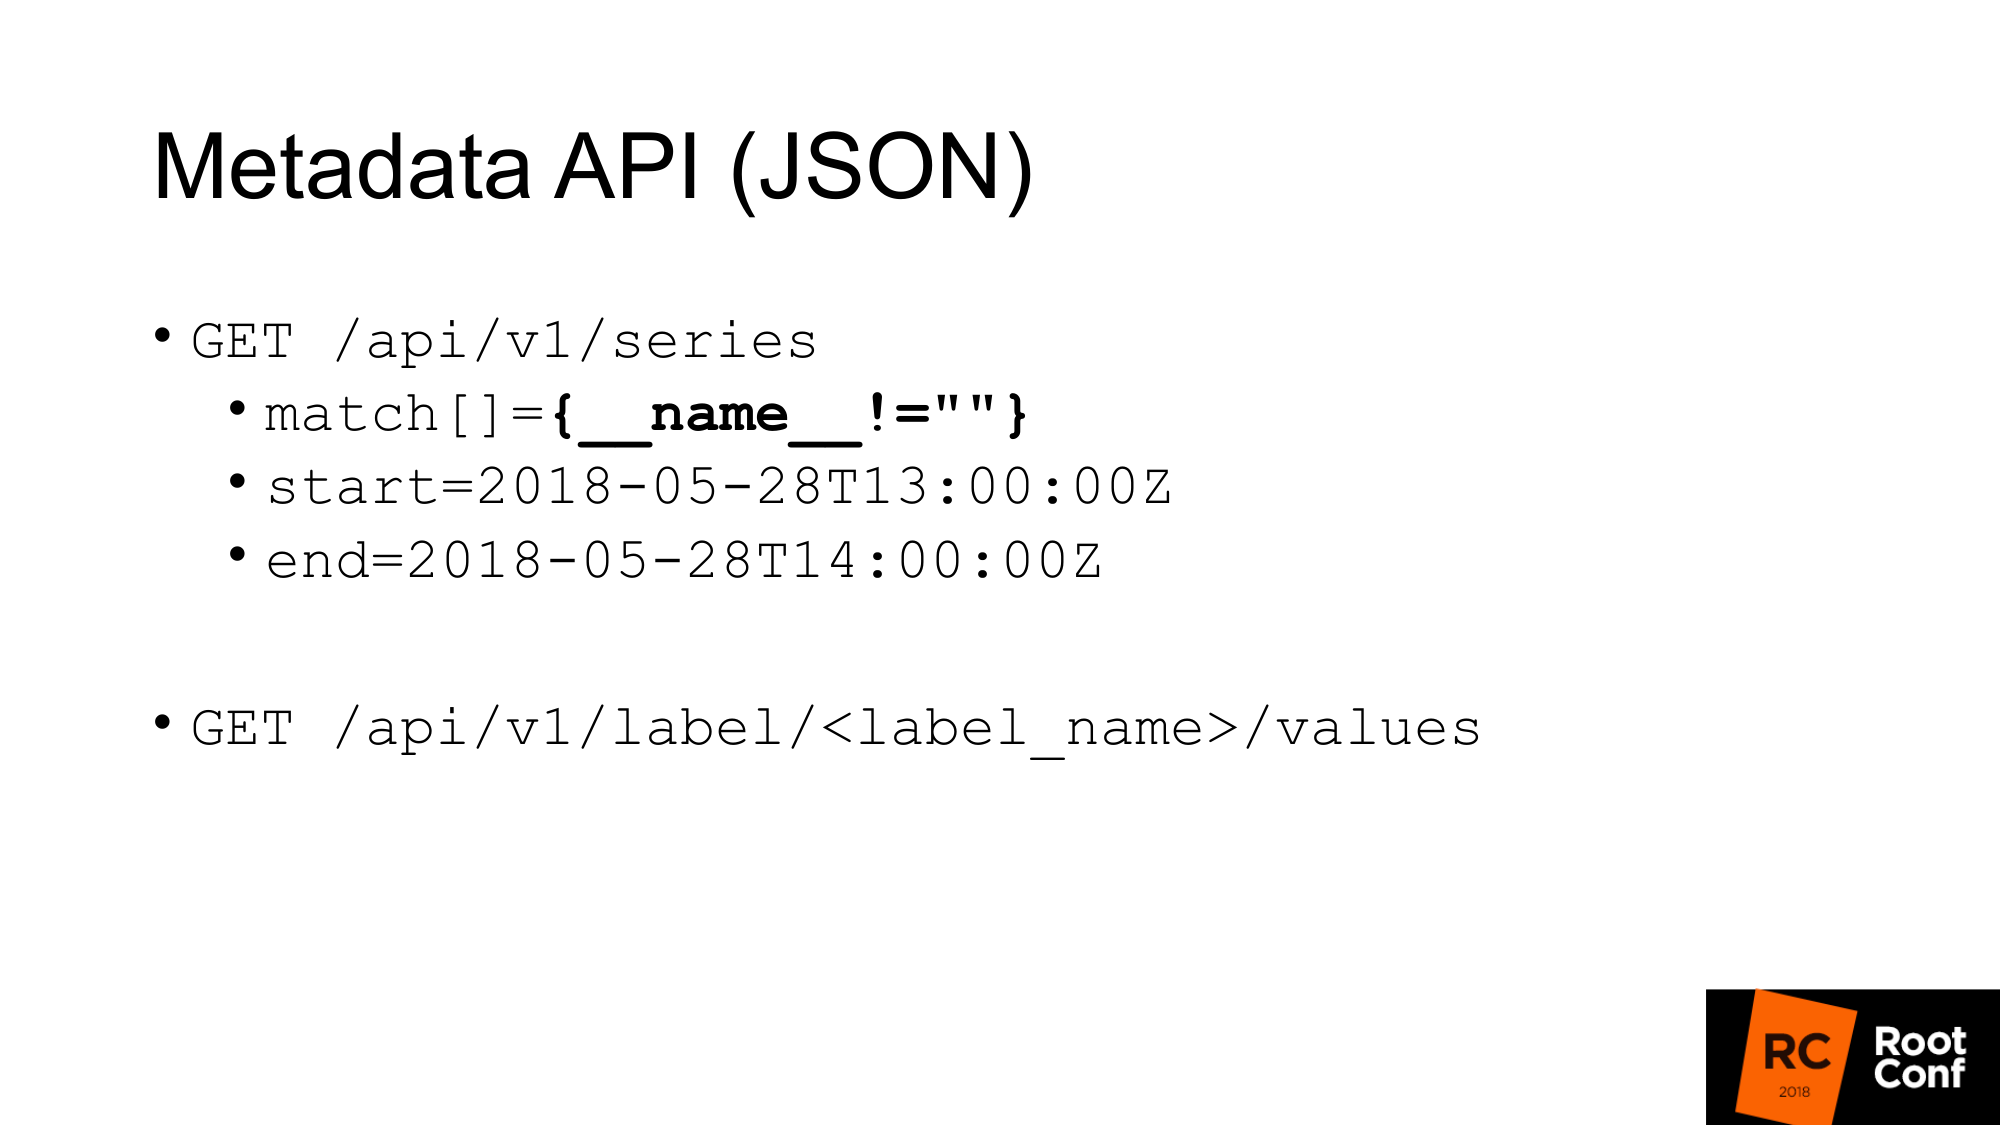
We have an API for getting metadata. If we want to get all the names of the metrics, we make the following query, where match is an array of metrics. There may be several arguments, but in this case we pass the same match, which returns everything to us.
The second meta API, which returns us the value of all labels. If we want to see a list of all jobs, we write job instead of label_name and get this list. These APIs return JSON to us.
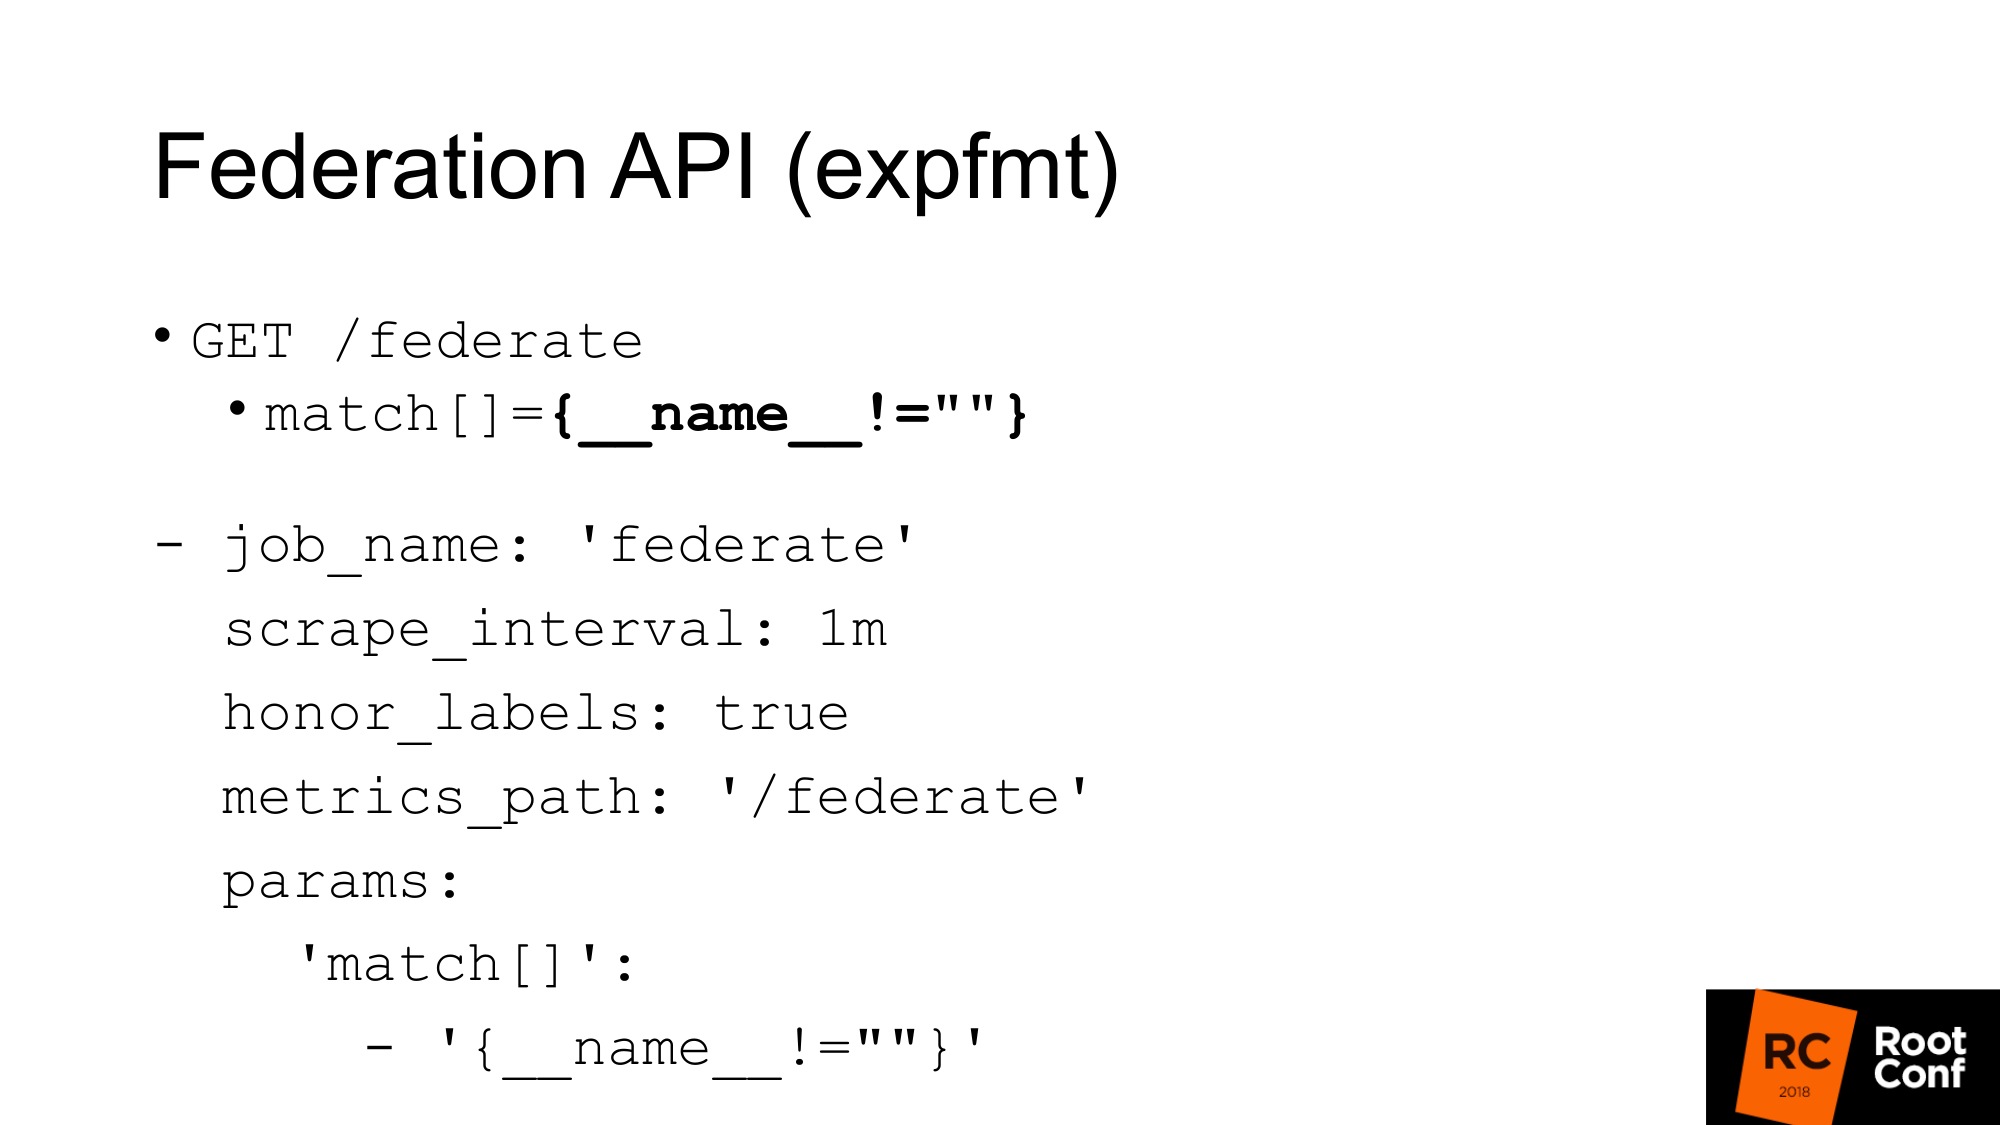
There is another API that returns us all the metrics of Prometheus itself in a format that is native for exporters. The format is called expfmt. Prometheus itself has the Federation API, which allows you to make such a request. What is it for? The easiest option is, if you have some code that already works with expfmt, then you do not need to retrain it in order to work with some custom JSON API. This format is much easier to stream, because if you have JSON somewhere at the top level of an object, most often you need to parse the whole object. Here you can do it by line.
The most important thing is that it is a separate API. It works exactly like the real export. You can get another Prometheus to scrape it. This is a regular job with the usual parameters. You need to pass a parameter - query url. If you make a curl query, you get the same thing here. We get all the metrics for the current time value. The only caveat: you need to install honor_labels so that Prometheus, which will scrap another Prometheus through this API, does not grind the value of the job and the instance label. Using this Federation API, you can load all the data from one Prometheus to another.
How can this be used?
First, the most important thing is to say that it is not necessary to do this. TSDB is optimized for other modes of operation. If you have Prometheus, which scraps a lot of data, then it does a lot of I / O. If you use Federation API, then the amount of input output will increase by about 2 times. There are nuances. Depending on how often you do the scraping on the federate and how often you scrap the target. If time is not changed, then it really doubles the load. Therefore, if you want to zaskeylit your Prometheus and turn on the federation, then you will kill him. The load will increase twice.
Second moment. You will be missing data. You will receive a data conflict. Why is that? This API, like almost any API in Prometheus, is not atomic. If new data arrives, the new scraper ends when your federate request is still in progress, you can receive some data for one time series, and new data for another. If it is not related time series, then it is generally not scary. But if you have a summary or a histogram that at the expfmt level is represented by several basic metrics, then there will be an inconsistency between them.

How can we solve this atomic problem? Prometheus has recording rules that allow you to create a new time series from an existing time series. This can be done less frequently. This is one way to do downsampling. For example, scrap target every second, but then we want to do node_cpu aggregation in one minute. Grouping in Prometheus 2.0 allows you to do these aggregations sequentially. Rules that are in the same group are executed strictly sequentially. At this moment there is no problem of atomicity, there is no problem that the data will change in the process. But this does not solve the problem that some other data is valid, which are connected logically with this, but are not related from the point of view of the data model. Pure atomicity yet. There is an open issue on this topic. You can do snapshots. You can make a PromQL query to the TSDB database and from the resulting values, drop all samples that are less than some time value that started in the evaluation. It would be the easiest way, but so far it has not been done.
It is important to understand that the recording rules need to be done on the lower Prometheus, and not on the one that the federation does. Otherwise, you will miss peaks, your monitoring will not work correctly.
How can we use this combination of these things in order to do downsampling and long-term storage.
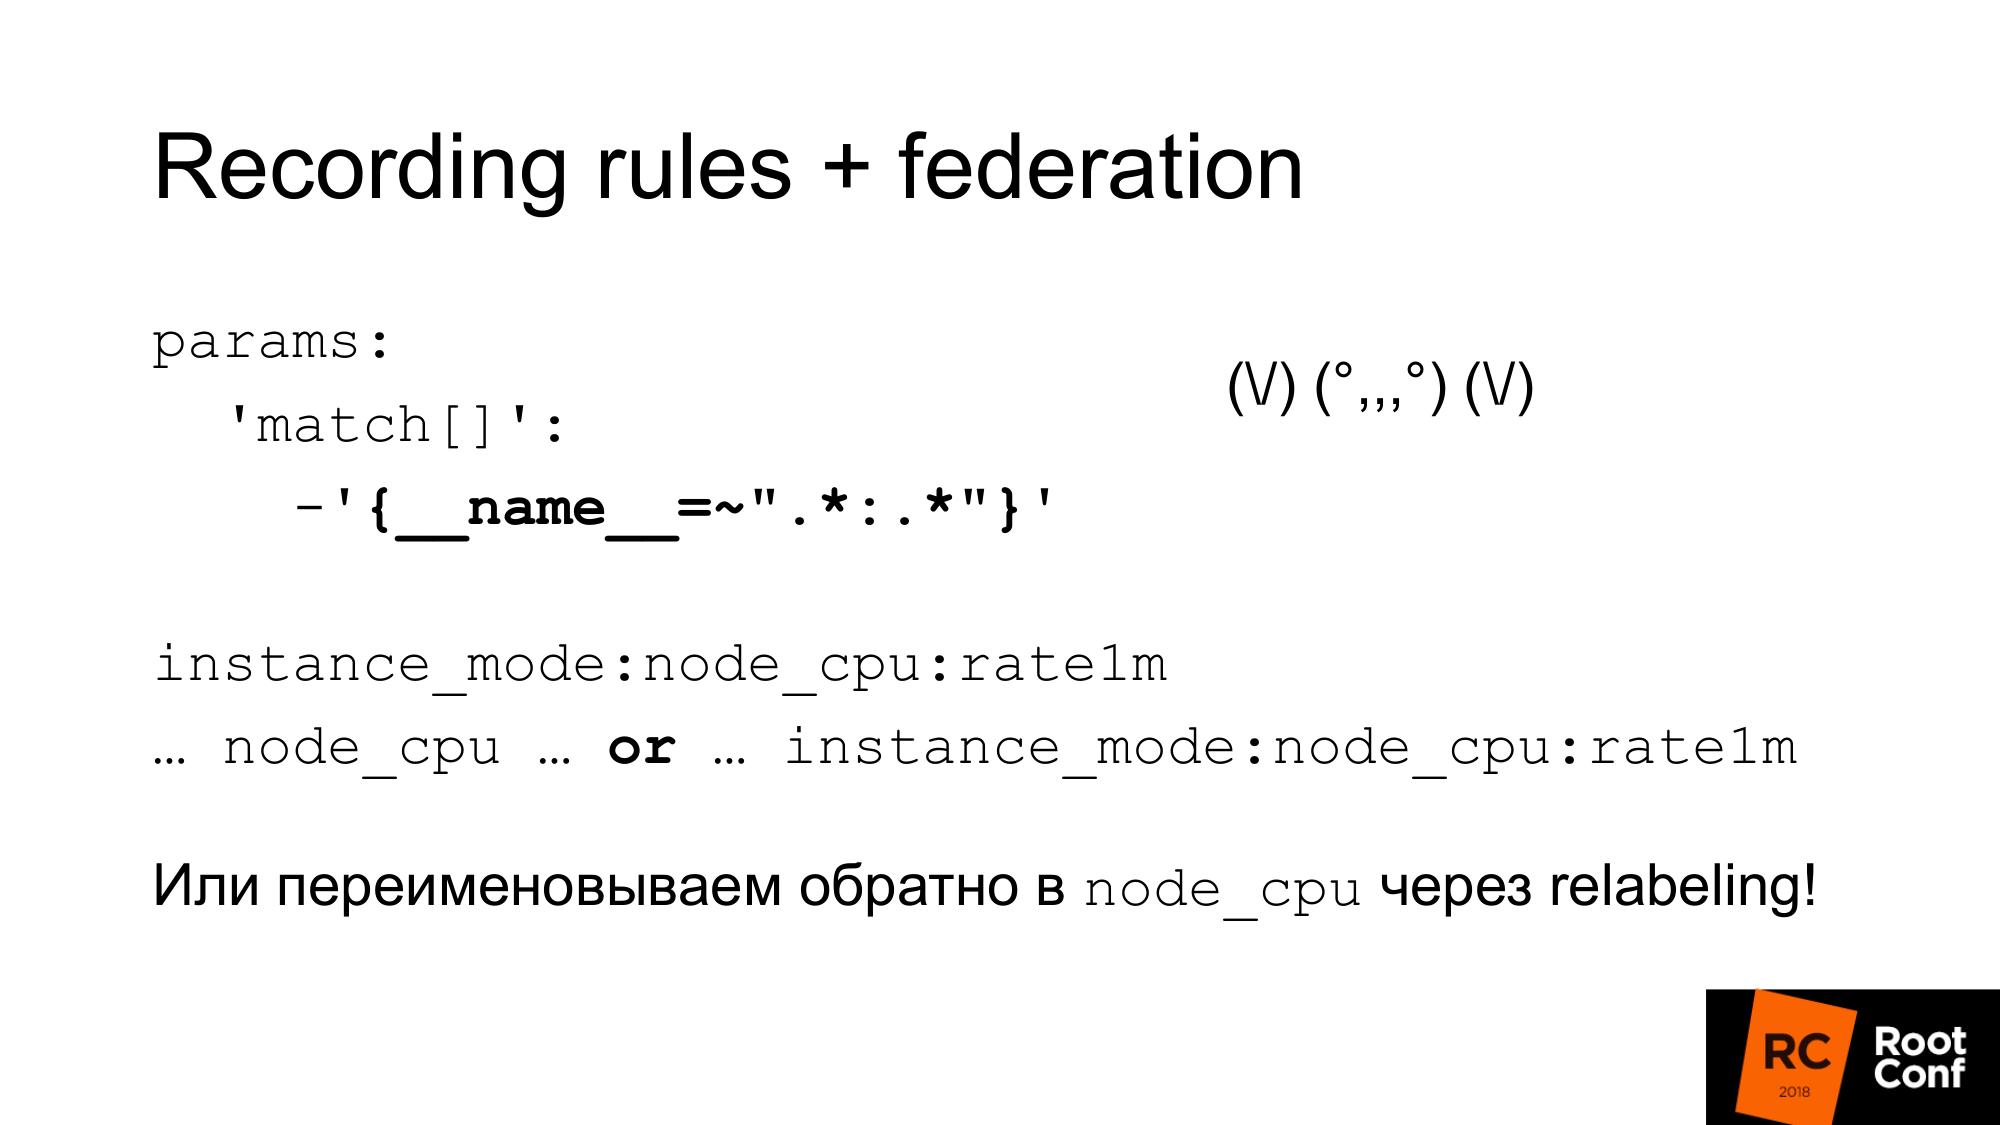
The first. We simply set up the federation and load all the data from that Prometheus. This strange regexp similar to zoidberg is actually just a colon. Left and right of the colon is an asterisk. We use the standard name for the recording rules, which adds a colon to the middle. When you divide the original name on the left will be the level of aggregation, and on the right the function. There is no normal colon metric. If there is a colon, then this is a sign that it is an aggregation. After that we use this metric name in our graph. If we want our schedule, our dashboard in grafana, to work both with the main Prometheus and with those who are higher, we can use the expression or . We take either one metric or another, depending on which one there is. We can cheat and with the help of relabeling rename the new one into the metric into the old name. This is a rather dangerous approach. You can incorrectly write regular attachments and you will have a time series conflict. Prometheus will write a lot of warnings to the log. You will see this, but finding the cause can be quite difficult. But if you do it carefully, for example, to generate these regular expressions programmatically, it will work. Next you will have a regular dashboard, where only node_cpu is used. Depending on which Prometheus is used, you will receive either raw data or aggregated data.
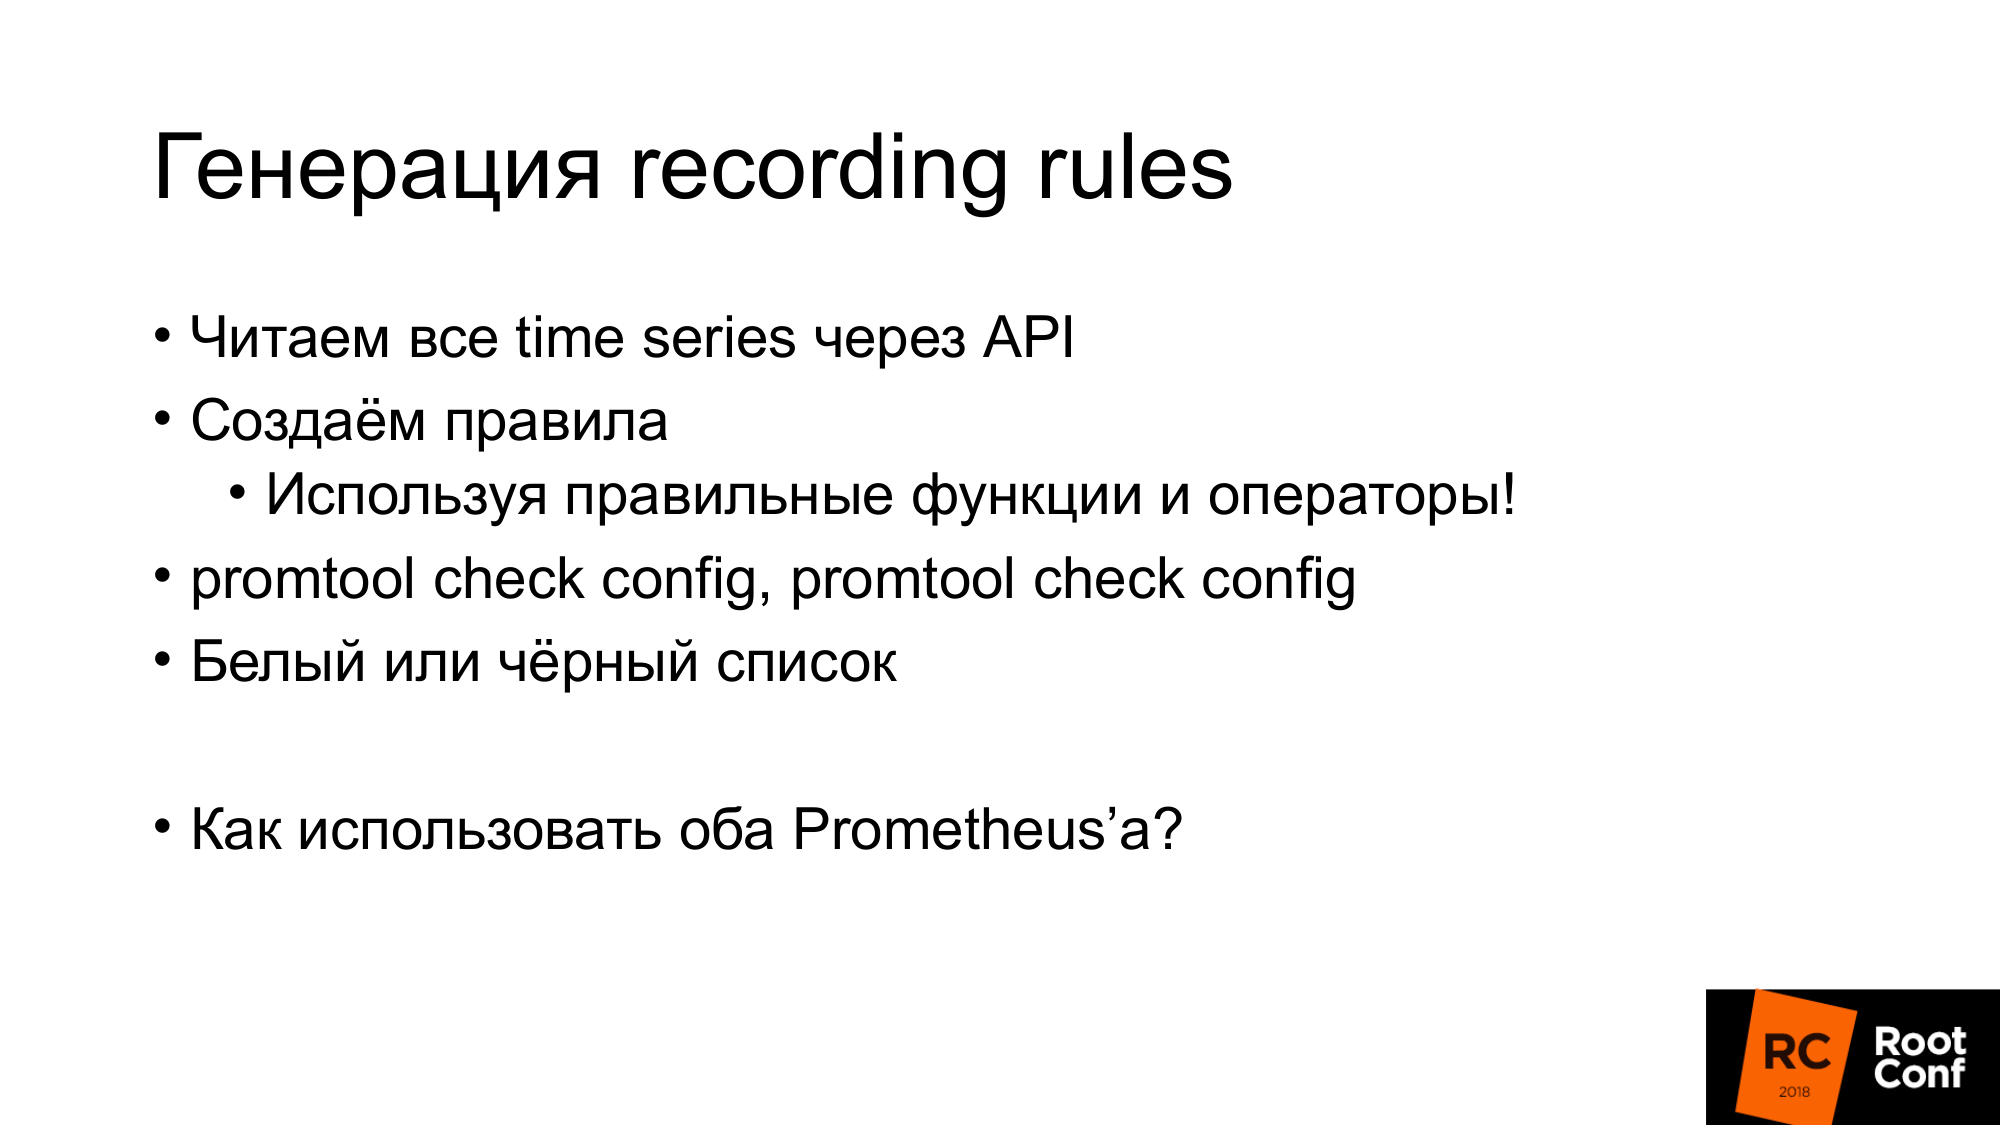
As I said, recording rules can be generated quite easily. We just get all the time series through api, which I have already shown. We create rules and these rules must use the right functions and operators. There is no need to use there rate with gauge. It will work incorrectly. It should be used only with the count. At the level where you work, you may not have information about data types. For example, if you use expfmt. There is information about the types. If the JSON API, it is not there. As a consequence, the expression that you automatically generate may not have any physical meaning. Therefore, you can use there either a white list or a black list. Depending on this, either generate the rule you need, or throw out those rules that do not make sense. There is a promtool tool that allows you to verify that the rules you generated, the config you generated, it makes sense. It has the correct syntax.
If we have Grafana and there are several Prometheus, we need to know which Prometheus to send the request to. How would we do this?
One of the ways is to put a special proxy, which will look at the time in the request, and depending on this, select Prometheus. Requests have start time and end time. Depending on this, you can do the routing with your hands. One could write some program that does it. In practice, this is done by nginx with the lua module or a small program.
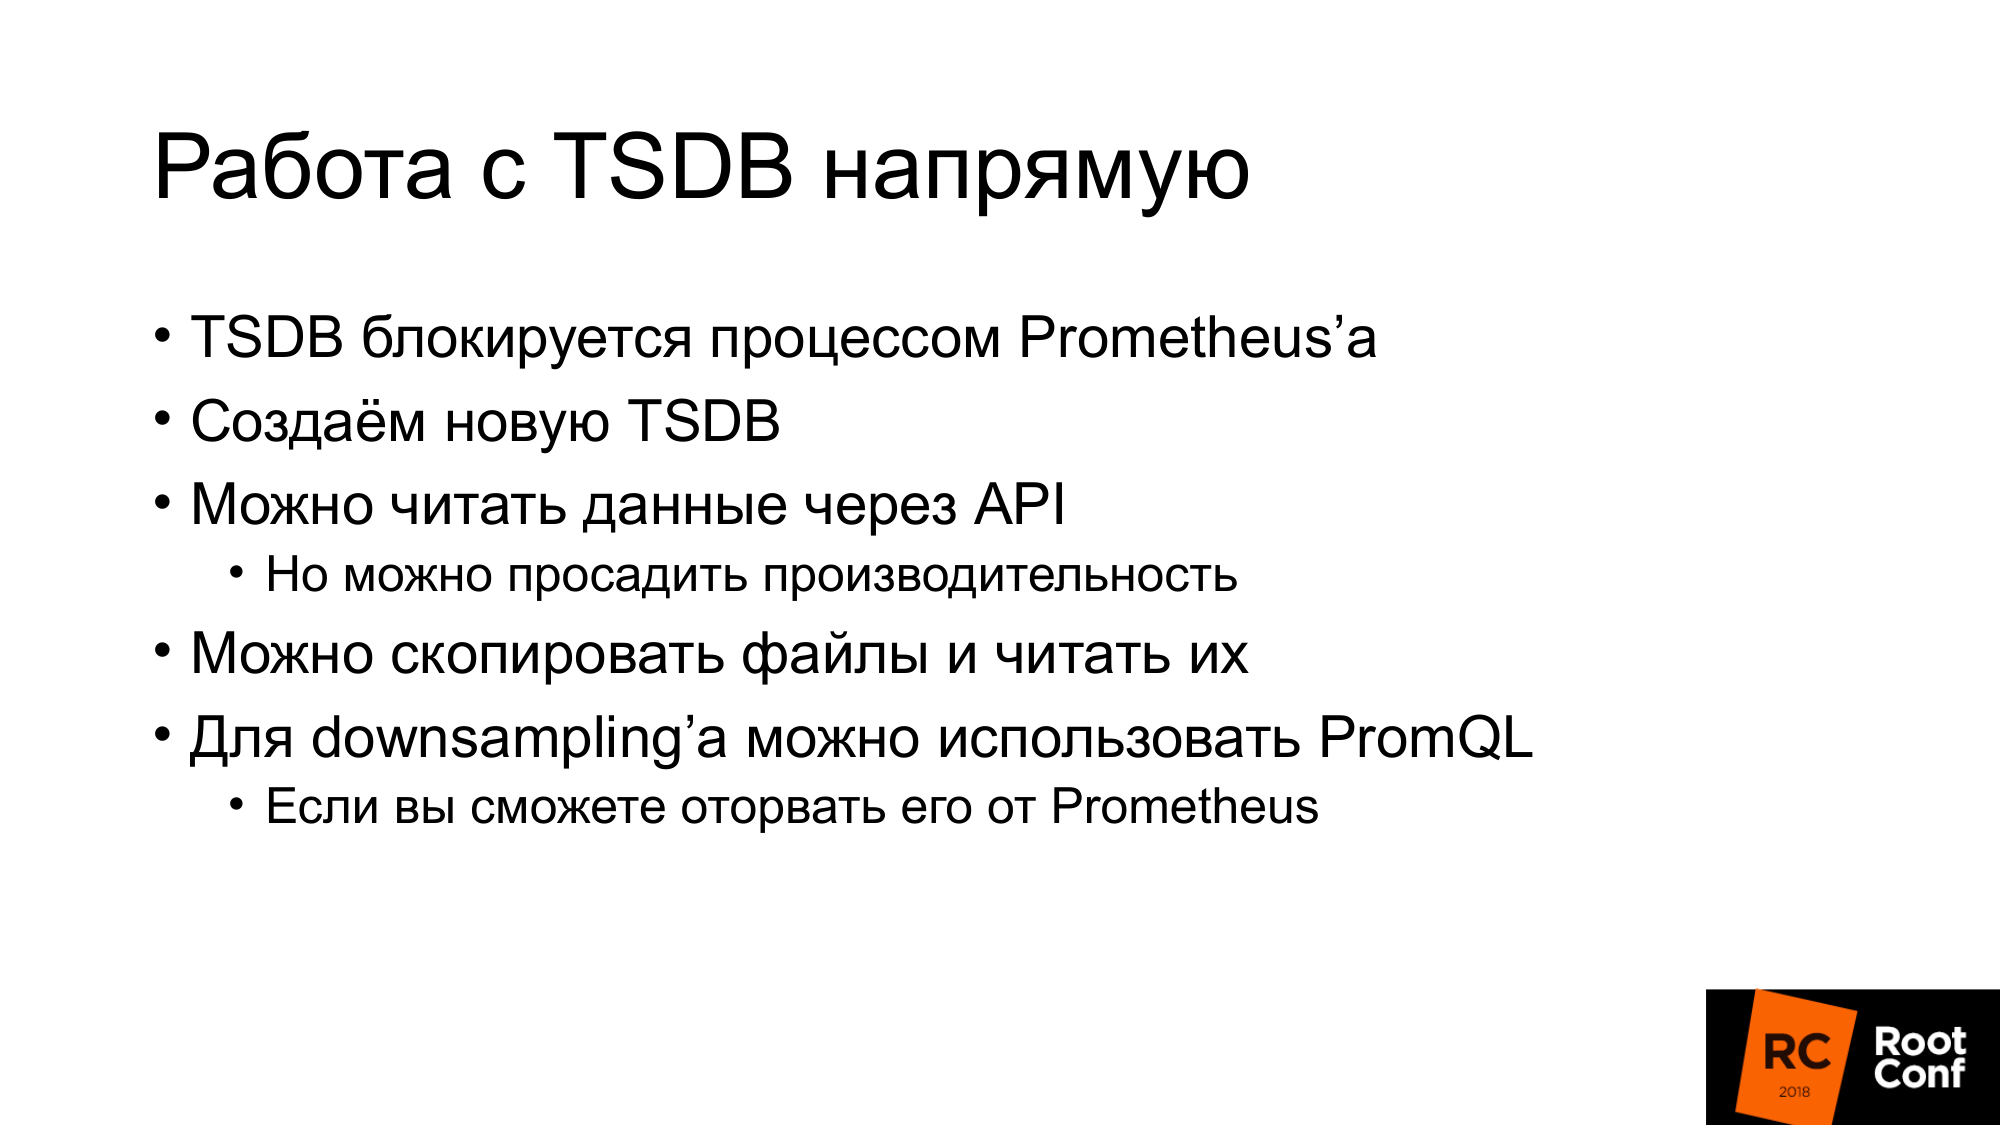
Do we really need an API? Can we work with TSDB directly? There is a nuance. First, if we try to use TSDB, which is used by Prometheus now, we will not be able to do this. There is a special lock-file that prevents this. If we write code that will ignore it and try to read or write data, we are guaranteed to damage it. In this case, even reading. What can be done? We can read data through the API and create TSDB nearby. Next stop Prometheus and replace it with TSDB. But at the same time we can lose productivity if we read all the data through the API. I'll talk about this a little later.
The second option. You can copy (make a hot backup) of these files, that is, copy as is. Yes, they will be damaged. When you open, you will have a warning that the data is damaged. They need to be fixed. You may lose new data. But it doesn't matter to us. We want to downsampling old data. Downsampling can be done using PromQL. But there is a nuance. Tearing it off from Prometheus is much more difficult than TSDB. If you're familiar with Go and c dependency management, then PromQL vendor (vendor) is a big pain. I would not advise you. If possible, avoid this.

Go to Remote Storage. Has anyone worked with remote storage in Prometheus? A few hands. Remote Storage is an API that has long existed. Now in version 2.2 Remote Storage - marked as experimental. Moreover it is known that API Remote Storage will change for sure.
Remote Storage allows you to work only with raw data. There is no PromQL either at the input or at the output. When you read, you cannot use all the power of PromQL. It essentially downloads all the data from the Remote Storage that matches the condition. Further PromQL works with them. It has a rather large overhead. You need to pump a lot of data over the network. Therefore, in Prometheus 2.3, which has not yet been released, but it is already worth it, they will read hint. We'll talk about this later.
The metadata API is missing for now. You cannot make an API that returns all time series from Remote Storage. If you make an API request from Prometheus, it will not work in Remote Storage. He will give you back the time series in his local database. If your local database is disabled, it will return you 0. That may be a little unexpected. Now this API uses ProtoBuf and will accurately change it to gRPC in the future. Now this is not done yet, because gRPC requires HTTP2. And they had problems with him in practice.
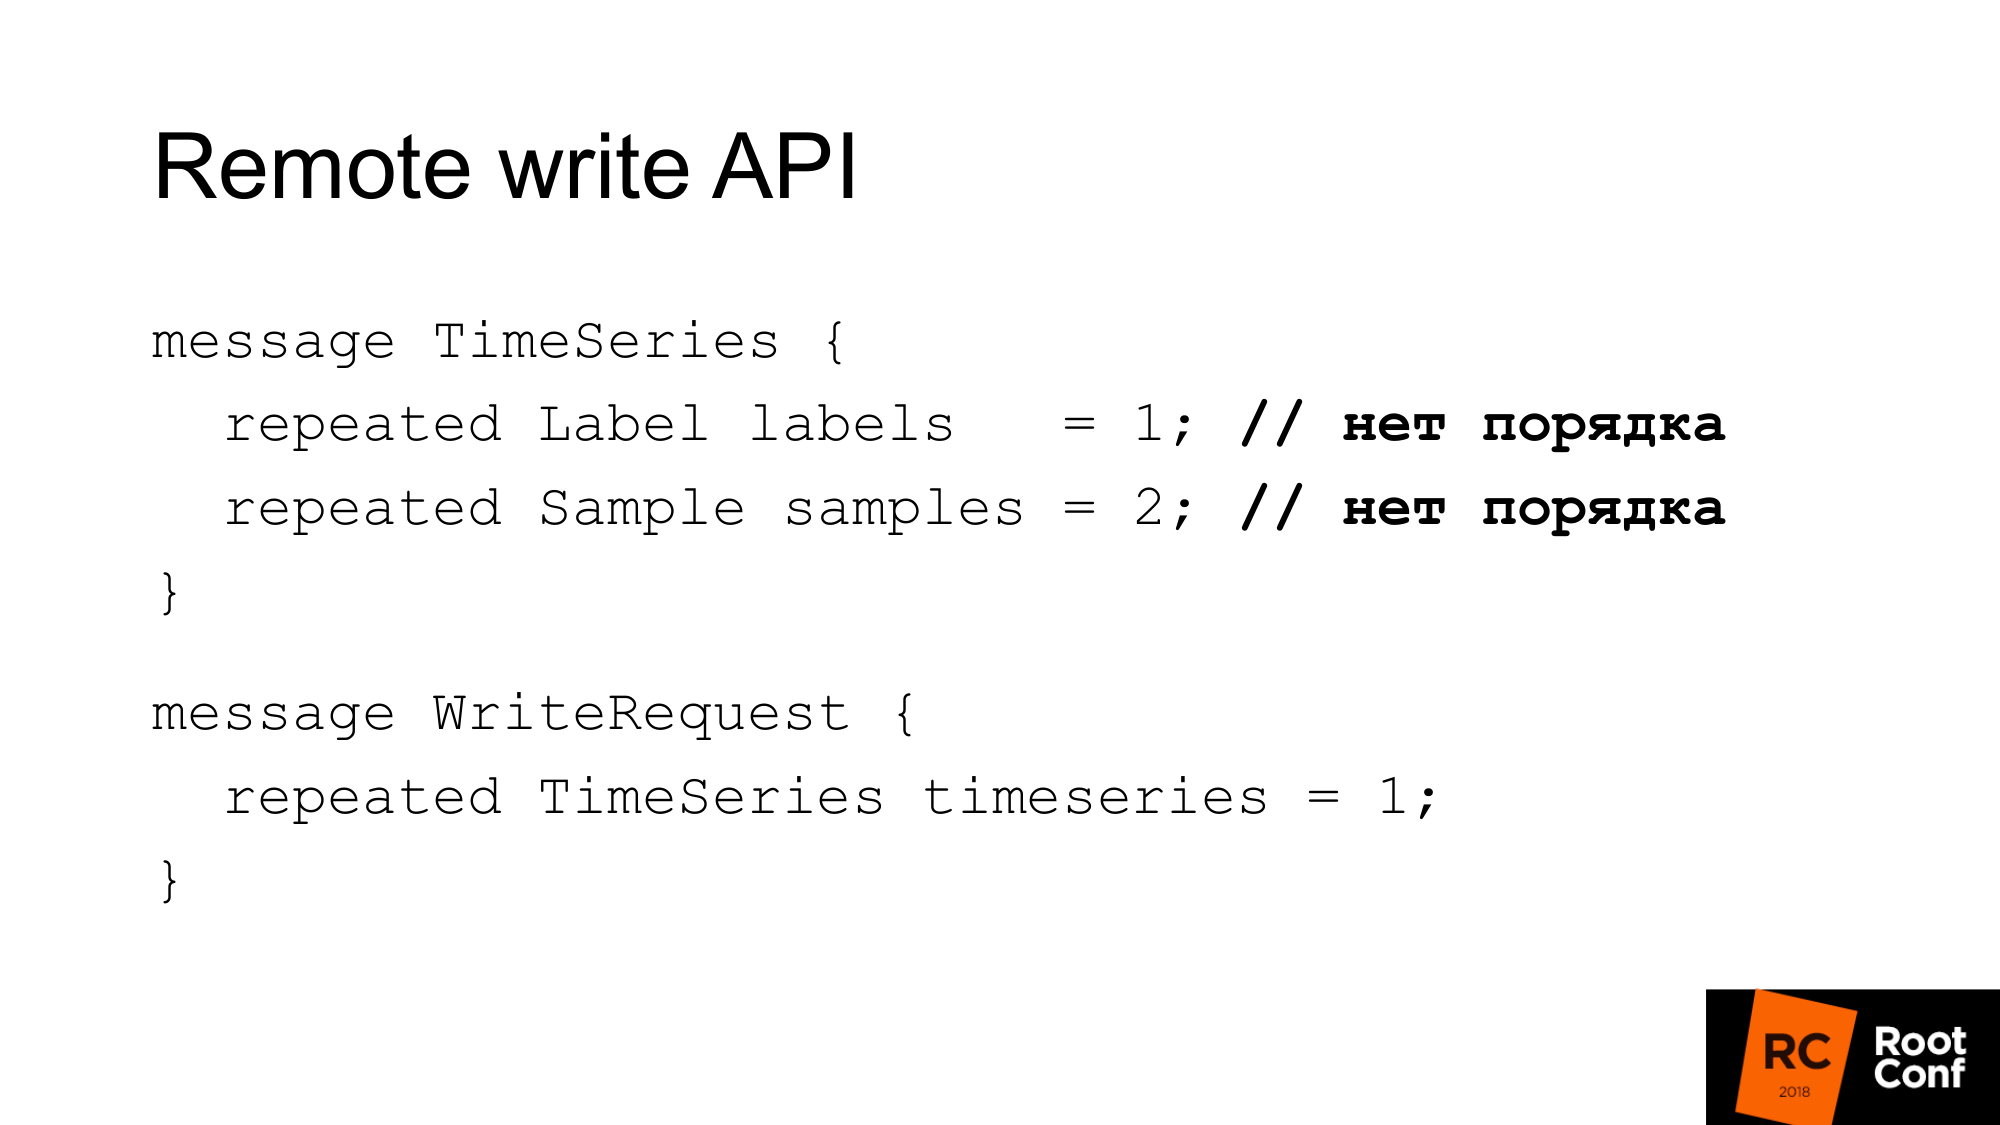
The write API looks like this. There is a set of labels in the request. The set of labels just uniquely identifies the time series. __name__ is actually just a label with a special name. And samples are a set of time and values - int64 and float64. When recording order is not important. It is assumed that the database that writes this to itself will do everything correctly. Prometheus can do some optimization and not sort it once again. Accordingly, a write request is just a few time series.
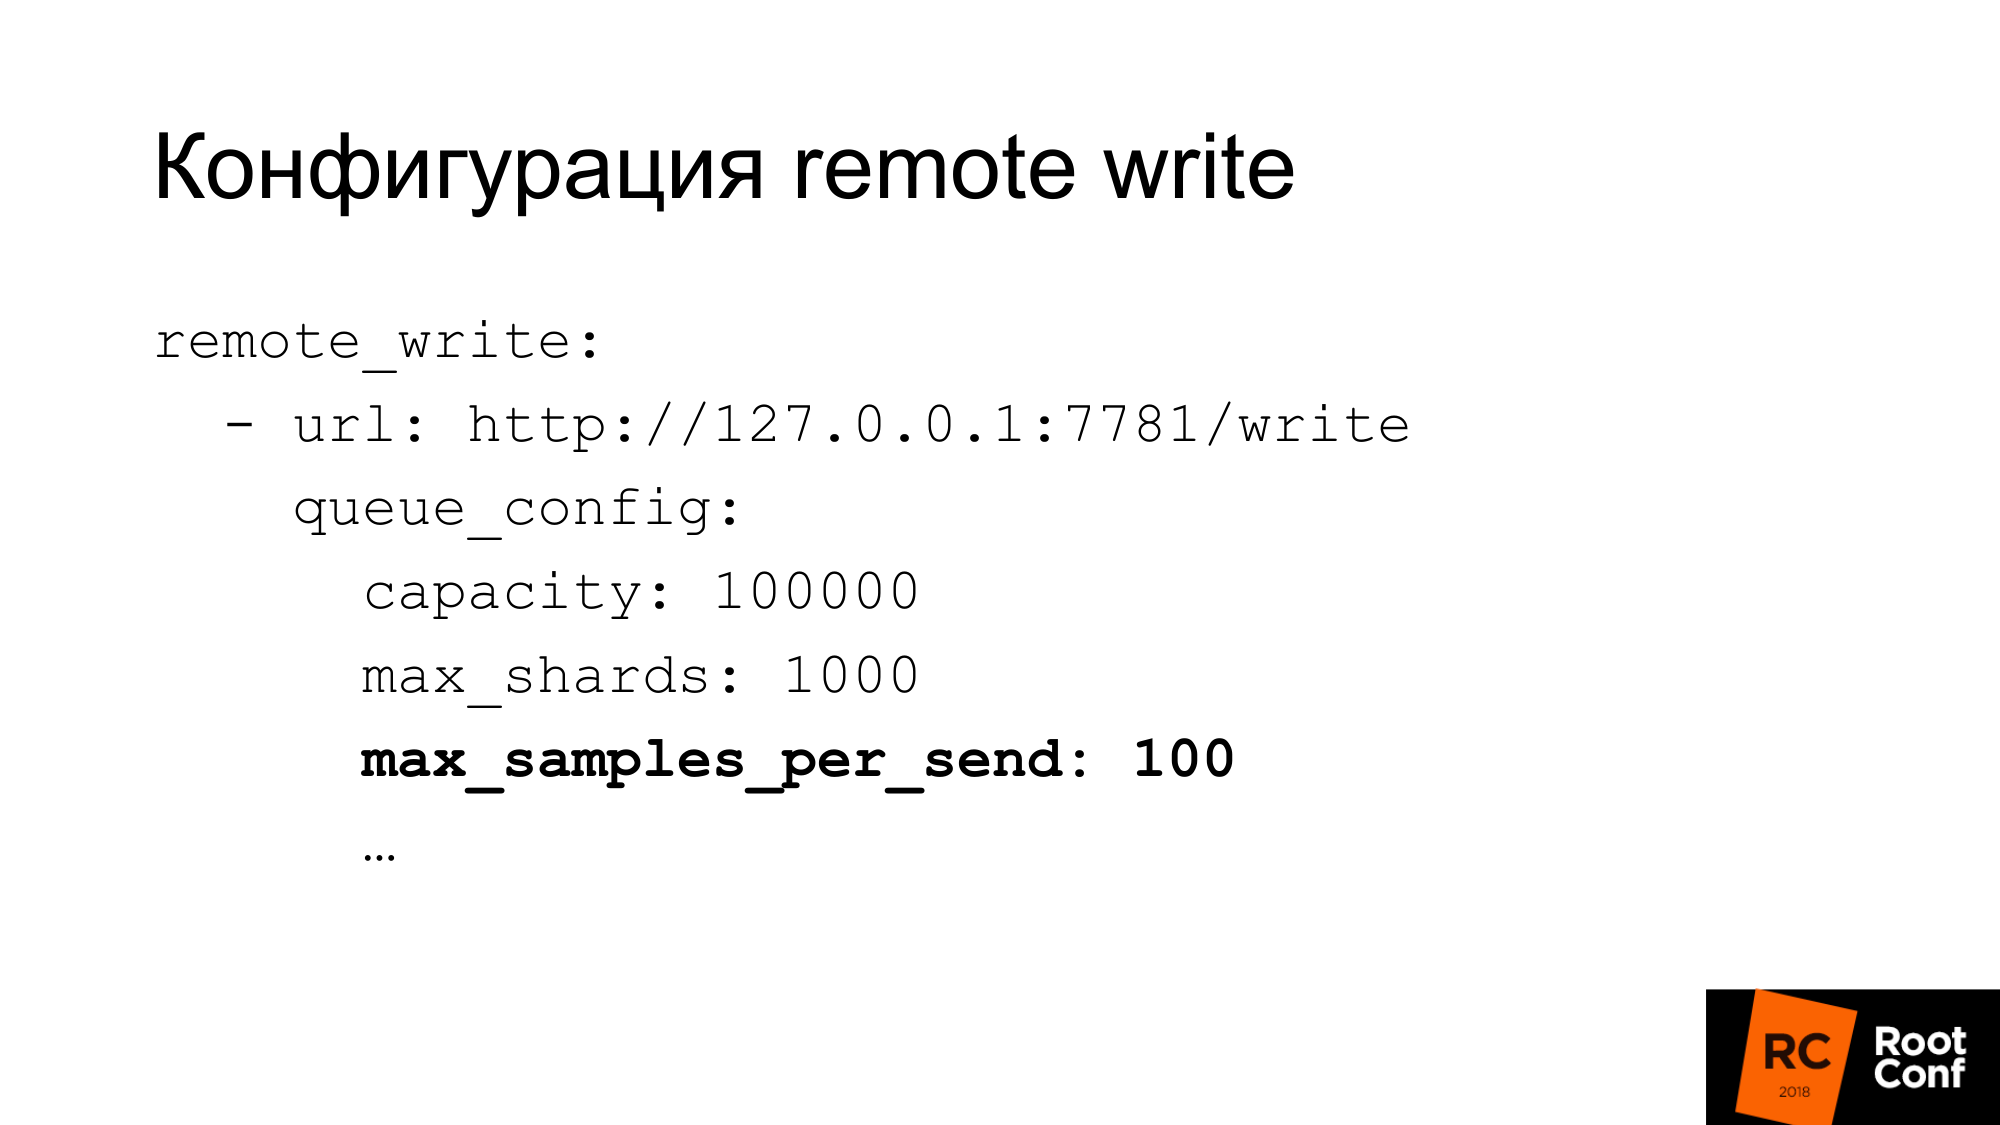
The write configuration is quite flexible. There are many options for configuring write concurrency. What Prometheus calls shards is essentially competitive inquiries. You can limit the maximum number of samples in one request, the maximum of parallel requests, timeout, how to repeat, what backoff. For many databases, 100 samples at a time - this may be very small. If you use ClickHouse, as we do, then of course the value should be greatly increased. Otherwise it will be very inefficient.
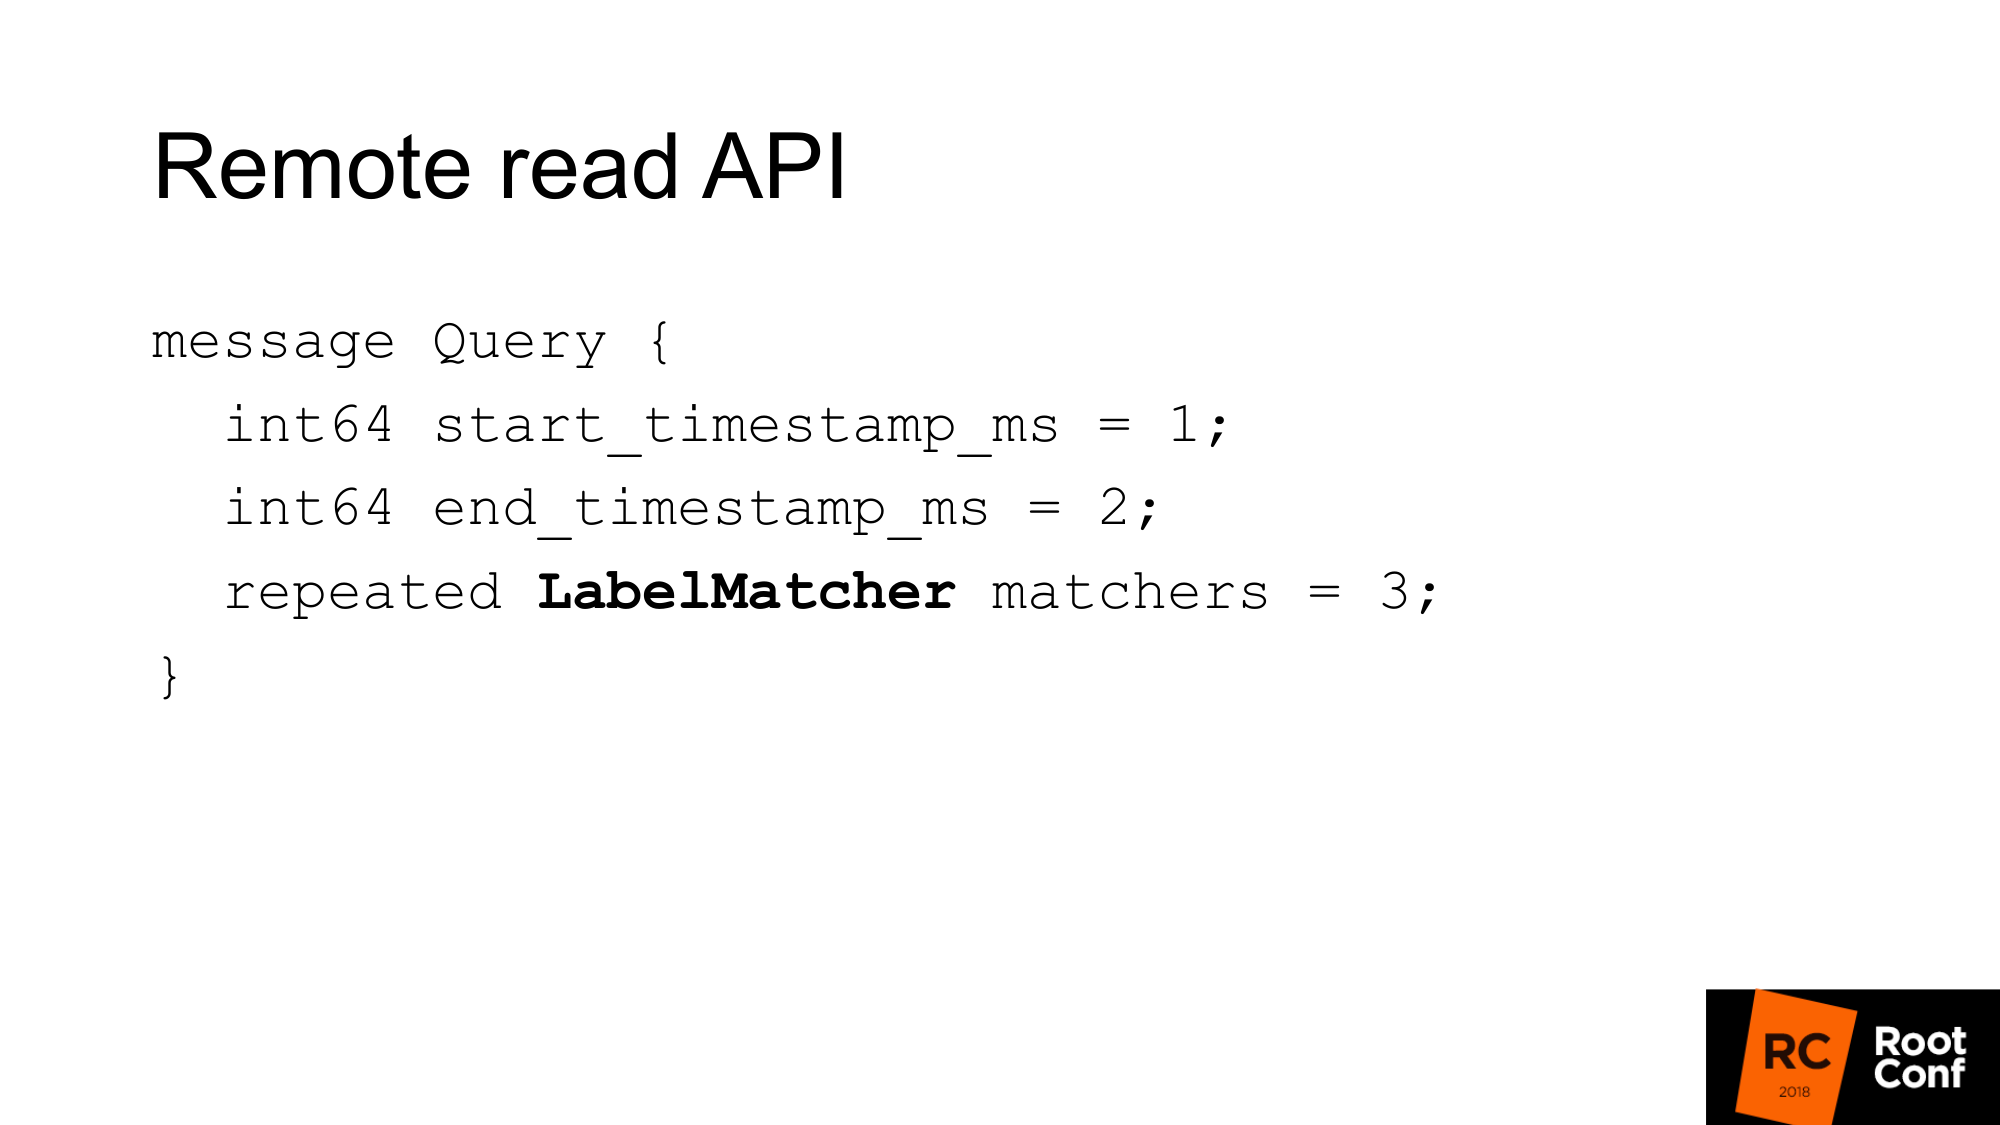
Remote read API looks like this. This is just a range in time from start to finish and a match set.
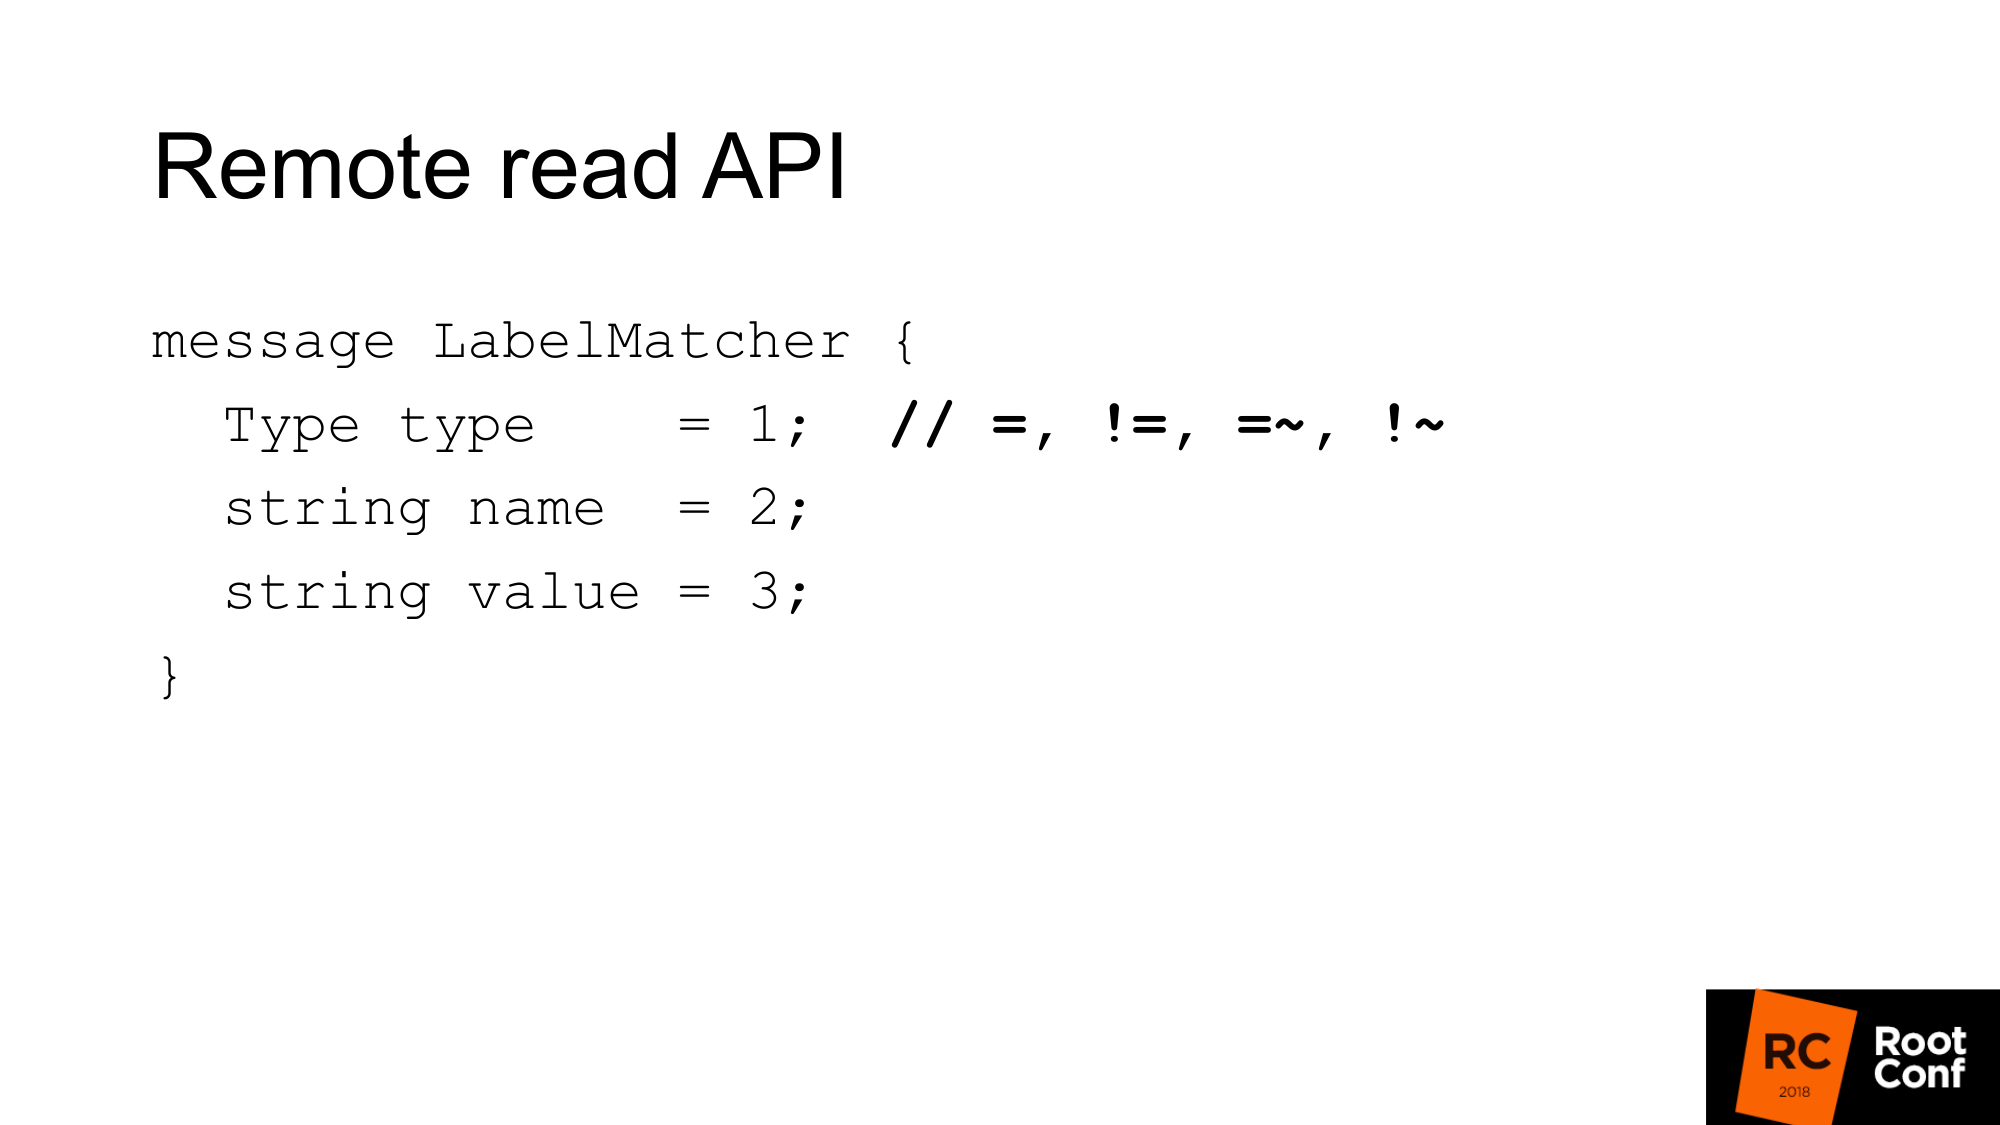
Match is essentially a set of name and value pairs — a normal label and condition type. By comparison, there are equalities, inequalities, or regular expressions. This is the usual time series selector that you see in PromQL. There are no functions here.
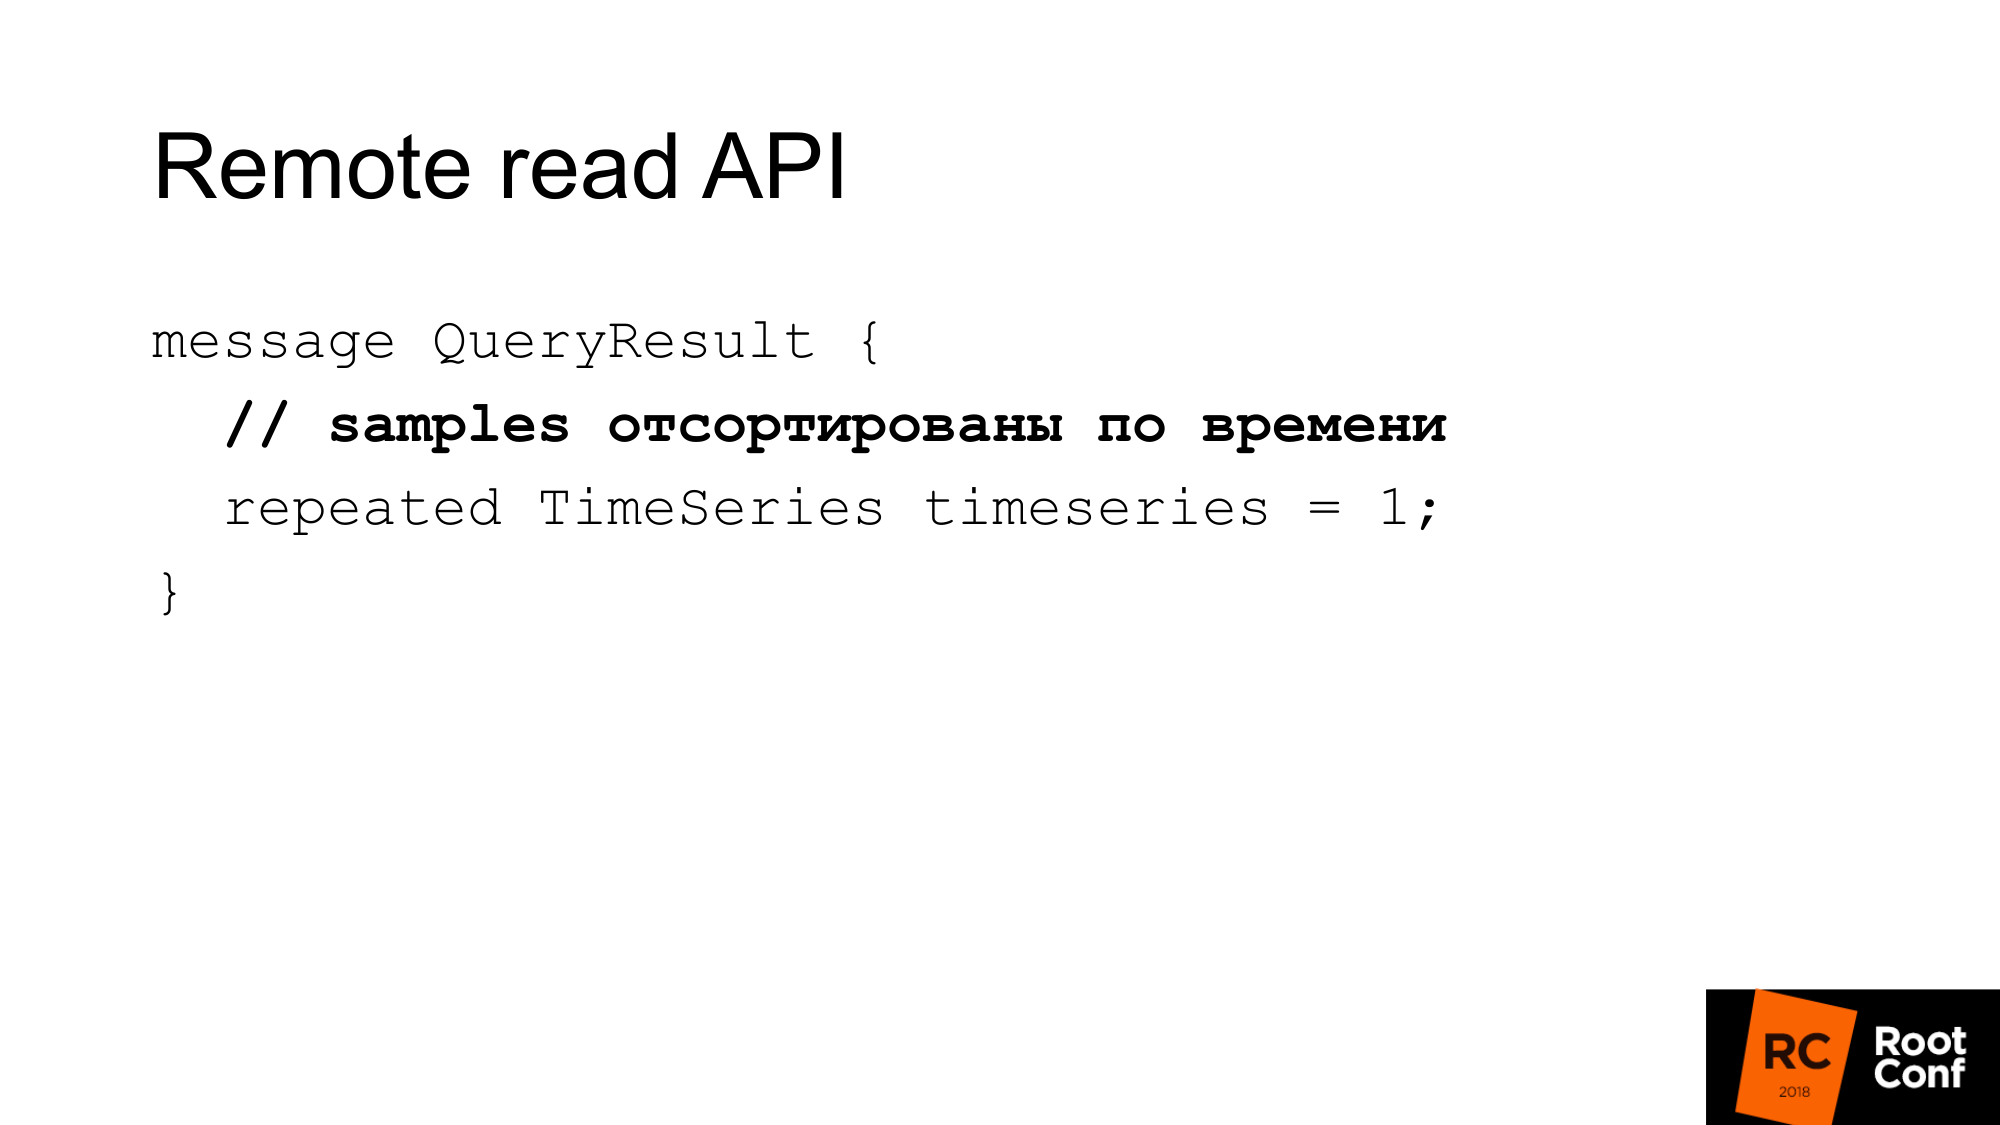
The answer is several time series that match this query. Here samples must be sorted by time. Again, this helps Prometheus save some cpu - no need to sort. But it is assumed that your database should do this. In most cases this will be the case, because, most likely, there will be an index in time.
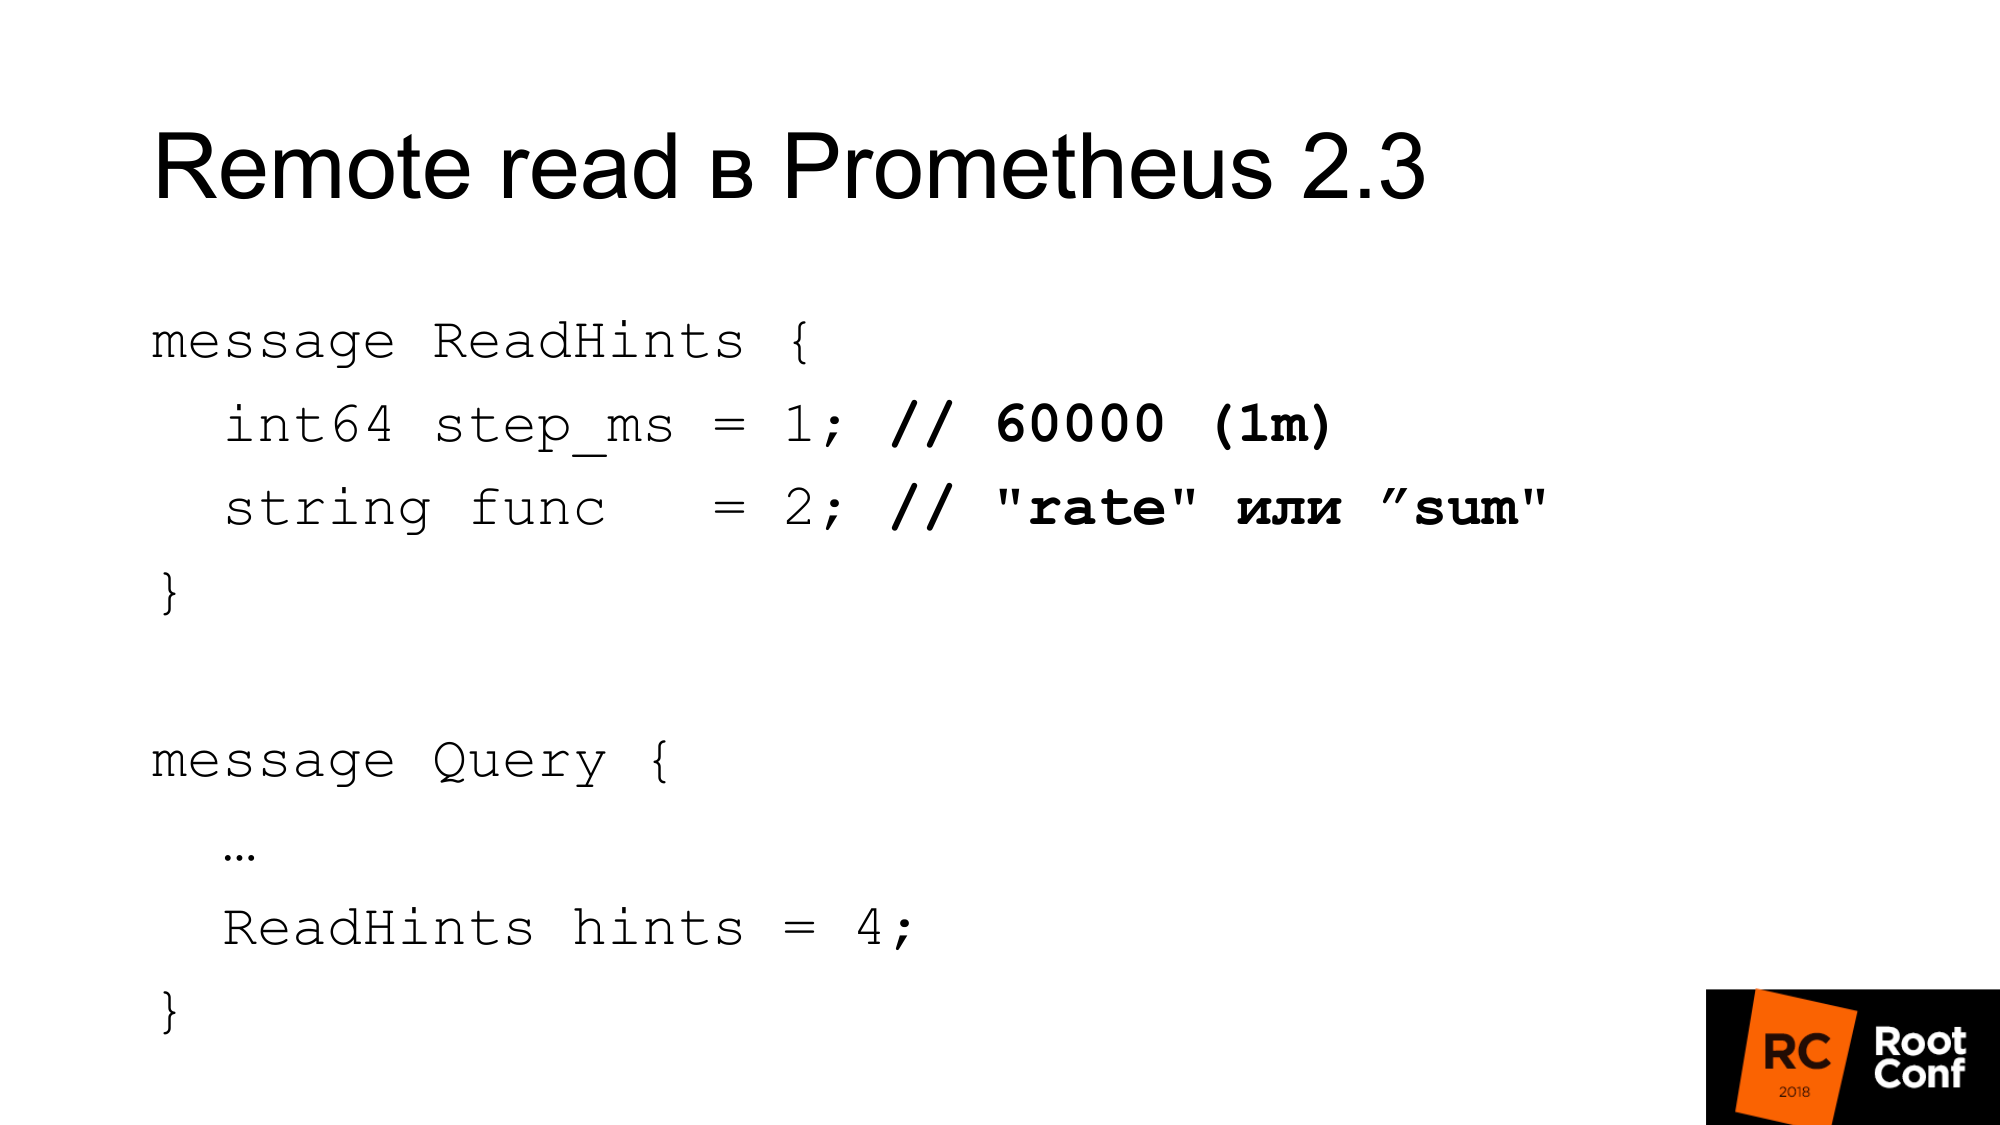
In Prometheus 2.3 appeared read hint. What it is? This is an opportunity to tell Prometheus which internal function that works with the time series that is being requested will be applied. This can be either a function or an aggregation operator. This may be the rate. That is, it is called func, but in fact it can be a sum, which from the point of view of PromQL is actually not a function at all. This is an operator. And step. In the previous example, there was a rate of 1 minute. Here rate - it will be a function and one minute in milliseconds as a step. This hint can be ignored by the remote database. At the same time, there is no indication in the answer whether it was ignored or not.
What is the configuration of the read?
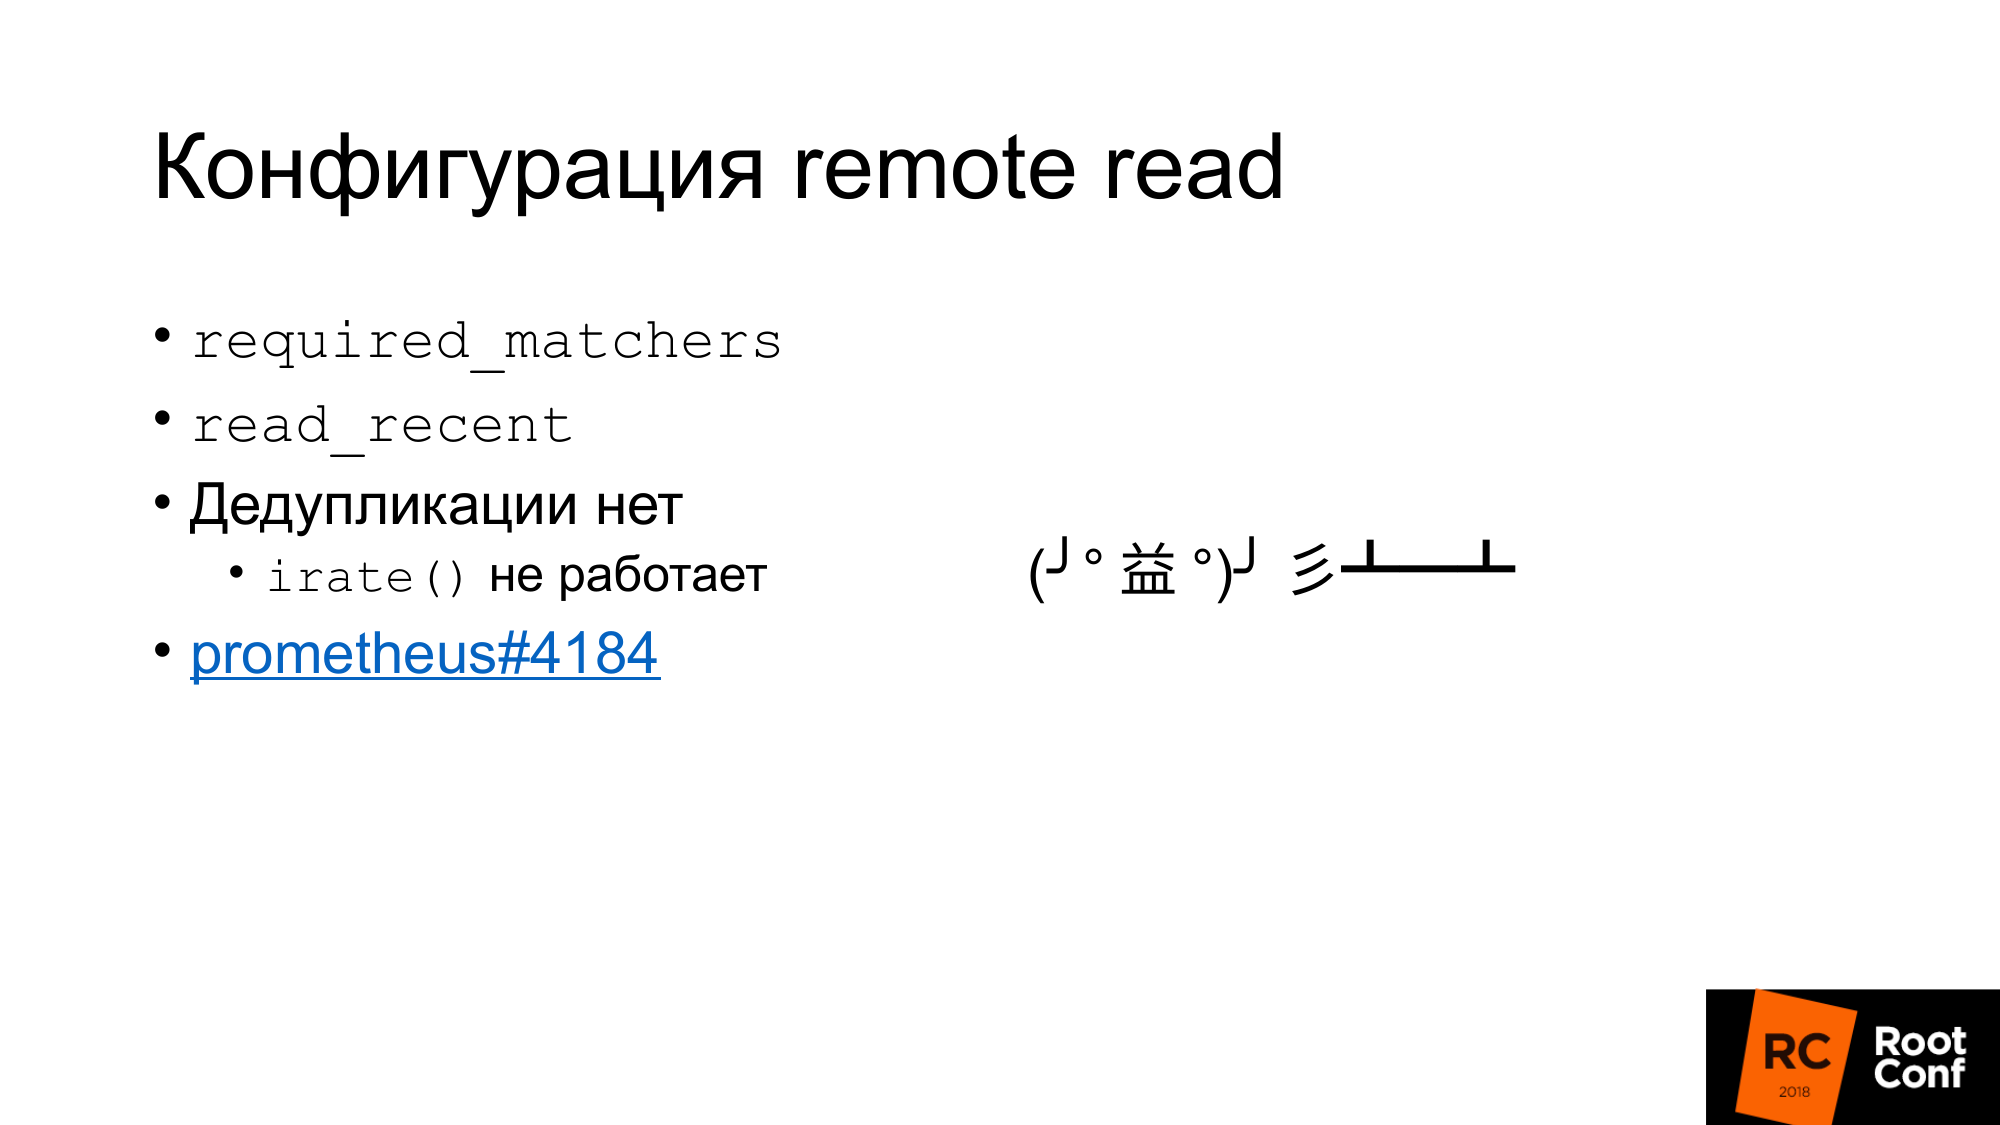
First, there is such a configuration required_matchers. This allows you to send a request for Remote Storage that match the expression. To read aggregated data from Remote Storage, you must use a query that includes a colon.
There is an option that allows you to read or not read recent data from Remote Storage, which is in the TSDB. Usually in the standard configuration there is a small local TSDB that is written to the local disk. She keeps there for several hours or several days. The data that you use now, which is used for alerts, which is used to build a dashboard, is read only from the local TSDB. It is fast, but does not allow us to store a lot of data.
Old historical data will be read from Remote Storage. This makes it clear how Local Storage and Remote Storage communicate with each other. There is no deduplication.
Essentially what happens. Data is taken from the local storage, data is taken from the remote storage, if read_recent is enabled. They just merge together. It would seem - this is not a problem. If it is assumed that we have recent data not downsample in any way, it is exactly the same data, they completely coincide with local data, we will have twice as many samples, no functions should be affected. Not really. There is a function irate () and a pair for it gauge, which returns the difference between the last two values. She looks back at a specified time range, but uses only the last two values. If we have the last two values have the same time, the difference will be zero. This is a bug and almost impossible to find. It was repaired literally four days ago. B ticket to anyone interested.
Interestingly, remote read is implemented by Prometheus itself since version 1.8. That is the way that allows you to read the data of the old Prometheus when you are migrating to version 2.x. The official way advises to connect it as a remote read. Data will be deducted as needed.
Remote read can be used to do query routing without a proxy. In one of the previous slides, I showed that, depending on the time, we can route to one Prometheus or another. Similarly, we can avoid it. Simply connect the Prometheus, which stands below, as a remote read - and the data will be read from there. But there is an amendment to the fact that of course a lot of data will be pumped. Especially if you do not use query hint.
Why ClickHouse?
For our research solution, we chose ClickHouse, because we have been looking at it for a long time. We have people who are constantly engaged in the performance of databases, constantly checking new databases. Our company deals with opensource databases.
We really like its raw performance. Its power in terms of CPU, time, and so on, is very good. Most of these systems talk about endless scalability, but they say little about efficiency for a single server. Many of our clients store metrics on a couple of servers.
Built-in replication, sharding.
GraphiteMergeTree is a special engine for storing graphite data. At first he was very interested in us.
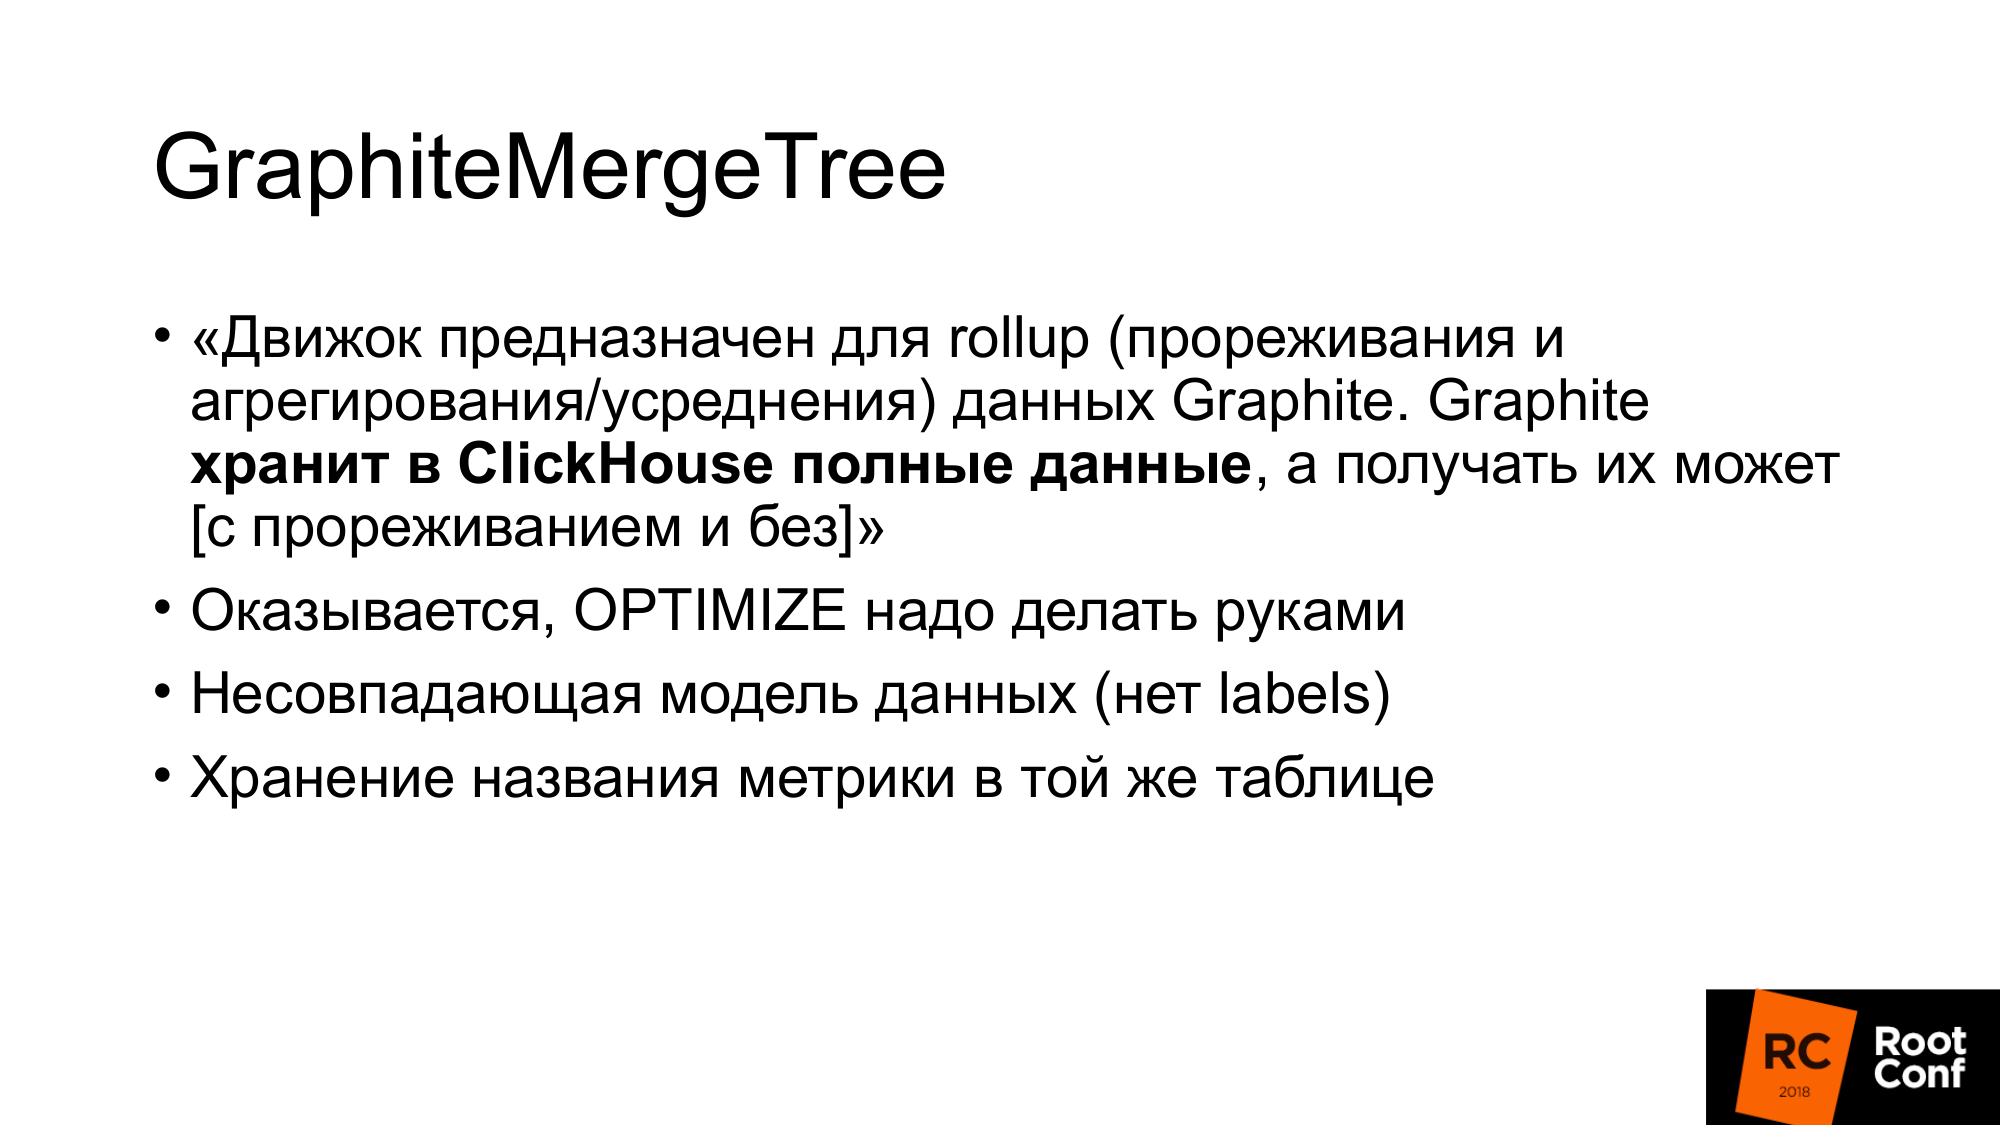
The engine is intended for rollup (thinning and aggregation / averaging) of Graphite data.
Graphite stores full data in ClickHouse, and it can be retrieved, and further it says that GraphiteMergeTree is used with thinning, but MergeTree is used without thinning. The feeling is that the data is always stored complete, they do not correspond, it is just a reading optimization. But overall this is not bad. When we do the reading, we don’t download the data, they are automatically aggregated, we get little data - that’s good. The minus for us is that the data is all stored.
I was preparing for the report at the beginning of the month. Someone enters a telegram chat and asks - "GraphiteMergeTree data downsample'nnye"? I am already writing no. The documentation says no. But another person from the chat replies "yes, you need to call optimize". I start, check - yes true. The documentation is essentially a bug. Then I read the source code, checked, it turns out there is optimize, optimize final. Optimize final was originally created just for GraphiteMergeTree. Actually downsampling he does. But you have to call him with your hands.
GraphiteMergeTree has a different data model. He has no labels. Effectively writing it all in the name of the metrics is not very good at it.
The name of the metrics are stored in one table. The name of the metrics has different lengths. This leads to the fact that if we search the index by the name of the metric, due to the fact that the length is different, this index would not be as effective as if the index had a value of a fixed length. Because you need to do a file search. It is impossible to specify exactly where to land in order to do a binary search.
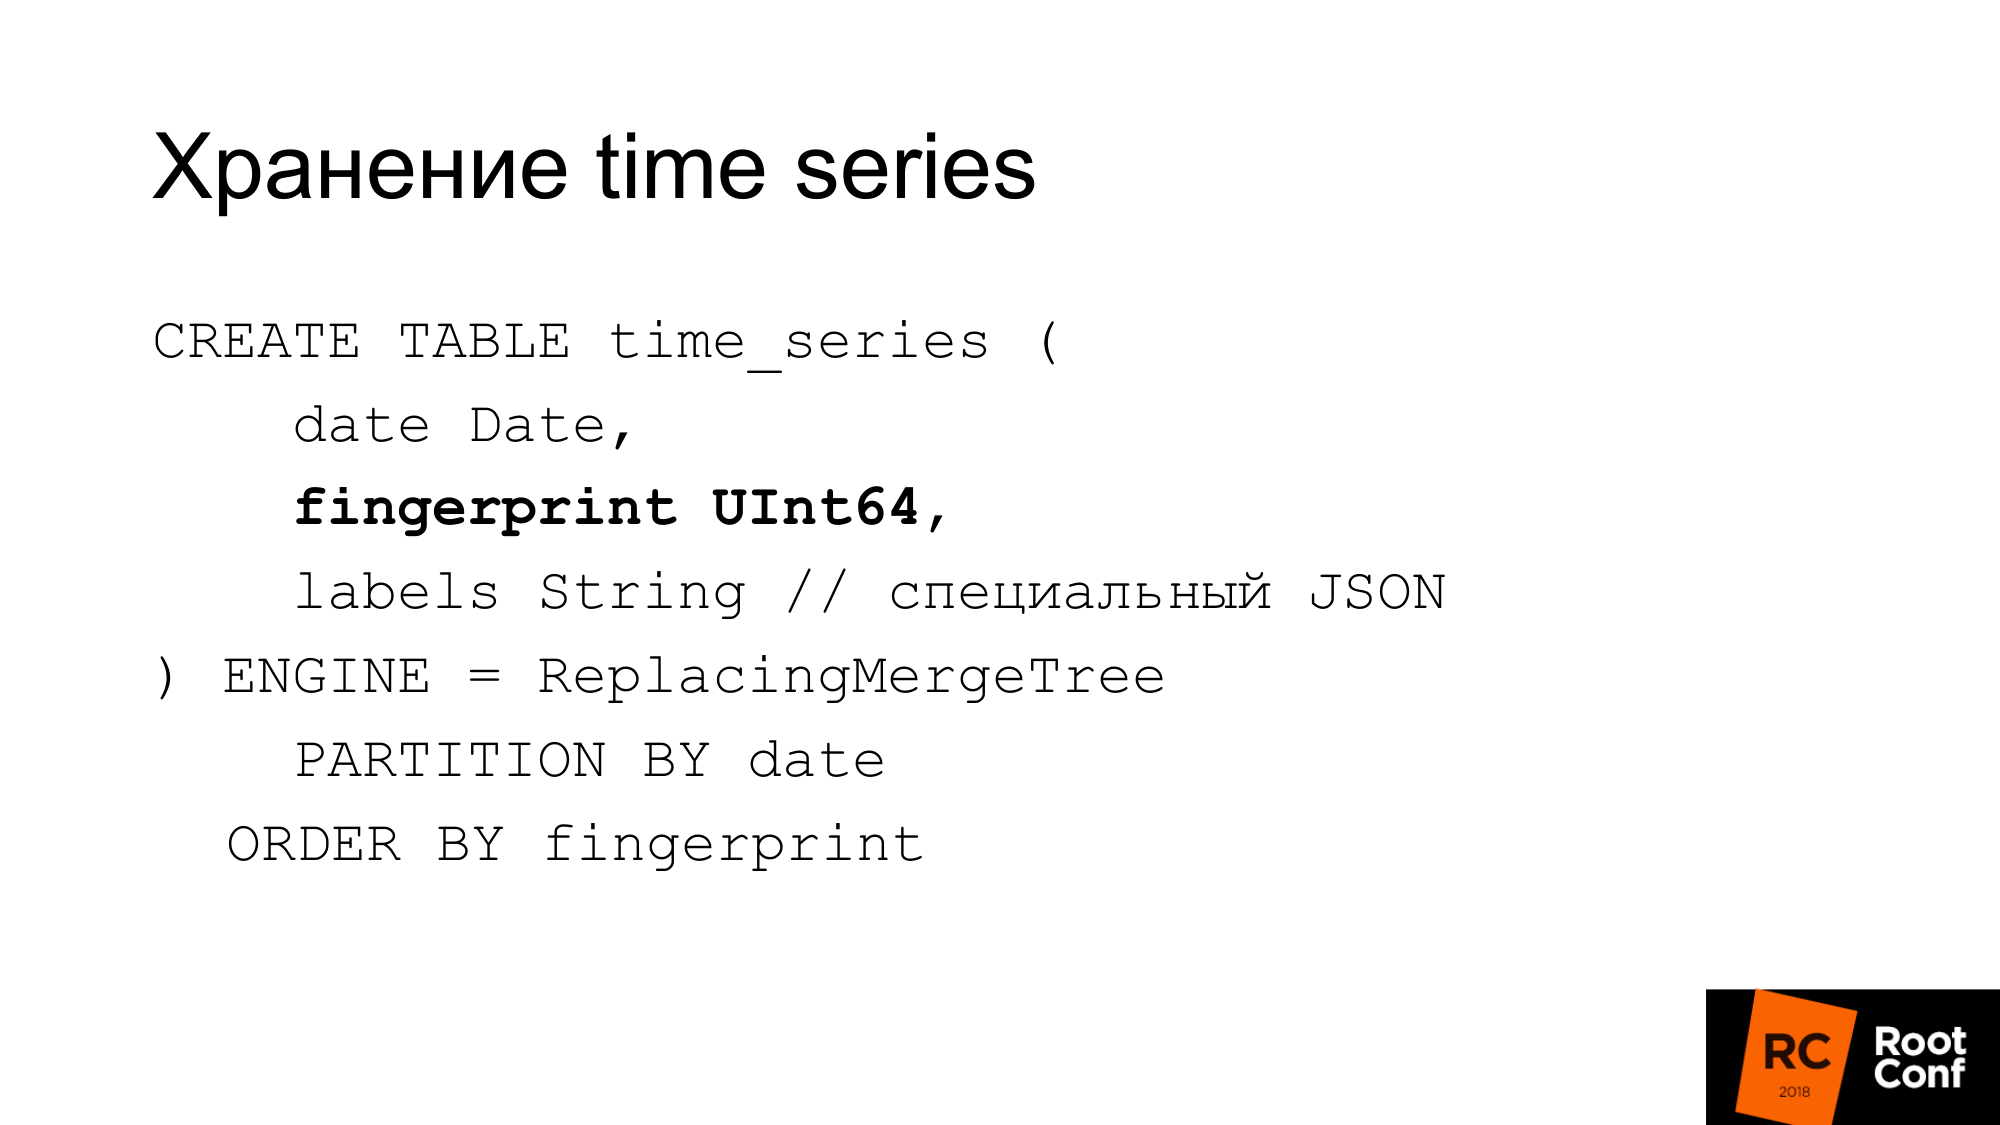
Therefore, we made our own scheme. The slide shows how our time series is stored in the database. The date ClickHouse needs is a fingerprint. If you watched the source code of Prometheus or TSDB, then you know that the fingerprint is in essence a short fast checksum of the full name of the time series. Fingerprint - a combination of all labels, keys and values. The name is a regular label. We use the same algorithm for compatibility. If something debug, then it can be convenient. Fingerprint matches and it can be checked in TSDB and in our storage that they are the same. Labels are stored in a special JSON, which allows ClickHouse to work with it with its standard functions. This is a compact JSON without spaces, with a bit of simplified naming. This table is not used during operation. It is always stored in the memory of our own solution, which is called PromHouse. It is used only when we start the server in order to find out what time series there are. She read. As new time series arrives, we write them there. All several PromHouse instances can read the same table. ReplacingMergeTree tells us that these time series - there are several different instances - they write the same time series. They smother - and there will be no problem here.
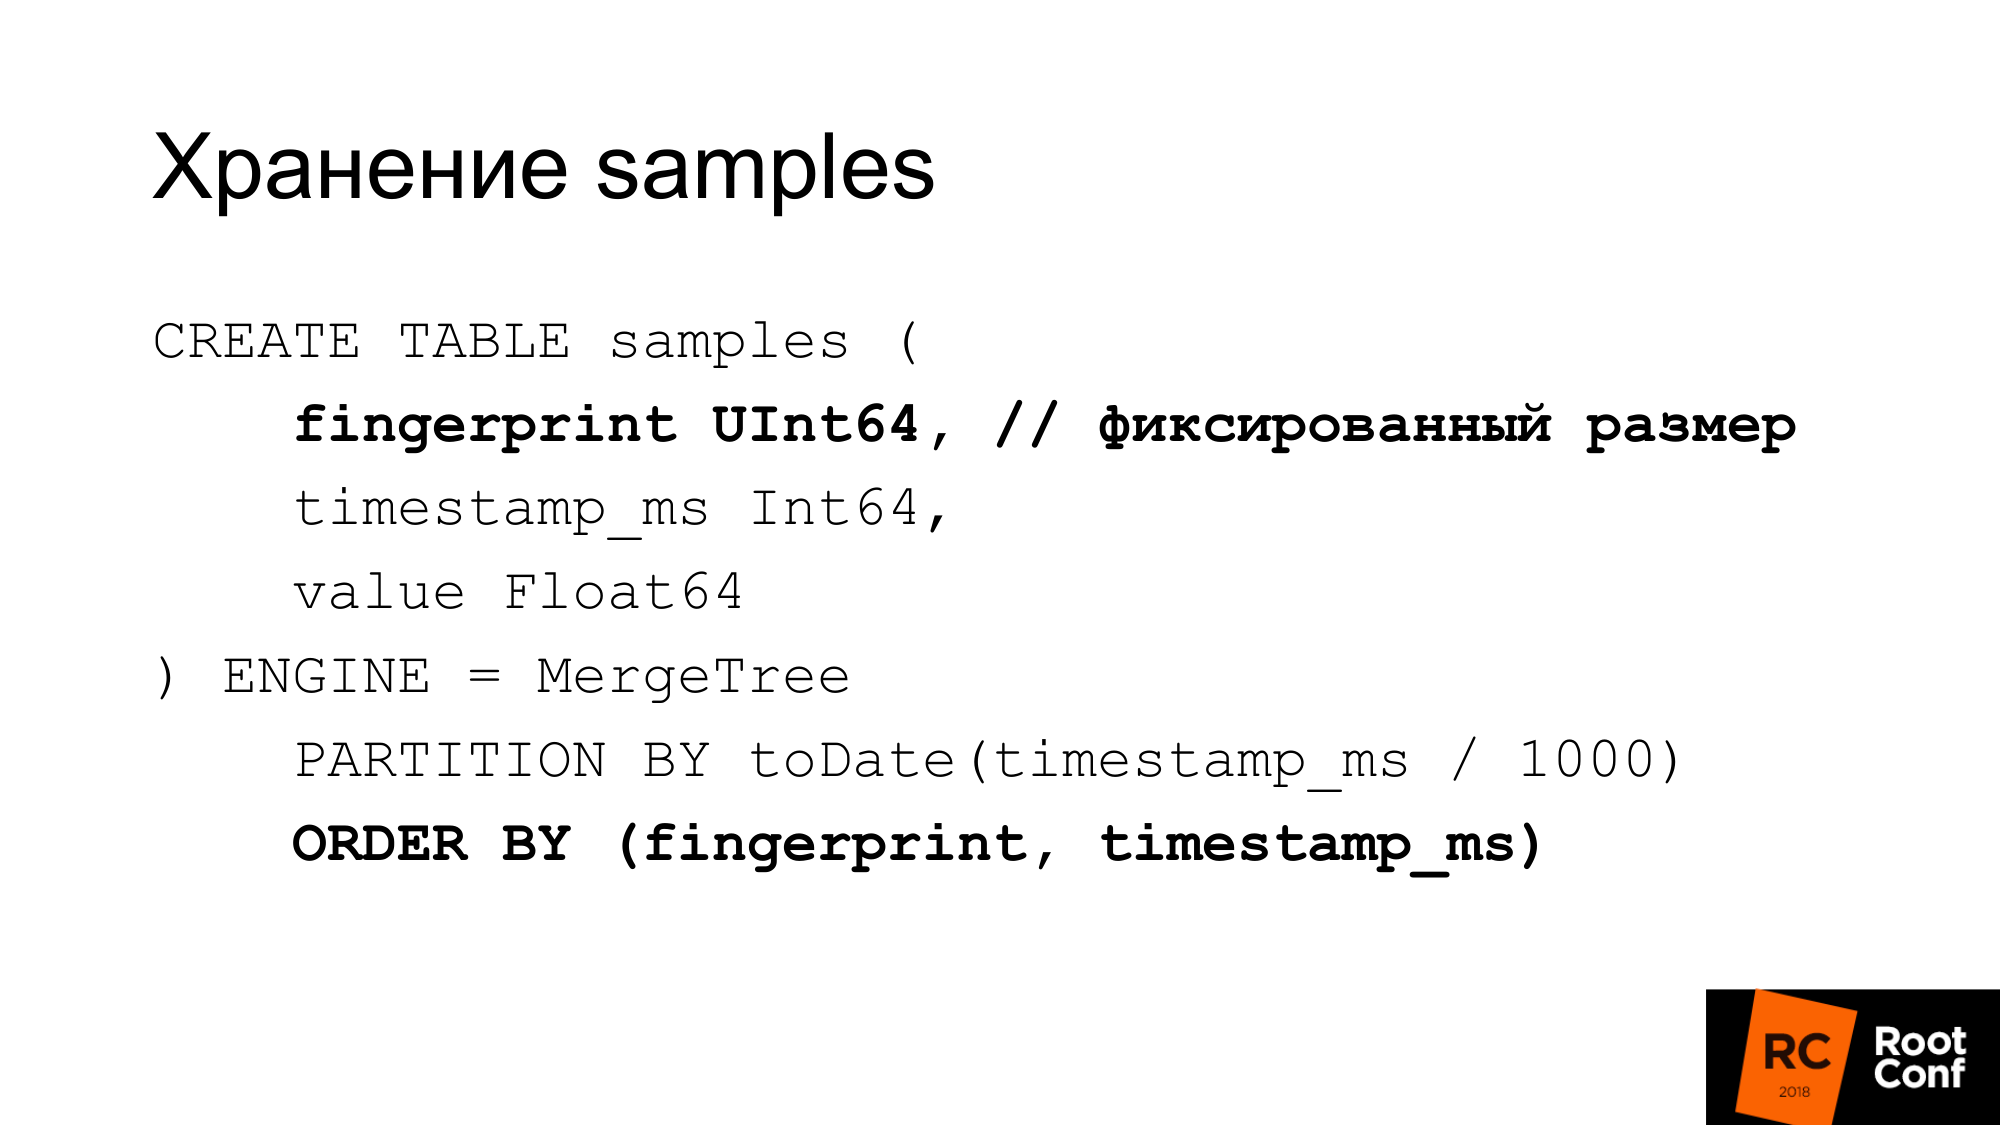
We store samples in a separate table very effectively. With a fixed length value, this fingerprint is the same time and value. We get 24 bytes on sample. It has a strictly fixed length. Each column is stored separately. A fingerprint search is effective because we know that the size is fixed. There is no such problem as with GraphitmergeTree when it is a string. We use custom (custom) partitioning. The primary index fingerprint and on time.
24 bytes is in a simplified version. In fact, it compresses well. In fact uses less space. In our latest tests, the compression ratio is about 1 to 42.

How can we do manual downsampling if we have GraphiteMergeTree, but not the way we would like. In fact, we can do it by hand. As before, sharding was done, partitioning, when there was nothing built-in. Making a new table with our hands. When a sample comes to us in time, we determine which table we write to.
We select in time from the query, from which table to read. If reading occurs on the border, read several tables. Further merge these data. One could use view for this. For example, to make view for several tables which allows to read it one request. But there is a bug in ClickHouse: the predicate from view is not substituted into queries. Therefore, if you make a query in view, then it goes to all tables. View we can not use.
How do we do downsampling? We create a temporary table. We copy from it the insert into select data, using the correct functions.
We do rename, which is atomic under the global lock. We rename the existing table to the old one. New to existing. We drop the old table. We have data for 148 days already downsampling. What is the problem here? Insert into looks beautiful. In fact, we need to apply the right functions, the right aggregation to do. In practice, this can not be done in one large request. Even a few large queries can not be done. This has to be done from the code. The code sends a large number of small requests. We tried our best to do this with large queries, but this is not very effective. Downsampling data of one day so far takes less than a day. Depending on the amount of data it may take a long time.
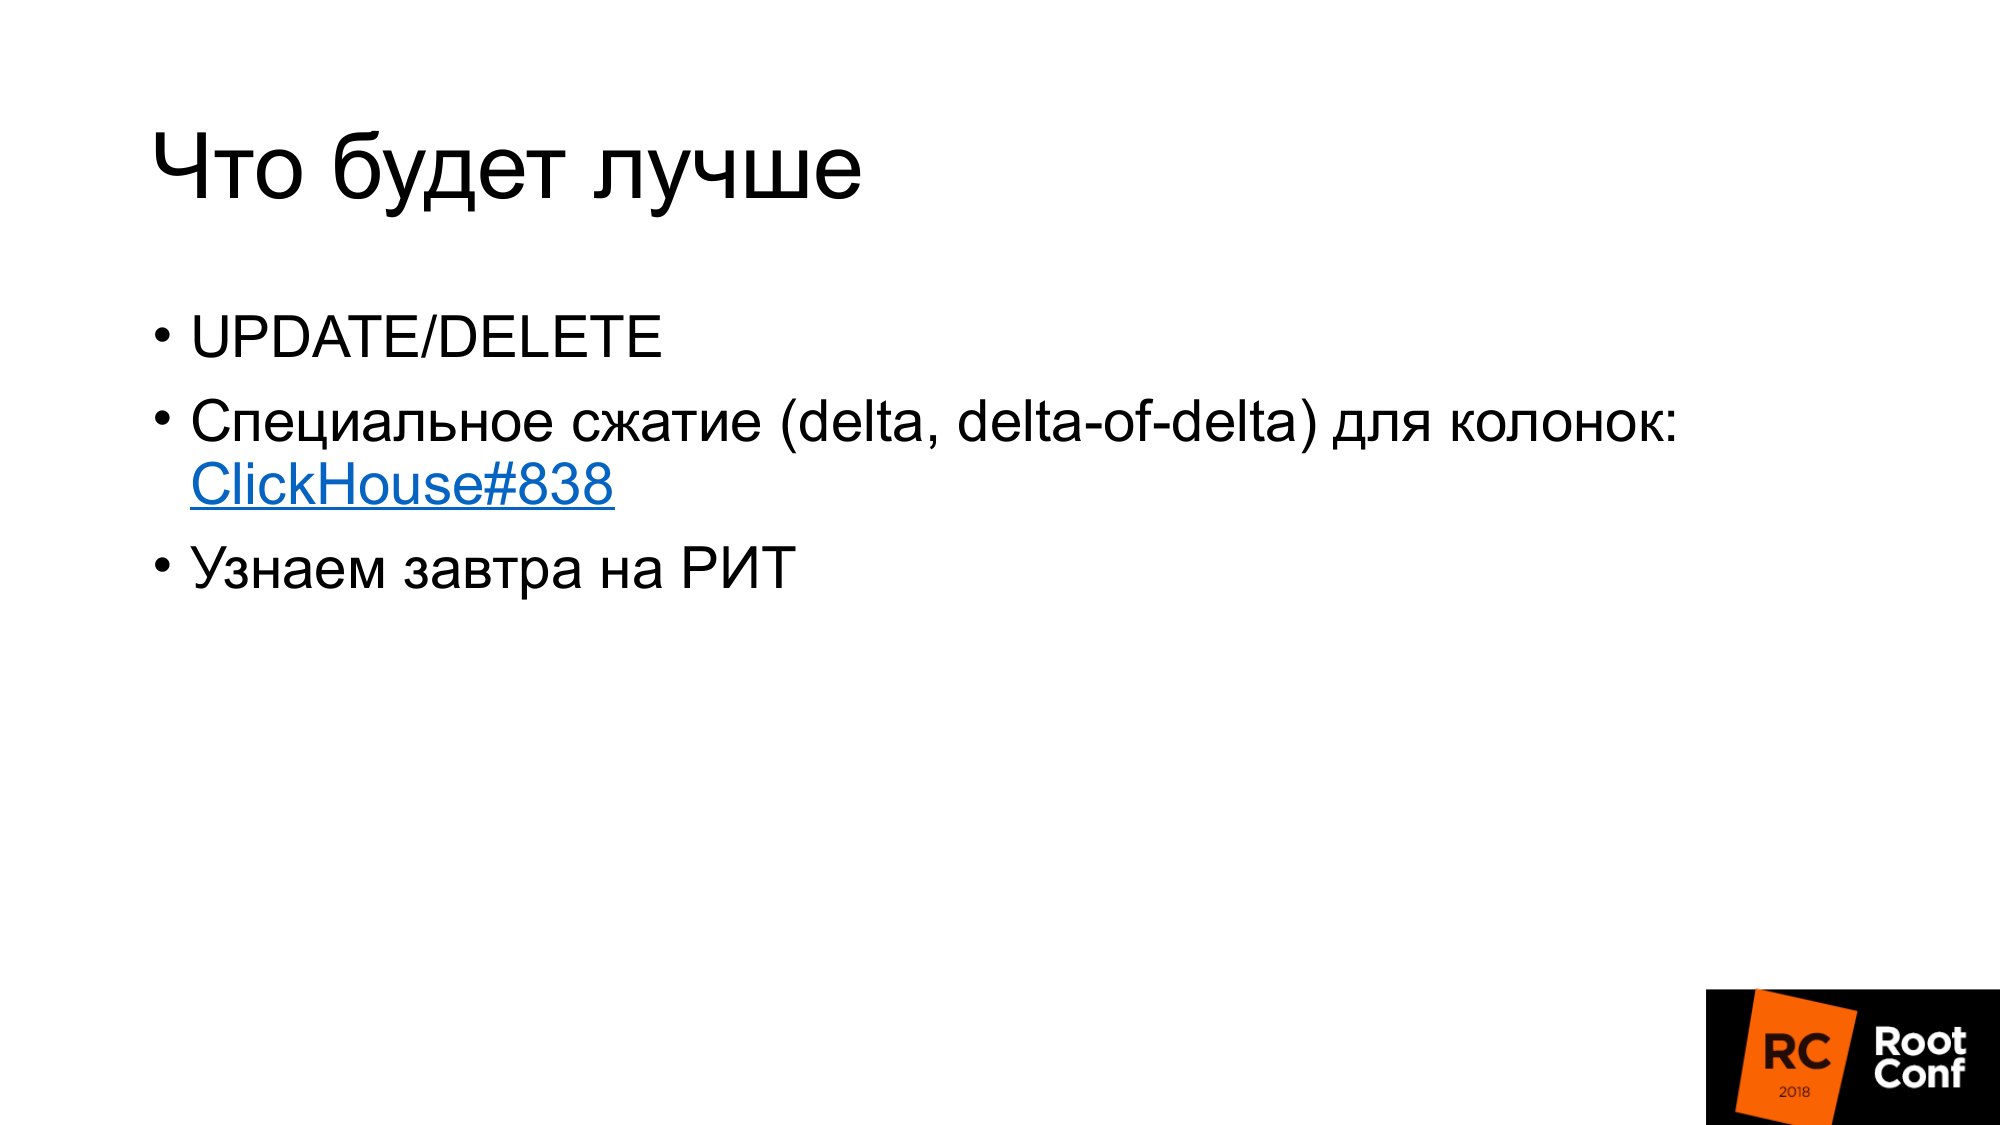
ClickHouse will update / delete. Delete already the first version of the merged. If update / delete will work, then our data downsampling scheme can be simplified.
Secondly, in ClickHouse there is a task to make custom compression (delta, delta to delta). This is what TSDB does. This is well suited for time series data. This is especially useful if we are able to choose the type of compression depending on the data types. For example, counter, which only grows - delta-delta compression is suitable for this. Gauge, which hovers around the magnitude, so the delta works well.
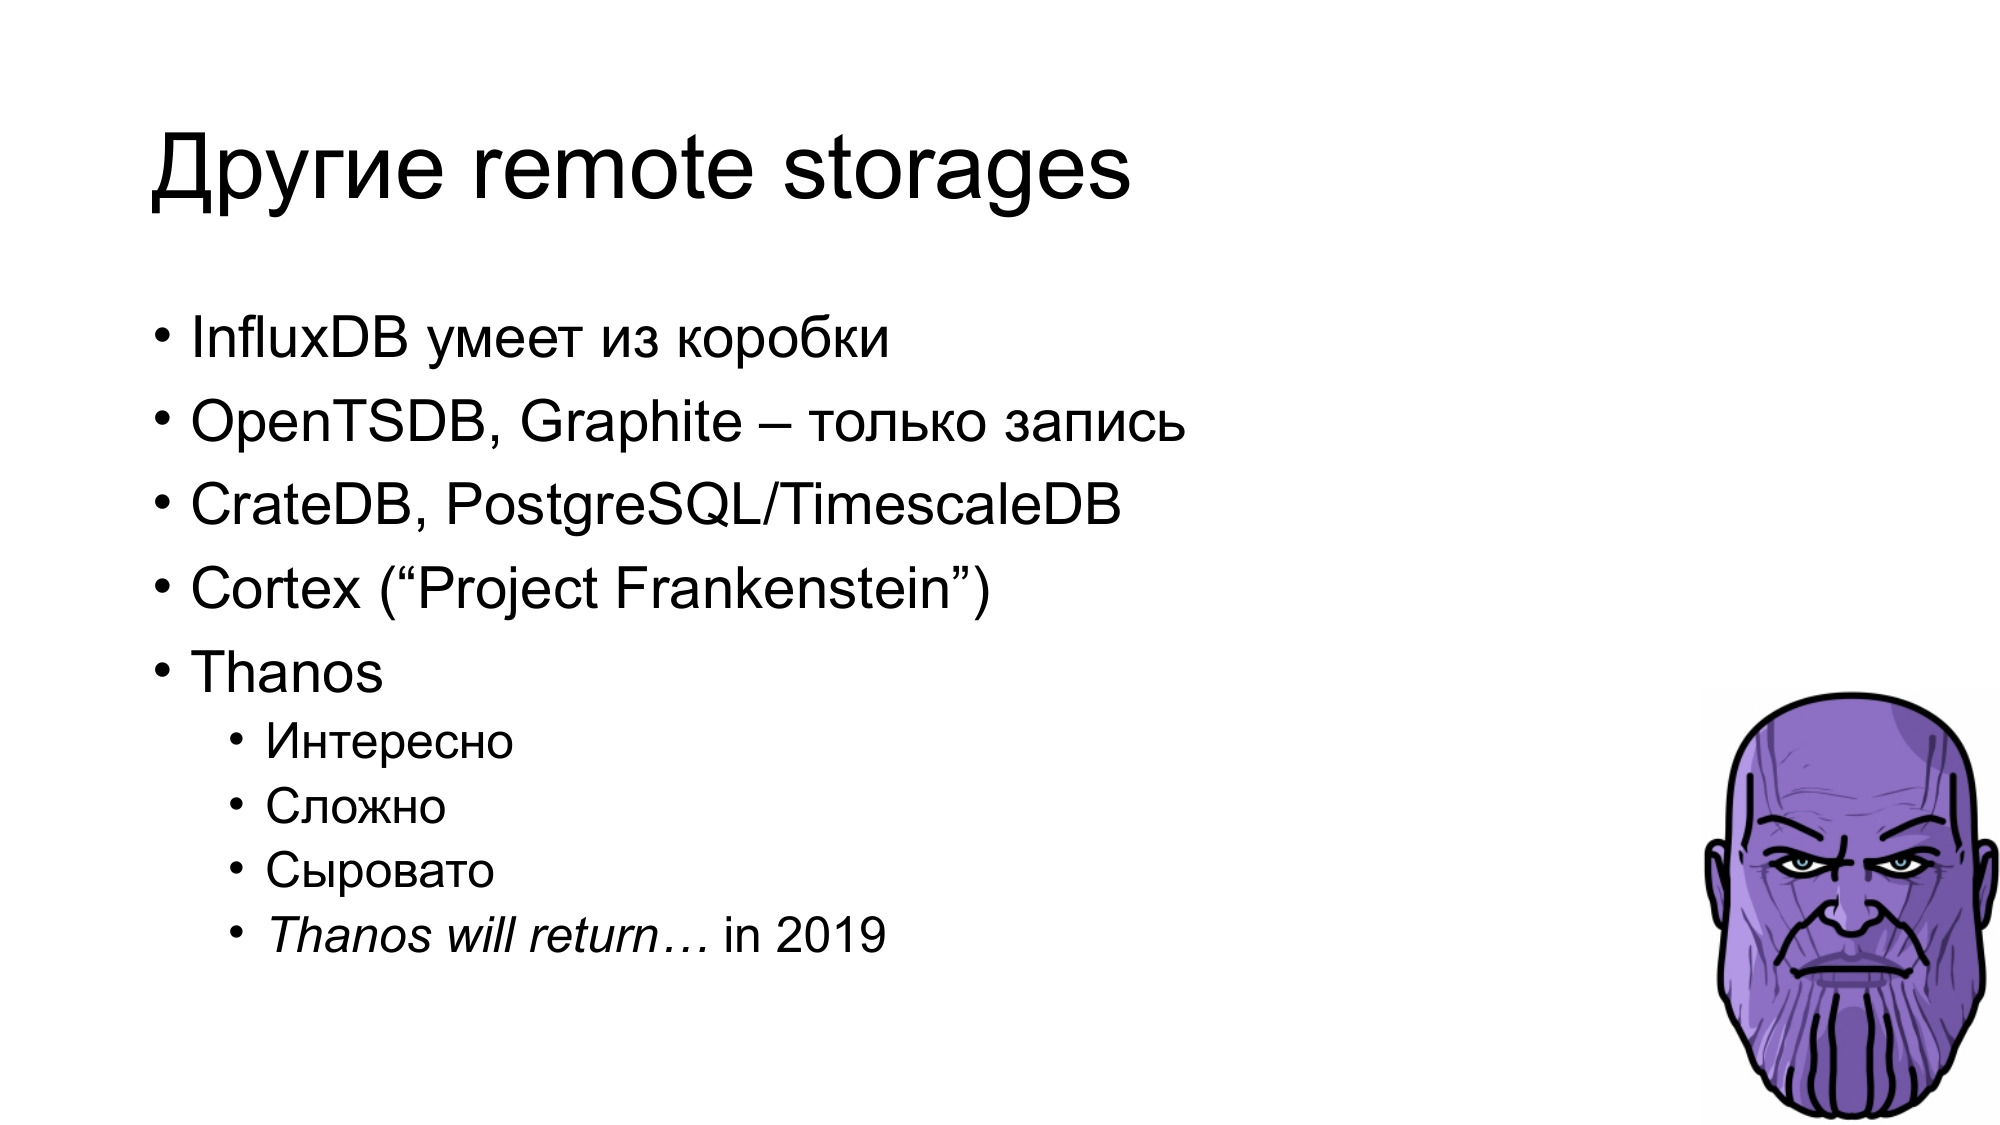
There are other storage that work. There is InfluxDB that works out of the box. It is usually blamed for speed, but what works out of the box and you do not need to do anything is good.
There is OpenTSDB and Graphite, which is write-only. The standard adapter from Prometheus doesn't really work.
There is CrateDB. There is a TimescaleDB that fork PostgreSQL for time series databases. They say it works well, but we ourselves did not try.
There is Cortex, which was also known as the Frankenstein project. It describes him very well. This guys are trying to make a decision based on the federation of Prometheus. They store data in S3.
There are thanos.
- He has a very interesting architecture. There is Prometheus, which uses local TSDB. A cluster is created between them. Next to each Prometheus, a special side-car is put, which accepts requests via remote read and remote write API. He redirects these requests to Prometheus. Prometheus can use its remote read and remote write API. All side-car interconnected and between the custom API wizard via gRPC, replication is available, there is oversharding.
- Complex architecture.
- It is rather damp. A couple of months ago, it was falling apart from a half-kick when it started.
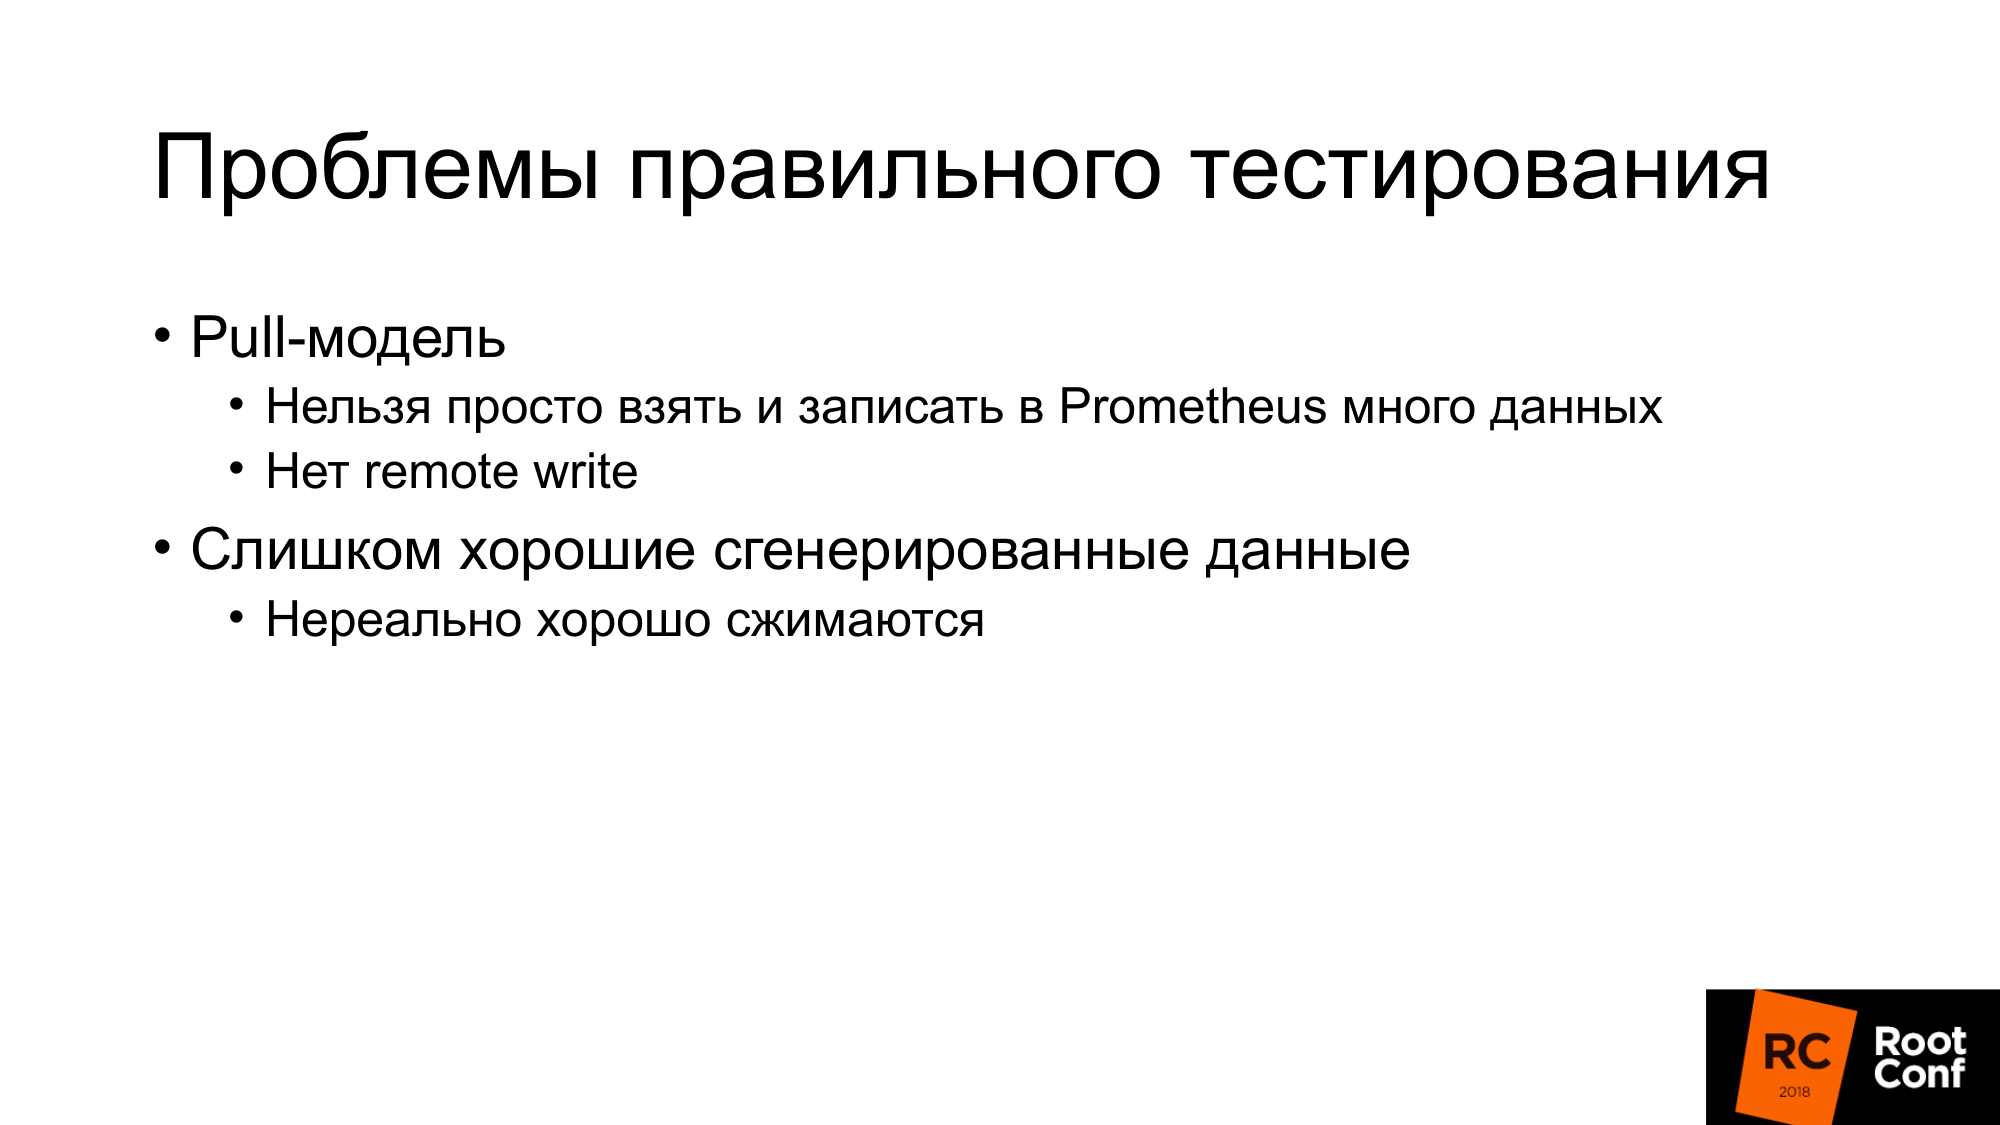
Using the pull model, a lot of data is not recorded. It is necessary to wait a whole year to fill in annual data. We are trying to somehow write them there.
There is no remote write in Prometheus, therefore, a lot of data cannot be written to the local TSDB.
The second problem. If we generate data for load testing, they often press well. For example, if we take existing data and generate 100 instances, and this is the same data, then the compression ratio there will be so great that it doesn't happen in reality.
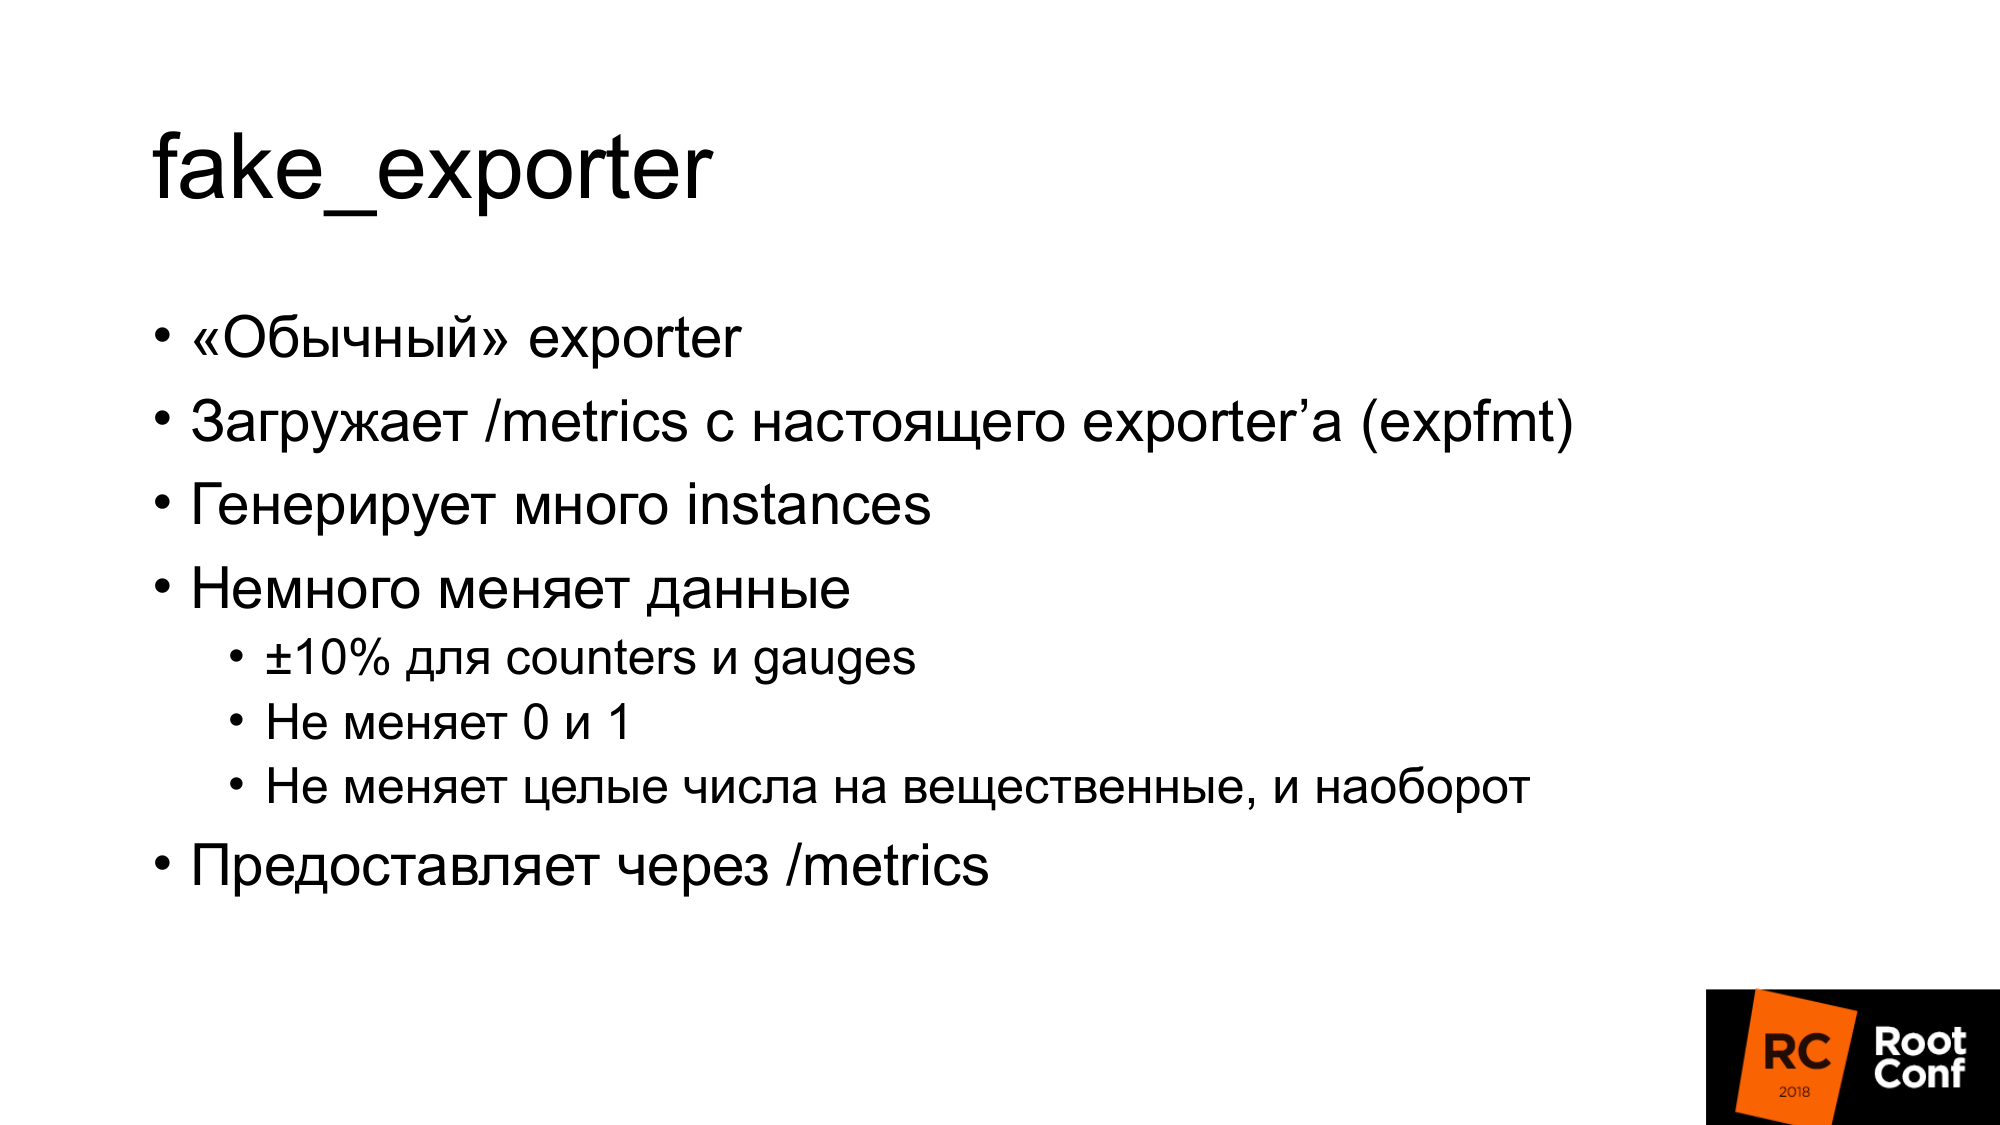
We wrote a fake exporter that looks like a regular exporter that Prometheus can hold together:
- When a scrap arrives, he goes to some Upstream exporter. Takes data from it.
- Generates many instances. Suppose scraper 1, and the output is 100.
- Slightly changes data: plus minus 10% for counter and gauge.
- It does not change the simple values of 0 or 1. Because if there is a UP metric, which responds it shows whether the service is running: yes - 1 or not - 0. And it is not very clear what 098 UP means.
- We do not change integers to real numbers and vice versa.
- It simply gives the data in the usual expfmt format.
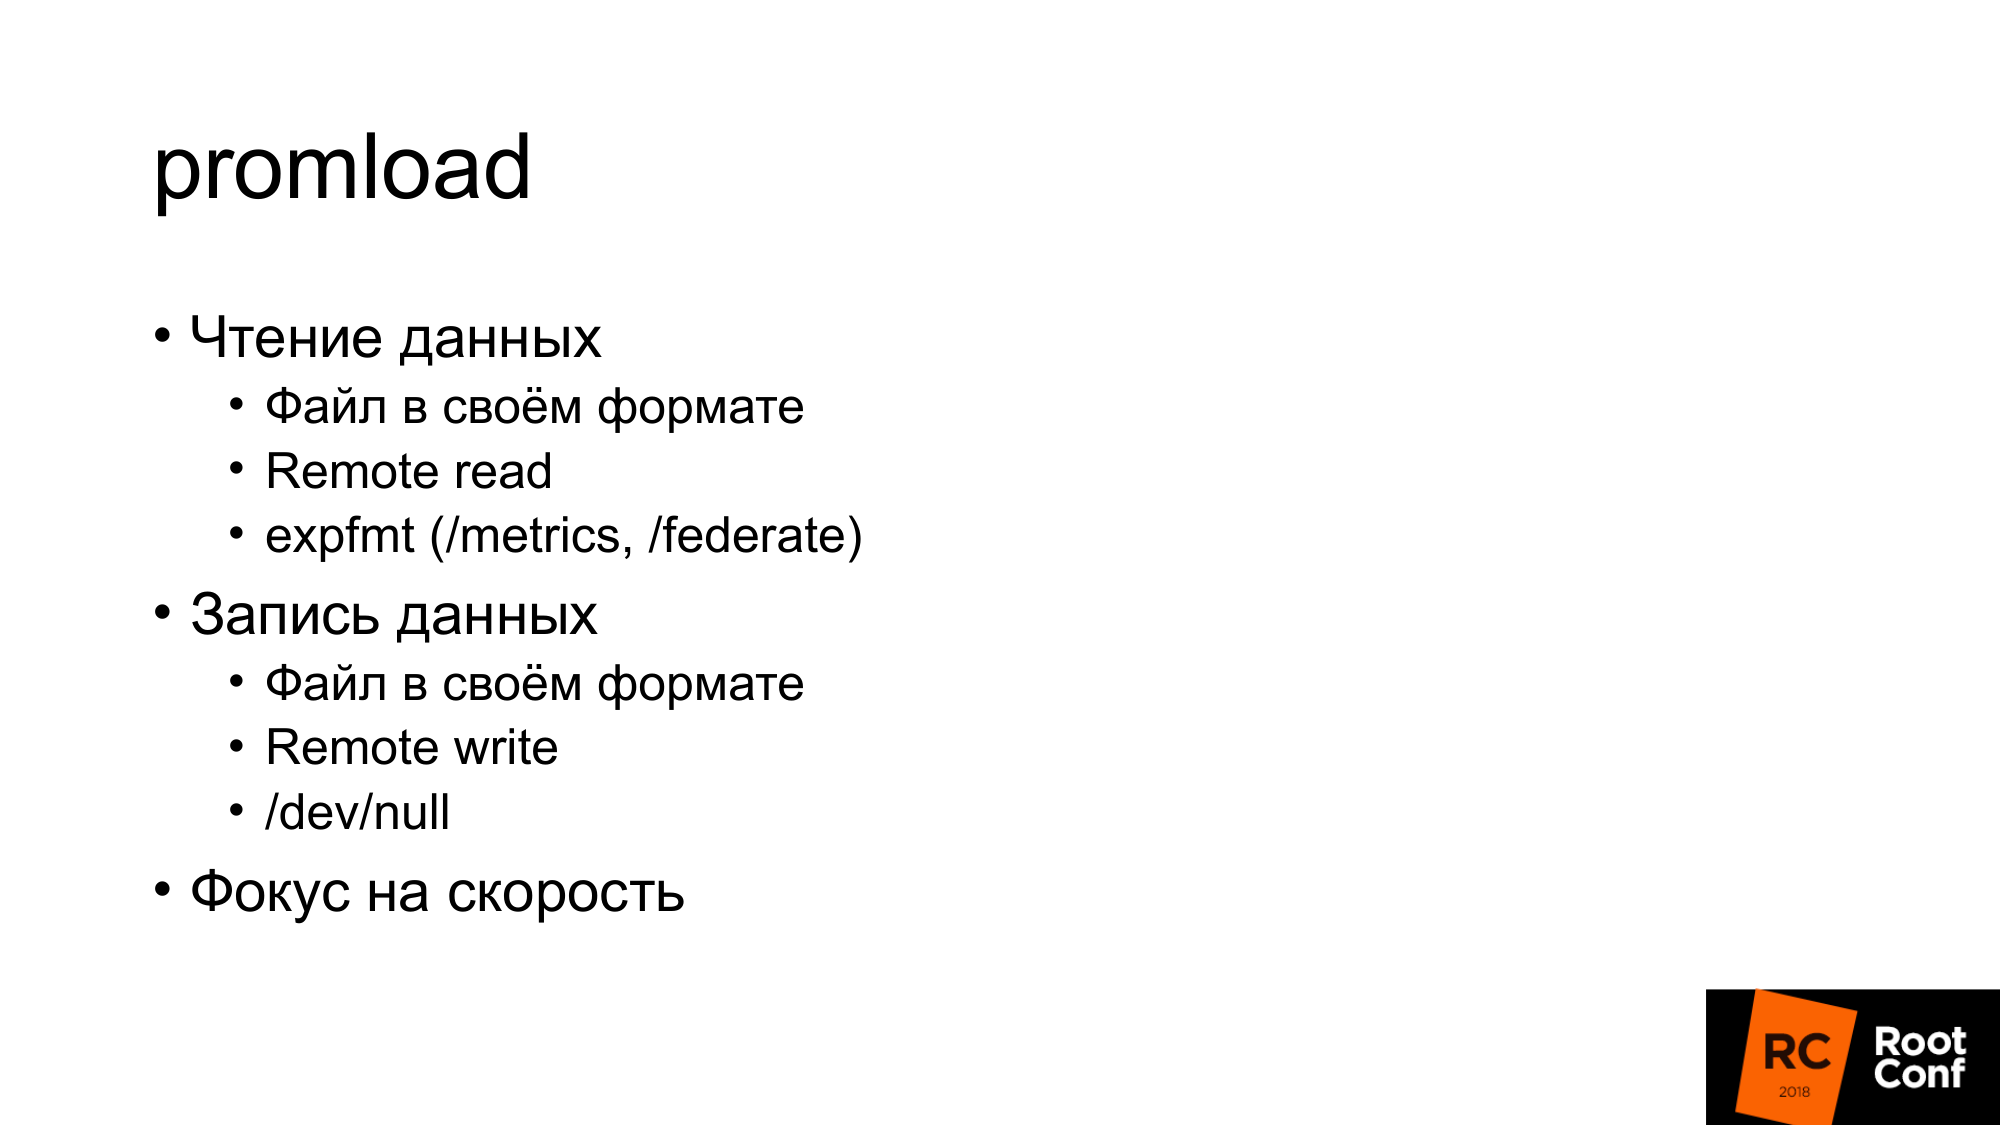
A promload tool that loads data. Reading data:
- Can read from files in its own format.
- Maybe from remote read
- Maybe from some exporter to read
Writes in different formats. Including in / dev / null, if we want to test exactly how reading works quickly.
Now it is a load testing tool not only for PromHouse, but also for any solution that uses remote read or Prometheus.
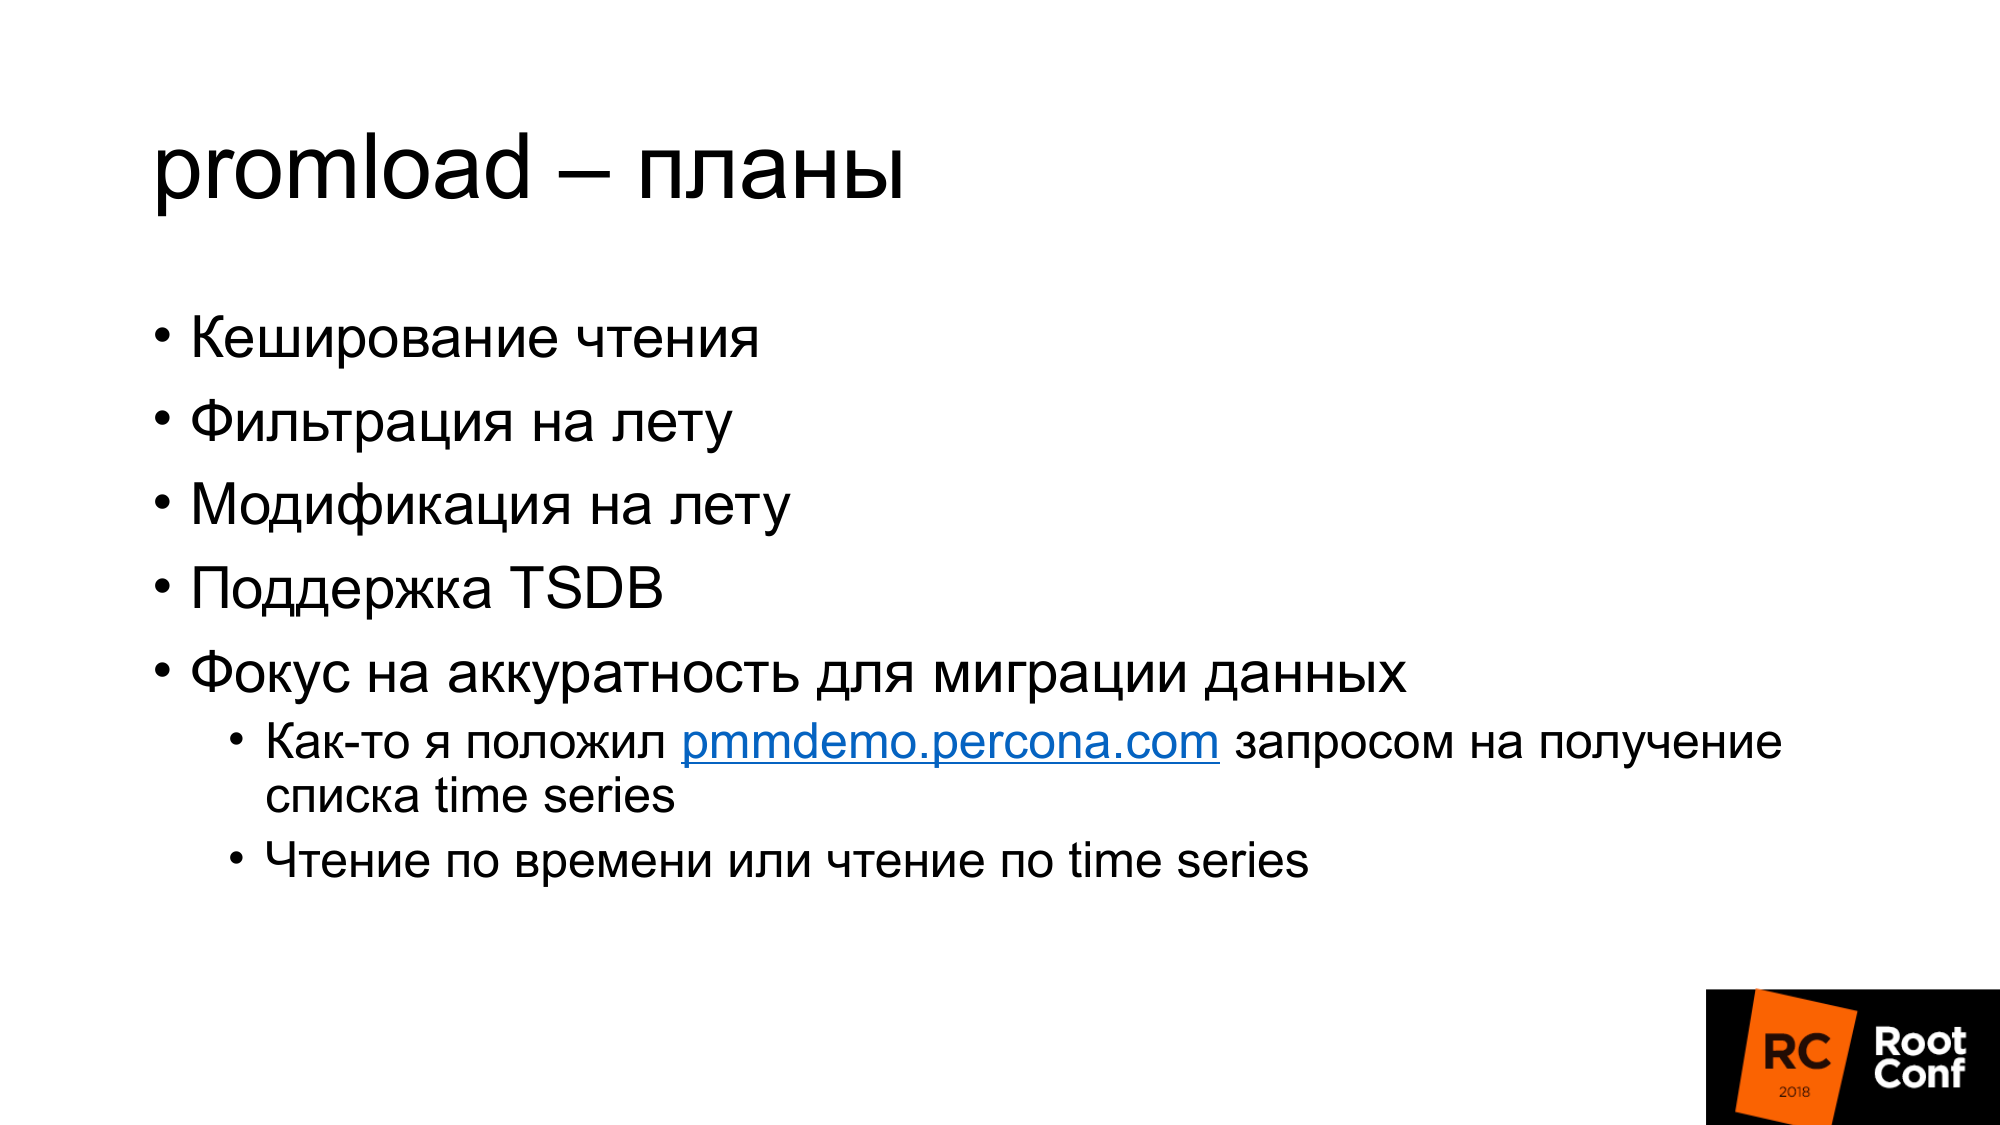
We want to add caching reads, because in our tests often the fake exporter that generated data for a long time was the bottleneck. We could cache them. Let them be unreal good. But we will not slow down. We did not have to wait days for load testing.
Some sort of filtering on the fly, some kind of modification on the fly.
Native TSDB support. In order to work with the database on disk, and not through the API.
Focus on accuracy for migration. I once pmmdemo.percona.com put: connected, got all the metrics. If you do it in the native way, Prometheus opens the TSDB, raises the entire time series from the disk, raises the indexes, then climbs into the chunk files, realizes that they really are. At this point, everything can just lie down.
The naive approach is to take all the time series and read from old data to new ones. At that moment he will fall. You need to do the opposite. You must first get a list of time series with multiple queries with regular expressions. For example, time series, which begin on A. Then give me a time series, which begin on B. Then load them by metrics, and not by time. This is illogical, but it works that way. This is a nuance if you do something like this. If you see that OOM Killer happened there, then you will know that this is because of you.
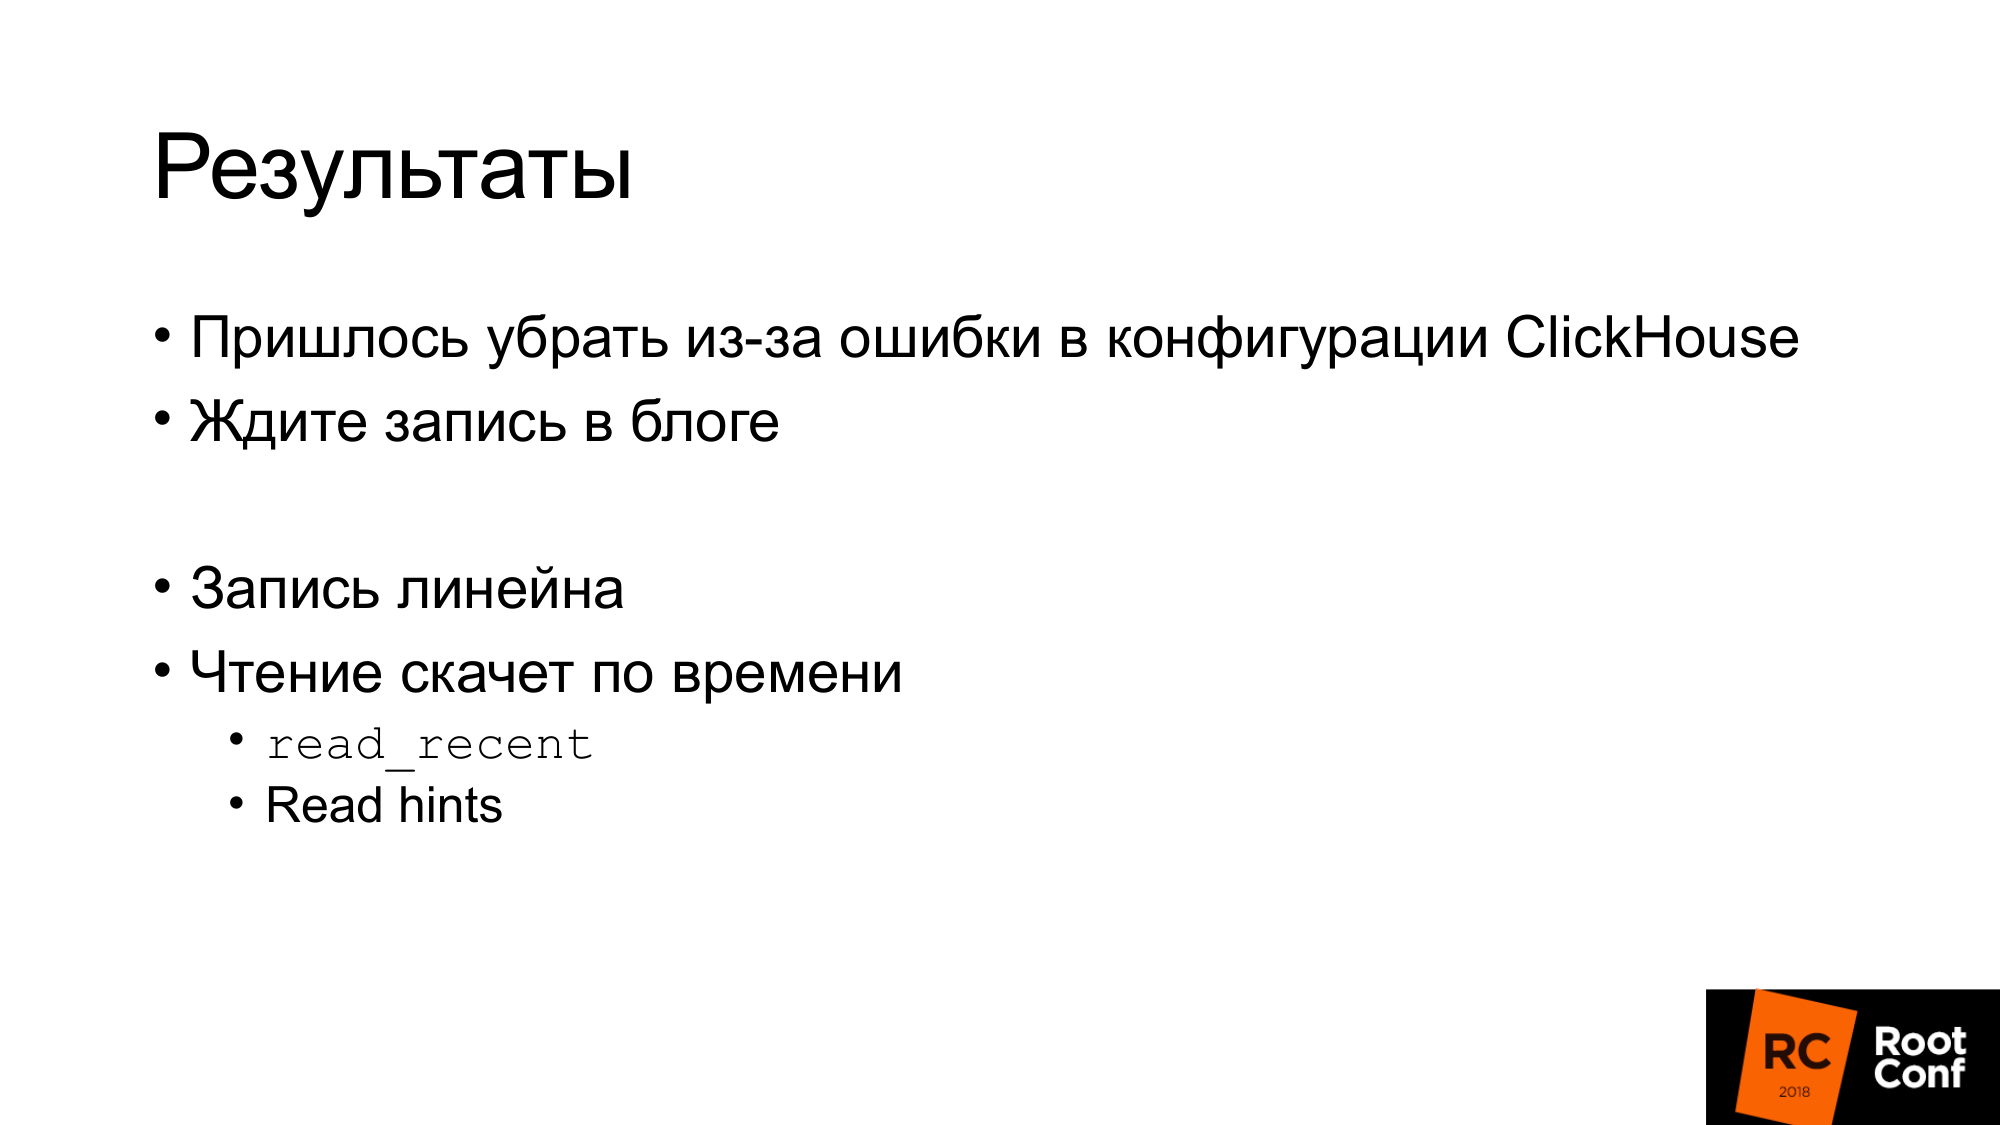
The results of load testing schedules will not. Load testing takes a lot of time and, unfortunately, due to a configuration error, everything has failed. Therefore, the results did not work out.
In the Percona blog, we will write when we do load testing.
I can say the results without graphs. Record was linear. Reading jumped and it was not very fast. It is not very important for us to read current data. They can be accelerated through read hints. You can enable read_recent to improve reading. And for old data it works fine.
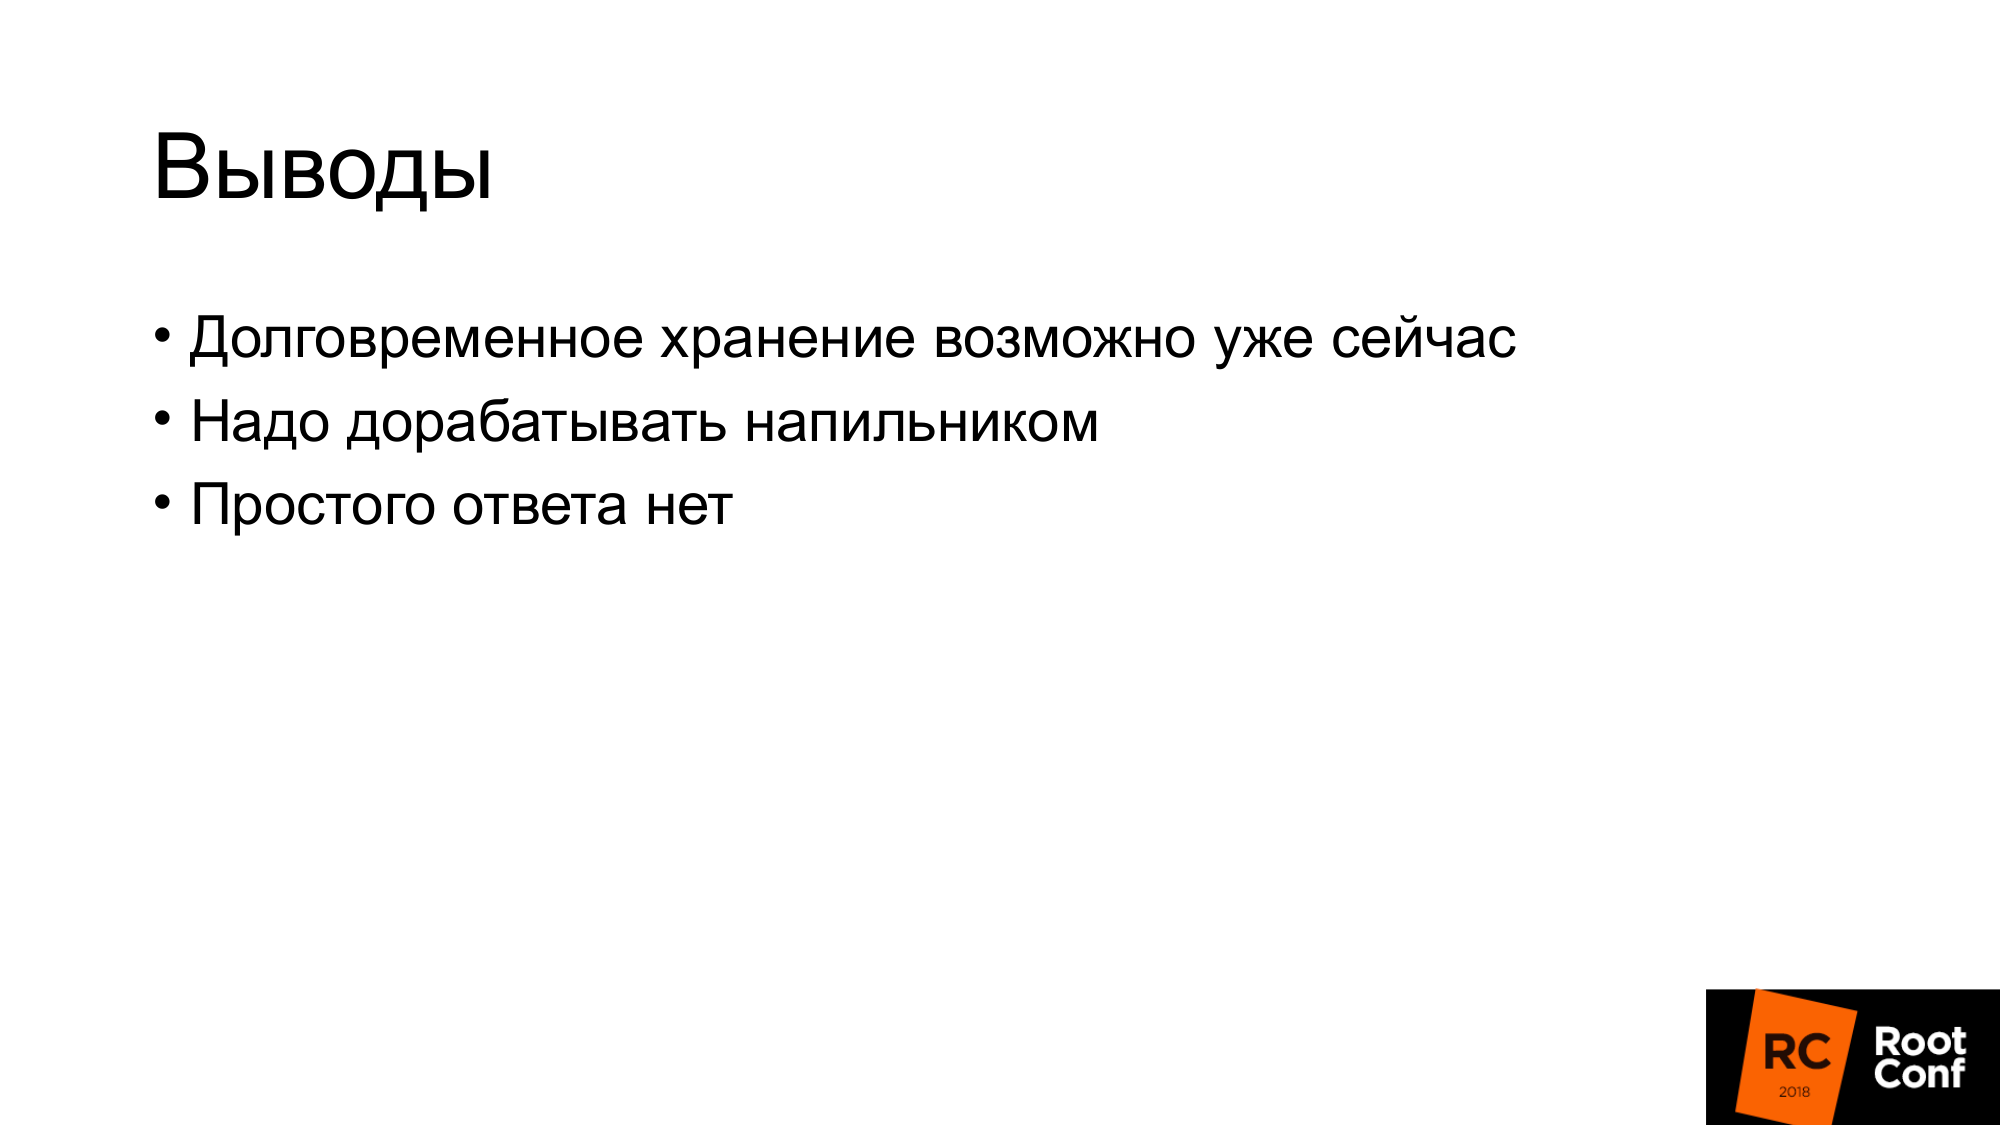
People want long-term storage. There is such a demand. We did a report about PromHouse at PromCon. There it was a very hot topic. Thanos is actively developing.
It is already possible now. There is for this solution. There is an API. There are some integration. But all this needs to be modified with a file. No production ready solutions.
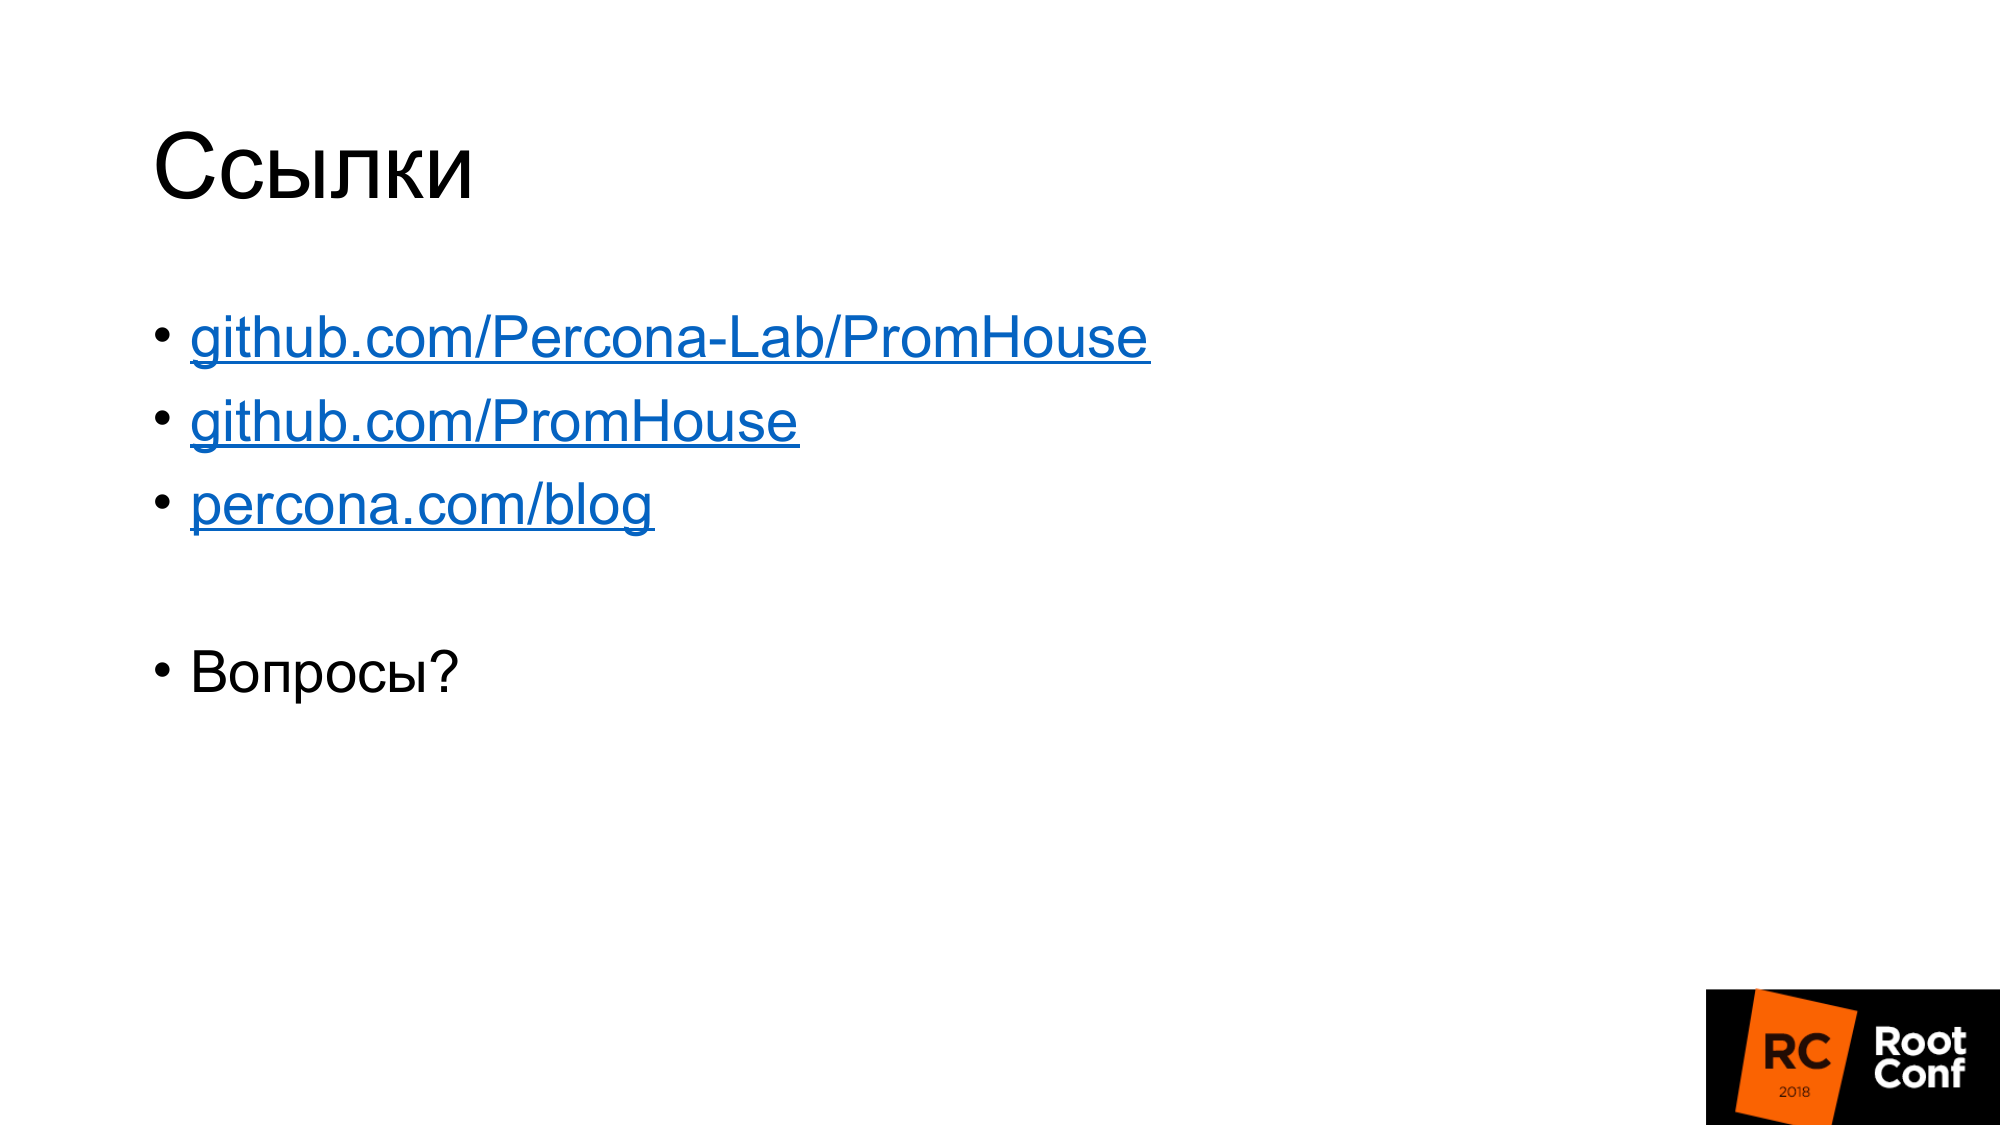
Links where to look. The first link is the PromHouse repository. The second link is where he is most likely to move. Now in the same repository a few different things? not very closely related. Therefore it will be necessary to transfer them.
In our blog will be information about the performance and some news.
Questions:
Question: Did you check the rumors about InfluxDB?
Answer: He was not very good. He became much better. All these stories about the fact that InfluxDB is slow, falling apart - they are about the old version. The current version is stable. I would not say? that it works fast. But it works stably. Advantages of InfluxDB in my opinion:
- Firstly, you don’t need to do something nearby, because InfluxDB works out of the box.
- Secondly, in ClickHouse, as in other database-based solutions, but not in TSDB, you can use a query language that you are more familiar with. The query language InfluxDB is similar to SQL. On it you can do analytics, which is difficult to do in PromQL. If you use TimeScaleDB, there is real SQL.
Question: Does the GraphiteMergeTree engine only get to write? If we want to show graphs, does Grafana need to be configured on Graphite to show long-term storage?
Answer: Yes. Integration, which is in Prometheus itself, works only on writing. He only writes data. So from Grafana you go to Graphite.
Question: And he loses labels when writing?
Answer: There is a configuration that says what to do with them, how to insert them, where to insert them.
Information from the audience: Avito told me that they were writing their decision for recordings from Prometheus in Graphite.
Question: there was a conclusion that everything was good with the record to the long-term storage server.
There is a stream of a million metrics (5-minute or 15-minute). raid 6 sata ?
: PMM — . downsampling c 14 1 . , . . . .
: IOPS ?
: .
:
: . , . , , .
: InfluxDB, InfluxDB?
: read_recent. , remote storage. InfluxDB . . read_recent , .
: , Prometheus. InfluxDB. Grafana Prometheus. Prometheus PromQL , InfluxDB?
: .
: Prometheus InfluxDB Grafana?
: . Prometheus 2.2 , .
')
Source: https://habr.com/ru/post/441136/
All Articles