Testing Node.js projects. Part 2. Evaluation of the effectiveness of tests, continuous integration and analysis of code quality
→ Testing Node.js projects. Part 1. Anatomy of tests and types of tests
Today, in the second part of the translation of material devoted to testing Node.js projects, we will talk about evaluating the effectiveness of tests and about code quality analysis.
The purpose of testing is to make sure that the programmer has already done so that the programmer can continue productive work on the project. Obviously, the larger the volume of the verified code, the stronger the confidence that everything works as it should. The test code coverage indicator indicates how many lines (branches, commands) have been tested. What should this indicator be? It is clear that 10-30% is too little to give confidence that the project will work without errors. On the other hand, the desire for 100% coverage of the code with tests may be too expensive and can distract the developer from the most important fragments of the program, causing him to look in the code for places to which existing tests do not reach. If you give a more complete answer to the question of what should be the coverage of the code with tests, then we can say that the indicator you should strive for depends on the application being developed. For example, if you are busy writing software for the next generation Airbus A380 aircraft, then 100% is an indicator that is not even discussed. But if you create a website where caricature galleries will be displayed, then probably 50% is already a lot. Although testing experts say that the level of code coverage with tests that you should strive for depends on the project, many of them mention the figure of 80%, which is probably suitable for most applications. For example, here we are talking about something in the region of 80-90%, and, according to the author of this material, 100% coverage of the code with tests causes him suspicion, since it may indicate that the programmer writes tests only in order to get The report is a beautiful number.
')
In order to use the indicators of code coverage tests, you will need to properly configure your continuous integration system (CI, Continuous Integration). This will allow, if the corresponding indicator does not reach a certain threshold, to stop the assembly of the project. Here is information about setting up a Jest to collect information about test coverage. In addition, it is possible to configure coverage thresholds not for the entire code, but by focusing on individual components. In addition to this, consider the possibility of detecting a decrease in code coverage by tests. This happens, for example, when a new code is added to a project. Monitoring this indicator will encourage developers to increase the amount of tested code, or at least to keep this volume at the existing level. Considering the above, code coverage with tests is just one indicator, quantified, which is not enough to fully evaluate the reliability of tests. In addition, as will be shown below, its high levels still do not indicate that the “test-covered” code is actually verified.
The programmer's confidence in the high quality of the code and the corresponding indicators related to testing go hand in hand. The programmer can not be afraid of errors in the event that he does not know that most of the code of his project is covered with tests. These concerns can slow down the work on the project.
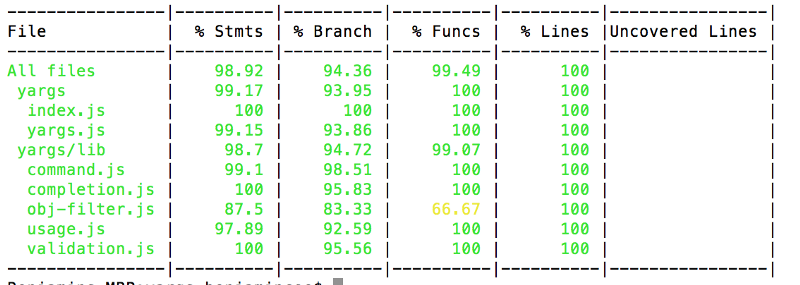
Here’s what a typical test coverage report looks like.
Report on code coverage tests, formed by means of Istanbul
Here is an example of setting the desired level of coverage with the component code tests and the overall level of this indicator in Jest.

Setting the desired level of code coverage tests for the entire project and for a specific component
Some problems tend to skip through a variety of error detection systems. Such things can be difficult to detect using traditional tools. Perhaps this does not apply to these errors. Rather, we are talking about the unexpected behavior of the application, which can have devastating consequences. For example, it often happens that some code fragments are either never used or are extremely rarely called. For example, you think that the
If you don’t know which parts of your code remain untested, then you don’t know where to expect problems.
Look at the following report and think about what looks unusual in it.

Report indicating unusual system behavior
The report is based on the real usage scenarios of the application and allows you to see the unusual behavior of the program associated with the user logon. Namely, an unexpectedly large number of unsuccessful attempts to enter the system in comparison with successful ones is evident. After analyzing the project, it turned out that the reason for this was an error in the frontend, due to which the interface part of the project constantly sent corresponding requests to the server API for logging into the system.
Traditional indicators of code coverage tests may be unreliable. So, in the report there may be a figure of 100%, but at the same time absolutely all the functions of the project will return incorrect values. How to explain this? The point is that the test code coverage indicator only indicates which lines of code were executed under the control of the testing system, but it does not depend on whether something was really tested, that is, on whether the test was approved aimed at verifying the correctness of the results of the code. This is reminiscent of a man who, returning from a trip abroad, demonstrates stamps in his passport. The stamps prove that he has been somewhere, but they don’t say anything about whether he did what he went on a business trip for.
Here mutation tests can help us, which allow us to find out how much code has been actually tested, and not just visited by the testing system. For mutation testing, you can use the Stryker JS library. Here are the principles for how it works:
If it turns out that all the “mutants” were “killed” (or, at least, most of them did not survive), this gives a higher level of confidence in the high quality of the code and the tests that test it than the traditional metrics of code coverage of the tests. At the same time, the time required for setting up and conducting mutational testing is comparable to that needed when using conventional tests.
If the traditional indicator of code coverage by tests indicates that tests cover 85% of the code, this does not mean that the tests are able to detect errors in this code.
Here is an example of a 100% code coverage test, in which the code is completely untested.
Here is a mutation test report generated by the Stryker library. It allows you to know how much code is untested (this is indicated by the number of "surviving" "mutants").
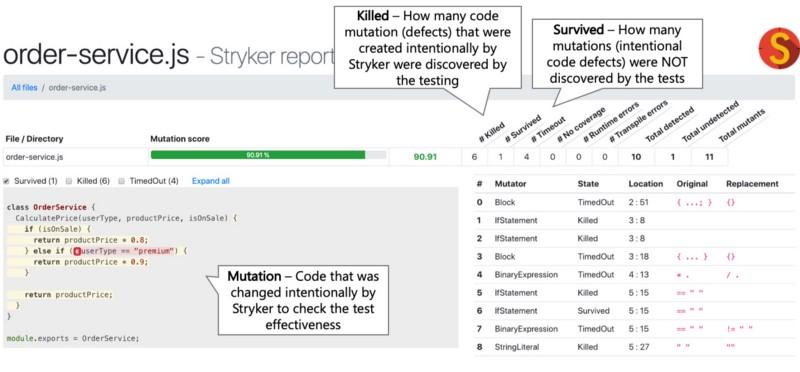
Stryker Report
The results of this report allow us, with more confidence than the usual indicators of code coverage of tests, to say that tests work as expected.
These days, linters are powerful tools that can detect serious code problems. It is recommended, in addition to some basic rules of linting (such as those implemented by the eslint-plugin-standard and eslint-config-airbnb plug-ins ), to use specialized rules. For example, these are the rules implemented by the eslint-plugin-chai-expect plugin tools for checking the correctness of test code, these are rules from the eslint-plugin-promise plugin that control work with promises, these are rules from eslint-plugin-security that check the code for It has dangerous regular expressions. You can also mention the eslint-plugin-you-dont-need-lodash-underscore plugin , which allows you to find in the code cases of using methods from external libraries that have analogues in pure JavaScript.
It is a black day, the project gives constant failures in production, and the logs do not contain information about the error stacks. What happened? As it turned out, the fact that the code throws out as an exception is in fact not the object of an error. As a result, the stack information does not fall into the logs. As a matter of fact, in such a situation a programmer can either be killed against the wall, or, which is much better, spend 5 minutes setting up the linter, which will easily detect the problem and insure the project against similar troubles that may arise in the future.
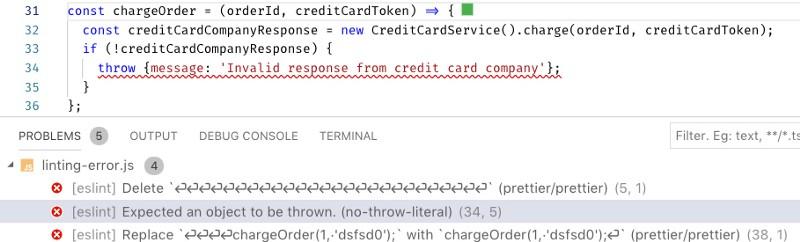
Here is the code that, by mistake, throws an ordinary object as an exception, while an
ESLint helps to find an error in the code
Are you using a centralized continuous integration system that helps control the quality of the code, testing it, applying a linter, testing it for vulnerabilities? If so, make it so that developers can run this system locally. This will allow them to instantly check their code, which speeds up feedback and reduces project development time. Why is this so? An effective development and testing process involves many cyclically repetitive operations. The code is tested, then the developer receives a report, then, if necessary, the code is refactored, after which everything repeats. The faster the feedback loop works, the faster the developers get reports on code testing, the more iterations they can perform to improve this code. If a test report takes a lot of time, it can lead to a deterioration in the quality of the code. Let's say someone worked on a module, then started working on something else, then got a report on the module, which indicates that the module needs to be improved. However, the developer is already busy with completely different things, the developer will not pay enough attention to the problem module.
Some CI solution providers (say, CircleCI ) allow you to run the CI pipeline locally. Some paid tools, like Wallaby.js (the author notes that he is not associated with this project), allow you to quickly obtain valuable information about the quality of the code. In addition, the developer can simply add the corresponding npm script to
If the developer receives a report on the quality of the code a day after writing this code, such a report is likely to turn into something like a formal document, and the tests of the code will be divorced from work, not becoming its natural part.
Here is the npm script that performs the code quality check. The execution of checks is parallelized. The script is executed when trying to send a new code to the repository. In addition, the developer can run it on his own initiative.
In the vast ecosystem of Kubernetes, there is still a consensus on the use of tools suitable for the deployment of local environments, although such tools appear quite often. Here one of the possible approaches is to launch “minimized” Kubernetes using tools like Minikube or MicroK8s , which allow you to create lightweight environments that resemble real ones. Another approach is testing projects in a remote “real” Kubernetes environment. Some CI providers (like Codefresh ) allow interaction with the embedded Kubernetes environments, which simplifies the work of the CI pipelines when testing real projects. Others allow you to work with remote Kubernetes environments.
The use of various technologies in production and testing requires the support of two development models and leads to the separation of teams of programmers and DevOps specialists.
Here is an example of a CI chain, which, as they say, on the fly, creates a Kubernetes cluster (this is taken from here ).
If the testing system is well organized, it will become your faithful friend, round the clock ready to report problems with the code. For this, tests must be performed very quickly. In practice, it turns out that the execution of 500 unit tests intensively using a processor in a single-threaded mode takes too much time. And such tests need to be done quite often. Fortunately, modern tools for running tests ( Jest , AVA , an extension for Mocha ) and CI-platform can perform tests in parallel using several processes, which can significantly improve the speed of receiving test reports. Some CI platforms even know how to parallelize tests between containers, which further improves the feedback loop. To successfully parallelize the execution of tests, local or remote, tests should not depend on each other. Stand-alone tests can easily run in different processes.
Obtaining test results an hour after sending the code to the repository, while working on new project features, is a great way to reduce the usefulness of test results.
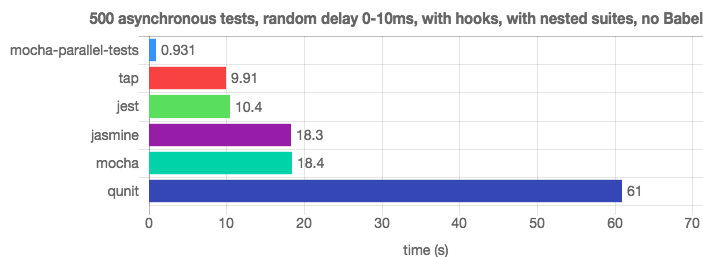
Thanks to the parallel execution of tests, the mocha-parallel-test library and the Jest framework easily bypass Mocha ( this is the source of this information).
Test run performance test
Perhaps now you are not particularly concerned about the problems with the law and with plagiarism. But why not check your project for similar problems? There are many means for organizing such checks. For example, it is license-checker and plagiarism-checker (this is a commercial package, but it can be used for free). Such checks are easy to build into the CI pipeline and check the project, for example, for dependencies with limited licenses, or for the code copied from StackOverflow, and probably violating someone's copyright.
The developer, quite unintentionally, can use the package with an inappropriate license for his project, or copy the commercial code, which can lead to legal problems.
Install the license-checker package locally or in a CI environment:
We will verify licenses with it, and if he finds what does not suit us, we recognize the check as unsuccessful. CI-system, finding that something went wrong while checking licenses, will stop the project build.
License check
Even highly respected and reliable packages, such as Express, have vulnerabilities. In order to identify such vulnerabilities, you can use special tools - such as the standard tool for auditing npm-packages or the commercial project snyk , which has a free version. These checks, along with others, can be made part of the CI pipeline.
In order to protect your project from the vulnerabilities of its dependencies without the use of special tools, you will have to constantly monitor publications about such vulnerabilities. This is a very time consuming task.
Here are the results of project verification using NPM Audit.

Package Inspection Report for Vulnerabilities
The road to hell is paved with good intentions. This idea is perfectly applicable to the
, , , .
ncu , , , .

ncu
, Node.js-, , Node.js .
, , .
, . , , , Node.js , . CI-, , « ». , , , . , , mySQL, — Postgres. , Node.js, — 8, 9 10. , . CI-.
, , , . , , .
CI- Travis Node.js.
, , . , , .
Dear readers! ?

Today, in the second part of the translation of material devoted to testing Node.js projects, we will talk about evaluating the effectiveness of tests and about code quality analysis.
Section 3. Evaluation of the effectiveness of tests
▍19. Achieve a sufficiently high level of code coverage tests in order to gain confidence in its proper operation. Usually good results are given by approximately 80% coverage.
Recommendations
The purpose of testing is to make sure that the programmer has already done so that the programmer can continue productive work on the project. Obviously, the larger the volume of the verified code, the stronger the confidence that everything works as it should. The test code coverage indicator indicates how many lines (branches, commands) have been tested. What should this indicator be? It is clear that 10-30% is too little to give confidence that the project will work without errors. On the other hand, the desire for 100% coverage of the code with tests may be too expensive and can distract the developer from the most important fragments of the program, causing him to look in the code for places to which existing tests do not reach. If you give a more complete answer to the question of what should be the coverage of the code with tests, then we can say that the indicator you should strive for depends on the application being developed. For example, if you are busy writing software for the next generation Airbus A380 aircraft, then 100% is an indicator that is not even discussed. But if you create a website where caricature galleries will be displayed, then probably 50% is already a lot. Although testing experts say that the level of code coverage with tests that you should strive for depends on the project, many of them mention the figure of 80%, which is probably suitable for most applications. For example, here we are talking about something in the region of 80-90%, and, according to the author of this material, 100% coverage of the code with tests causes him suspicion, since it may indicate that the programmer writes tests only in order to get The report is a beautiful number.
')
In order to use the indicators of code coverage tests, you will need to properly configure your continuous integration system (CI, Continuous Integration). This will allow, if the corresponding indicator does not reach a certain threshold, to stop the assembly of the project. Here is information about setting up a Jest to collect information about test coverage. In addition, it is possible to configure coverage thresholds not for the entire code, but by focusing on individual components. In addition to this, consider the possibility of detecting a decrease in code coverage by tests. This happens, for example, when a new code is added to a project. Monitoring this indicator will encourage developers to increase the amount of tested code, or at least to keep this volume at the existing level. Considering the above, code coverage with tests is just one indicator, quantified, which is not enough to fully evaluate the reliability of tests. In addition, as will be shown below, its high levels still do not indicate that the “test-covered” code is actually verified.
Implications of derogation
The programmer's confidence in the high quality of the code and the corresponding indicators related to testing go hand in hand. The programmer can not be afraid of errors in the event that he does not know that most of the code of his project is covered with tests. These concerns can slow down the work on the project.
Example
Here’s what a typical test coverage report looks like.
Report on code coverage tests, formed by means of Istanbul
The right approach
Here is an example of setting the desired level of coverage with the component code tests and the overall level of this indicator in Jest.
Setting the desired level of code coverage tests for the entire project and for a specific component
▍20. Examine the test code coverage reports for untested code points and other anomalies.
Recommendations
Some problems tend to skip through a variety of error detection systems. Such things can be difficult to detect using traditional tools. Perhaps this does not apply to these errors. Rather, we are talking about the unexpected behavior of the application, which can have devastating consequences. For example, it often happens that some code fragments are either never used or are extremely rarely called. For example, you think that the
PricingCalculator class mechanisms are always used to set the price of a product, but in fact it turns out that this class is not used at all, and there are 10,000 products in the database, and the online store that uses the system has a lot of sales ... Reports on code coverage with tests help the developer understand if an application works the way it thinks it should work. In addition, from the reports you can find out which project code is not being tested. If you focus on the general indicator, which indicates that tests cover 80% of the code, you cannot find out whether critical parts of the application are being tested. In order to generate such a report, it is sufficient to properly configure the tool you use to run the tests. Such reports usually look quite nice, and their analysis, which does not take much time, allows you to detect any surprises.Consequences of derogating from recommendations
If you don’t know which parts of your code remain untested, then you don’t know where to expect problems.
Wrong approach
Look at the following report and think about what looks unusual in it.
Report indicating unusual system behavior
The report is based on the real usage scenarios of the application and allows you to see the unusual behavior of the program associated with the user logon. Namely, an unexpectedly large number of unsuccessful attempts to enter the system in comparison with successful ones is evident. After analyzing the project, it turned out that the reason for this was an error in the frontend, due to which the interface part of the project constantly sent corresponding requests to the server API for logging into the system.
▍21. Measure logical code coverage with tests using mutation testing
Recommendations
Traditional indicators of code coverage tests may be unreliable. So, in the report there may be a figure of 100%, but at the same time absolutely all the functions of the project will return incorrect values. How to explain this? The point is that the test code coverage indicator only indicates which lines of code were executed under the control of the testing system, but it does not depend on whether something was really tested, that is, on whether the test was approved aimed at verifying the correctness of the results of the code. This is reminiscent of a man who, returning from a trip abroad, demonstrates stamps in his passport. The stamps prove that he has been somewhere, but they don’t say anything about whether he did what he went on a business trip for.
Here mutation tests can help us, which allow us to find out how much code has been actually tested, and not just visited by the testing system. For mutation testing, you can use the Stryker JS library. Here are the principles for how it works:
- It intentionally changes the code, creating errors in it. For example, the code
newOrder.price===0turns intonewOrder.price!=0. These “bugs” are called mutations. - She runs tests. If they are passed, then we have problems, because tests do not perform their task of detecting errors, and the "mutants" are said to "survive." If the tests indicate errors in the code, then everything is in order - the “mutants” “die”.
If it turns out that all the “mutants” were “killed” (or, at least, most of them did not survive), this gives a higher level of confidence in the high quality of the code and the tests that test it than the traditional metrics of code coverage of the tests. At the same time, the time required for setting up and conducting mutational testing is comparable to that needed when using conventional tests.
Consequences of derogating from recommendations
If the traditional indicator of code coverage by tests indicates that tests cover 85% of the code, this does not mean that the tests are able to detect errors in this code.
Wrong approach
Here is an example of a 100% code coverage test, in which the code is completely untested.
function addNewOrder(newOrder) { logger.log(`Adding new order ${newOrder}`); DB.save(newOrder); Mailer.sendMail(newOrder.assignee, `A new order was places ${newOrder}`); return {approved: true}; } it("Test addNewOrder, don't use such test names", () => { addNewOrder({asignee: "John@mailer.com",price: 120}); });// 100%, , , The right approach
Here is a mutation test report generated by the Stryker library. It allows you to know how much code is untested (this is indicated by the number of "surviving" "mutants").
Stryker Report
The results of this report allow us, with more confidence than the usual indicators of code coverage of tests, to say that tests work as expected.
- Mutation is a code that was deliberately modified by the Stryker library to test the effectiveness of the test.
- The number of "killed" "mutants" (killed) shows the number of intentionally created code defects ("mutants"), which were detected during testing.
- The number of “survivors” “mutants” (survived) allows you to find out how many code defects the tests did not detect.
Section 4. Continuous Integration, Other Code Quality Indicators
▍22. Use the linter capabilities and interrupt the project build process when it detects a problem they report
Recommendations
These days, linters are powerful tools that can detect serious code problems. It is recommended, in addition to some basic rules of linting (such as those implemented by the eslint-plugin-standard and eslint-config-airbnb plug-ins ), to use specialized rules. For example, these are the rules implemented by the eslint-plugin-chai-expect plugin tools for checking the correctness of test code, these are rules from the eslint-plugin-promise plugin that control work with promises, these are rules from eslint-plugin-security that check the code for It has dangerous regular expressions. You can also mention the eslint-plugin-you-dont-need-lodash-underscore plugin , which allows you to find in the code cases of using methods from external libraries that have analogues in pure JavaScript.
Consequences of derogating from recommendations
It is a black day, the project gives constant failures in production, and the logs do not contain information about the error stacks. What happened? As it turned out, the fact that the code throws out as an exception is in fact not the object of an error. As a result, the stack information does not fall into the logs. As a matter of fact, in such a situation a programmer can either be killed against the wall, or, which is much better, spend 5 minutes setting up the linter, which will easily detect the problem and insure the project against similar troubles that may arise in the future.
Wrong approach
Here is the code that, by mistake, throws an ordinary object as an exception, while an
Error object is needed here. Otherwise, the stack data will not be included in the log. ESLint finds something that could cause production problems by avoiding these problems.ESLint helps to find an error in the code
▍23. Accelerate feedback through the use of continuous integration by local developers
Recommendations
Are you using a centralized continuous integration system that helps control the quality of the code, testing it, applying a linter, testing it for vulnerabilities? If so, make it so that developers can run this system locally. This will allow them to instantly check their code, which speeds up feedback and reduces project development time. Why is this so? An effective development and testing process involves many cyclically repetitive operations. The code is tested, then the developer receives a report, then, if necessary, the code is refactored, after which everything repeats. The faster the feedback loop works, the faster the developers get reports on code testing, the more iterations they can perform to improve this code. If a test report takes a lot of time, it can lead to a deterioration in the quality of the code. Let's say someone worked on a module, then started working on something else, then got a report on the module, which indicates that the module needs to be improved. However, the developer is already busy with completely different things, the developer will not pay enough attention to the problem module.
Some CI solution providers (say, CircleCI ) allow you to run the CI pipeline locally. Some paid tools, like Wallaby.js (the author notes that he is not associated with this project), allow you to quickly obtain valuable information about the quality of the code. In addition, the developer can simply add the corresponding npm script to
package.json , which performs code quality checks (tests, analyzes with linters, looks for vulnerabilities), and even uses the package concurrently to speed up the checks. Now, in order to comprehensively check the code, it will suffice to execute a single command, like npm run quality , and immediately receive a report. In addition, if the test of the code indicates the presence of problems in it, you can cancel commits using git hooks (the husky library can be useful for solving this problem).Consequences of derogating from recommendations
If the developer receives a report on the quality of the code a day after writing this code, such a report is likely to turn into something like a formal document, and the tests of the code will be divorced from work, not becoming its natural part.
The right approach
Here is the npm script that performs the code quality check. The execution of checks is parallelized. The script is executed when trying to send a new code to the repository. In addition, the developer can run it on his own initiative.
"scripts": { "inspect:sanity-testing": "mocha **/**--test.js --grep \"sanity\"", "inspect:lint": "eslint .", "inspect:vulnerabilities": "npm audit", "inspect:license": "license-checker --failOn GPLv2", "inspect:complexity": "plato .", "inspect:all": "concurrently -c \"bgBlue.bold,bgMagenta.bold,yellow\" \"npm:inspect:quick-testing\" \"npm:inspect:lint\" \"npm:inspect:vulnerabilities\" \"npm:inspect:license\"" }, "husky": { "hooks": { "precommit": "npm run inspect:all", "prepush": "npm run inspect:all" } } ▍24. Perform end-to-end testing on a realistic production-environment mirror
Recommendations
In the vast ecosystem of Kubernetes, there is still a consensus on the use of tools suitable for the deployment of local environments, although such tools appear quite often. Here one of the possible approaches is to launch “minimized” Kubernetes using tools like Minikube or MicroK8s , which allow you to create lightweight environments that resemble real ones. Another approach is testing projects in a remote “real” Kubernetes environment. Some CI providers (like Codefresh ) allow interaction with the embedded Kubernetes environments, which simplifies the work of the CI pipelines when testing real projects. Others allow you to work with remote Kubernetes environments.
Consequences of derogating from recommendations
The use of various technologies in production and testing requires the support of two development models and leads to the separation of teams of programmers and DevOps specialists.
The right approach
Here is an example of a CI chain, which, as they say, on the fly, creates a Kubernetes cluster (this is taken from here ).
deploy: stage: deploy image: registry.gitlab.com/gitlab-examples/kubernetes-deploy script: - ./configureCluster.sh $KUBE_CA_PEM_FILE $KUBE_URL $KUBE_TOKEN - kubectl create ns $NAMESPACE - kubectl create secret -n $NAMESPACE docker-registry gitlab-registry --docker-server="$CI_REGISTRY" --docker-username="$CI_REGISTRY_USER" --docker-password="$CI_REGISTRY_PASSWORD" --docker-email="$GITLAB_USER_EMAIL" - mkdir .generated - echo "$CI_BUILD_REF_NAME-$CI_BUILD_REF" - sed -e "s/TAG/$CI_BUILD_REF_NAME-$CI_BUILD_REF/g" templates/deals.yaml | tee ".generated/deals.yaml" - kubectl apply --namespace $NAMESPACE -f .generated/deals.yaml - kubectl apply --namespace $NAMESPACE -f templates/my-sock-shop.yaml environment: name: test-for-ci ▍25. Strive for parallelization of test execution.
Recommendations
If the testing system is well organized, it will become your faithful friend, round the clock ready to report problems with the code. For this, tests must be performed very quickly. In practice, it turns out that the execution of 500 unit tests intensively using a processor in a single-threaded mode takes too much time. And such tests need to be done quite often. Fortunately, modern tools for running tests ( Jest , AVA , an extension for Mocha ) and CI-platform can perform tests in parallel using several processes, which can significantly improve the speed of receiving test reports. Some CI platforms even know how to parallelize tests between containers, which further improves the feedback loop. To successfully parallelize the execution of tests, local or remote, tests should not depend on each other. Stand-alone tests can easily run in different processes.
Consequences of derogating from recommendations
Obtaining test results an hour after sending the code to the repository, while working on new project features, is a great way to reduce the usefulness of test results.
The right approach
Thanks to the parallel execution of tests, the mocha-parallel-test library and the Jest framework easily bypass Mocha ( this is the source of this information).
Test run performance test
▍26. Protect yourself from legal problems by using license checks and plagiarism code checks.
Recommendations
Perhaps now you are not particularly concerned about the problems with the law and with plagiarism. But why not check your project for similar problems? There are many means for organizing such checks. For example, it is license-checker and plagiarism-checker (this is a commercial package, but it can be used for free). Such checks are easy to build into the CI pipeline and check the project, for example, for dependencies with limited licenses, or for the code copied from StackOverflow, and probably violating someone's copyright.
Consequences of derogating from recommendations
The developer, quite unintentionally, can use the package with an inappropriate license for his project, or copy the commercial code, which can lead to legal problems.
The right approach
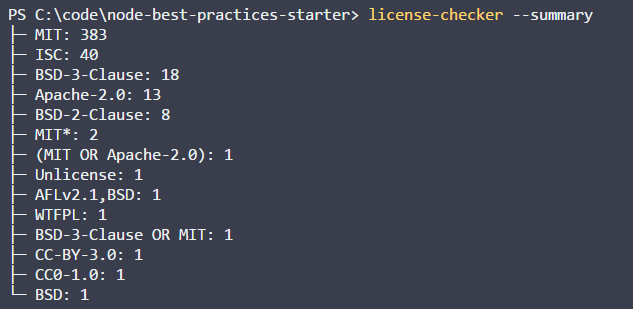
Install the license-checker package locally or in a CI environment:
npm install -g license-checker We will verify licenses with it, and if he finds what does not suit us, we recognize the check as unsuccessful. CI-system, finding that something went wrong while checking licenses, will stop the project build.
license-checker --summary --failOn BSD License check
▍27. Constantly check the project for vulnerable dependencies.
Recommendations
Even highly respected and reliable packages, such as Express, have vulnerabilities. In order to identify such vulnerabilities, you can use special tools - such as the standard tool for auditing npm-packages or the commercial project snyk , which has a free version. These checks, along with others, can be made part of the CI pipeline.
Consequences of derogating from recommendations
In order to protect your project from the vulnerabilities of its dependencies without the use of special tools, you will have to constantly monitor publications about such vulnerabilities. This is a very time consuming task.
The right approach
Here are the results of project verification using NPM Audit.
Package Inspection Report for Vulnerabilities
▍28. Automate dependency updating
Recommendations
The road to hell is paved with good intentions. This idea is perfectly applicable to the
package-lock.json , the use of which, by default, blocks the updating of packages. This happens even in cases when projects are brought to a healthy state with the npm install and npm update commands. This leads either to the use of obsolete packages, at best, or, at worst, to the appearance of vulnerable code in a project. Development teams, as a result, rely on either manually updating information about the versions of packages that suit them, or on utilities like ncu , which, again, are started manually. The process of updating dependencies is best automated by focusing on using the most reliable versions of the packages used in the project. There is no one correct solution here, however, a couple of noteworthy approaches can be distinguished in automating package updates. The first is to introduce something like package checking with npm-outdated or npm-check-updates (ncu) into the CI pipeline. This will identify obsolete packages and encourage developers to upgrade them. The second approach is to use commercial tools that check the code and automatically make pull requests to update dependencies. In the field of automatic updating of dependencies, we face another interesting question that concerns the update policy. If updated when each new patch is released, the update may place too much stress on the system. If updated immediately after the release of the next major version of the package, this may lead to the use of unstable solutions in the project (vulnerabilities in many packages are detected exactly in the very first days after the release, read about the eslint-scope incident). A good package update policy may provide for a certain “transitional period” when the local version will be considered obsolete not immediately after the release of the next new version, but with some delay. , 1.3.1, 1.3.2, 1.3.8., , , .
ncu , , , .
ncu
▍29. , Node.js
Recommendations
, Node.js-, , Node.js .
- . — , , , Jenkins .
- , Docker.
- . , , . (, ), , , , .
- , , , . — , , , .
- , . , feature, — master, , ( ).
- . , .
- .
- (, Docker) .
- , , , . ,
node_modules.
, , .
▍30.
Recommendations
, . , , , Node.js , . CI-, , « ». , , , . , , mySQL, — Postgres. , Node.js, — 8, 9 10. , . CI-.
, , , . , , .
CI- Travis Node.js.
language: node_js node_js: - "7" - "6" - "5" - "4" install: - npm install script: - npm run test Results
, , . , , .
Dear readers! ?
Source: https://habr.com/ru/post/435464/
All Articles