Samsung SSD 860 QVO 1 TB and 4 TB: the first consumer SATA QLC (part 2)
Part 1 >> Part 2
The first random read performance test uses very short bursts of operations, performed one at a time, without a queue. Drives have such idle time between packages so that the working time is 20%, so thermal regulation is not possible. Each package consists of 32 MB of random readings of 4 KB from a 16 GB disk range. The total amount of data read is 1 GB.
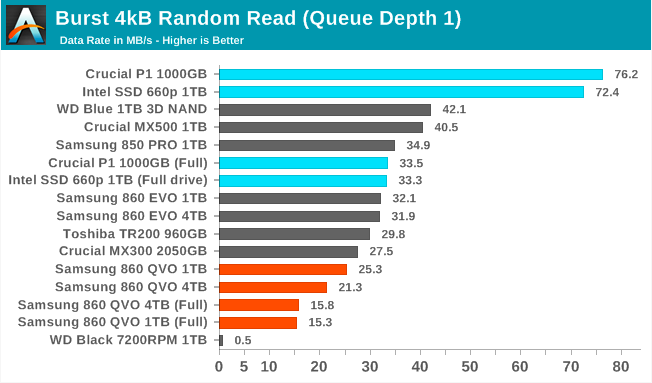
The random read speed of the Samsung 860 QVO is clearly lower than that of the 3D TLC, while the Intel / Micron QLC NVMe drives are no problem competing with traditional SATA TLC. But even in the worst case, when 1 TB of QVO is full, the read speed is still significantly higher than that of a hard disk.
')
The second test of random read performance is as follows: queue depths from 1 to 32 are tested, and the average performance and energy efficiency of QD1, QD2 and QD4 are used as the main indicators. Each queue depth is checked one minute or 32 GB of transferred data, whichever is less. After checking each queue, the drive is given one minute to cool, so heat accumulation is unlikely to affect the large queue depths. Individual read operations are still 4 KB, and use 64 GB of disk.
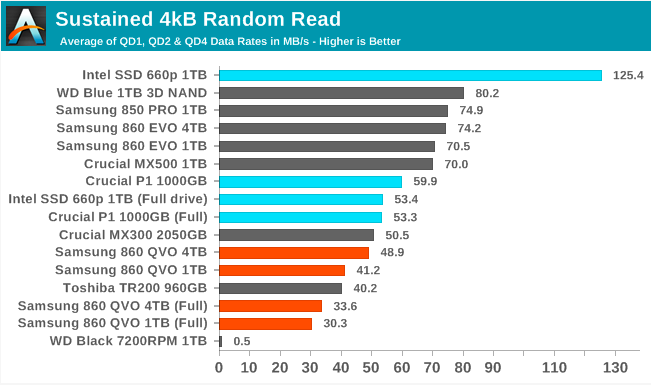
With a longer test, the Toshiba TR200 DRAMless TLC drive can’t get ahead of the 860 QVO, and even Intel / Micron QLC drives lag behind most of the mainstream SSD SATA SSDs (especially when full).
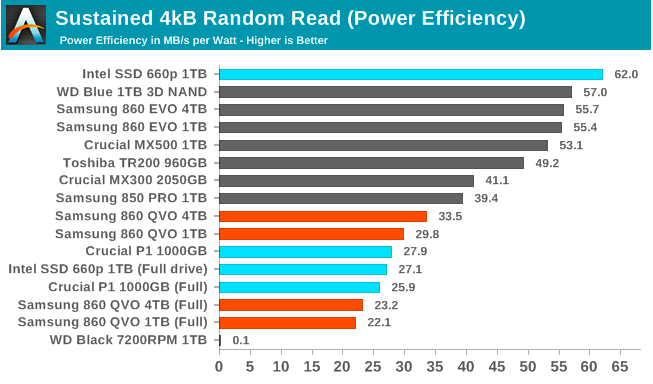
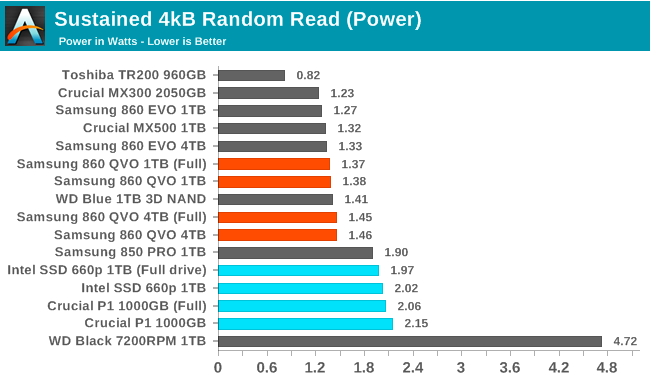
The 860 QVO power consumption during the random reading test is only slightly higher than that of its relatives based on TLC, but this is enough to bring its performance indicators to the last place.
The scaling depth of the QVO 860 queue during random read is fairly typical, with a decrease in the gain after QD16. But the main thing on the graph is the difference between the disks: QVO never reaches half the performance of the best SATA solid-state drives based on TLC.
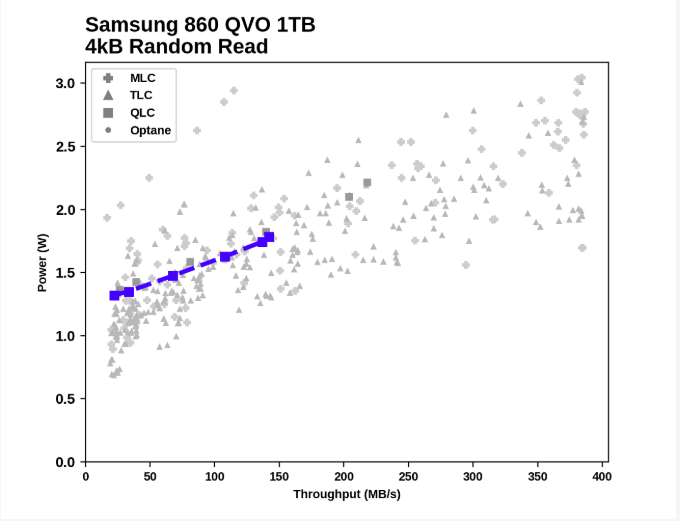
If we compare the results of random reading of 1VB 860 QVO with all the other SATA drives in the test database, it becomes clear that QVO is far from the most advanced in terms of energy efficiency or peak performance, but there are drives much worse than it.
Our first random write performance test is structured similarly to the first random read test, but each packet takes only 4 MB, and the total test length is 128 MB. Random write operations of 4 KB are allocated 16 GB of disk space, and operations are performed one by one, without a queue.
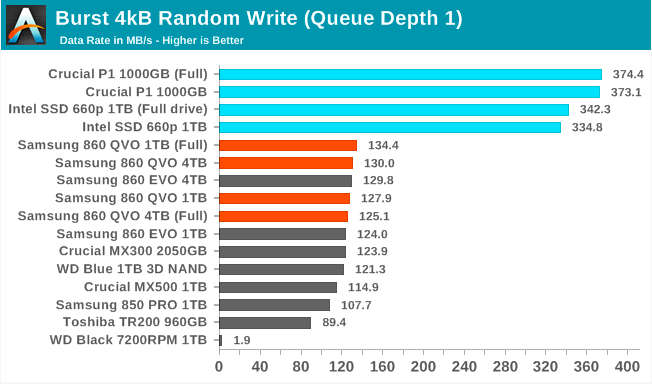
The 860 QVO SLC cache is very effective for the random write test, allowing you to slightly overtake even the 860 EVO.
As with the continuous random read test, our second random write test is performed in 4 KB blocks, one minute or 32 GB per queue depth, spanning 64 GB of disk and providing the disk with up to 1 minute of idle time between queue depths to ensure caches are cleared and cooled disk.
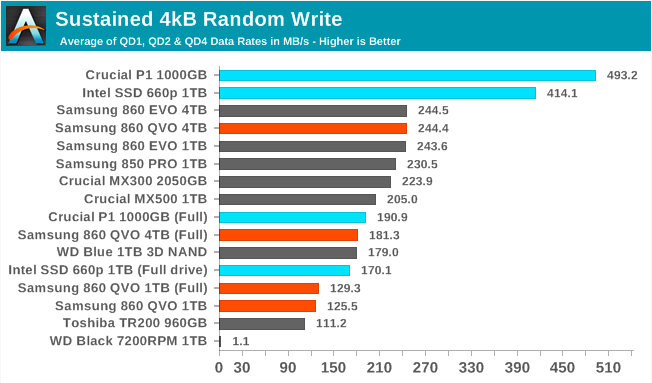
In a longer random write test, the larger SLC cache and large 4TB 860 QVO parallelism help it keep up with top SATA drives, but QVO 1 TB is, unfortunately, only slightly faster than a TLC drive without DRAM.
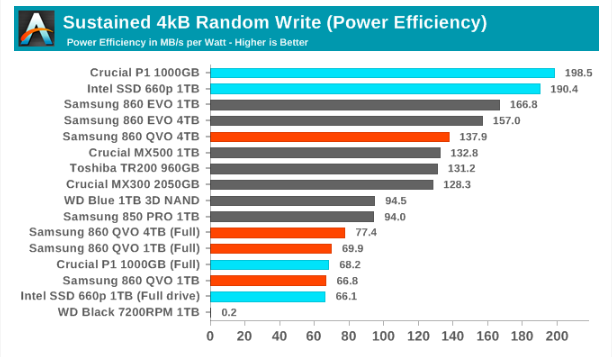
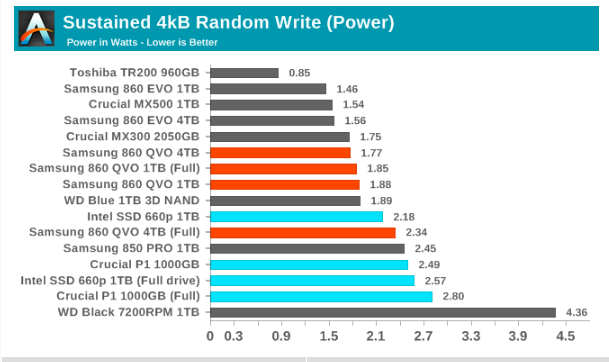
QVO is again a bit more power consuming than most TLC drives. This is less concerned with 4 TB of QVO, due to its good performance, but QVO by 1 TB eventually divides the last place with the QLC drives from Intel / Micron.
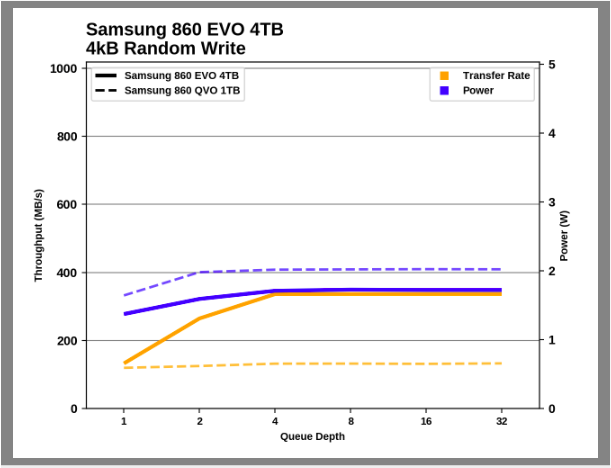
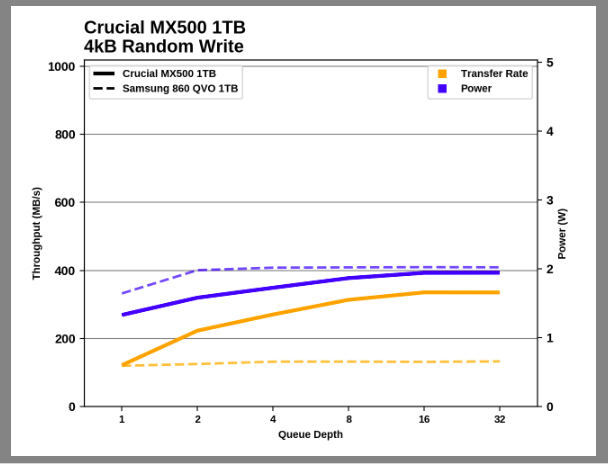
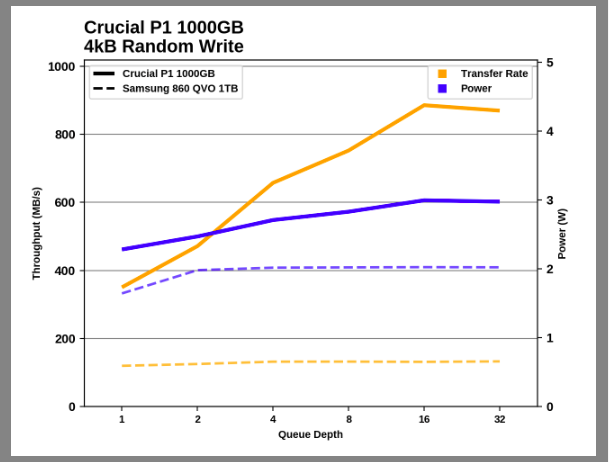
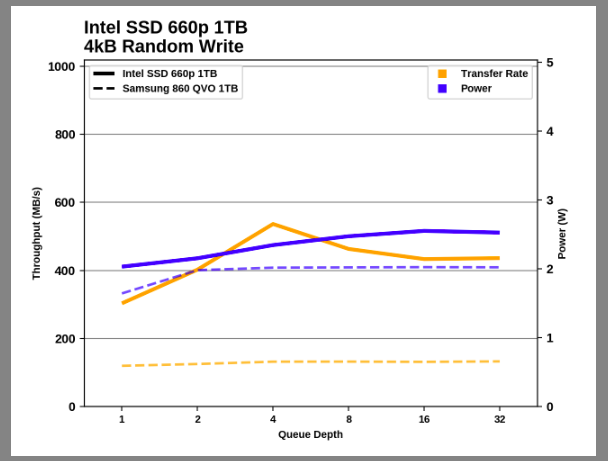
The 1TB 860 QVO shows a negligible increase in random write performance with increasing queue depth, although the power consumption increases significantly from QD1 to QD2. The 4TB 860 QVO demonstrates a much more typical scaling to saturation in QD4, with a performance curve that almost exactly corresponds to 4TB 860 EVO.
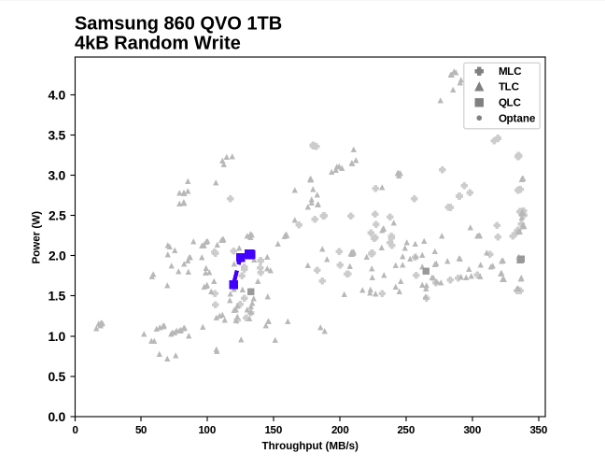
There are SATA TLC SSDs that consume the same power and only have half the performance of a random write of 1 TB 860 QVO. But in the general scheme, the results of 1 TB QVO in this test are not attractive. 4 TB starts there, but ultimately reaches the peak of SATA performance without consuming too much power.
In the first test of sequential read performance, 128 MB of short 128 KB operations are written, without a queue. The test averages performance over eight runs, and a total of 1 GB of data is transferred from a disk containing 16 GB of data. Between each package of operations, the drive is given enough downtime to maintain a total duty cycle of 20%.
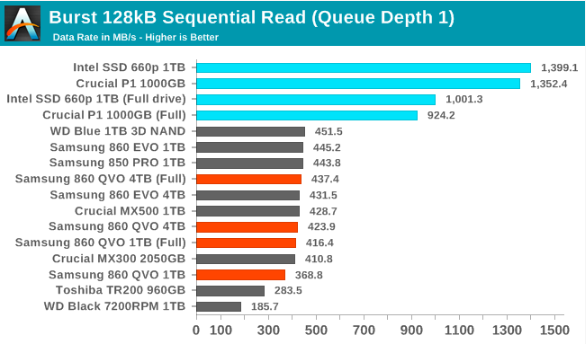
The performance of the Samsung 860 QVO sequential read is comparable to conventional SSD SATA TLC, and is well ahead of the Toshiba TR200 DRAMless. The 1 TB of QVO 860 is slightly lower when the drive is not full due to the timing of the test: the drive was still flushing the SLC cache in the background when the reading test began.
The next test, continuous sequential reading, uses queue depths from 1 to 32, with performance and consumption figures being calculated as the average QD1, QD2, and QD4. Each queue depth is checked no more than one minute, or before reading 32 GB from a disk containing 64 GB of data. This test is run twice: once from a drive prepared by sequential recording of test data, and again after the random writing test has mixed everything, causing fragmentation within the SSD that is invisible to the OS. These estimates represent the two extremes of how the disk will work in actual use, when leveling wear and modification of existing data will create some internal fragmentation that will degrade performance but not to the degree shown here.
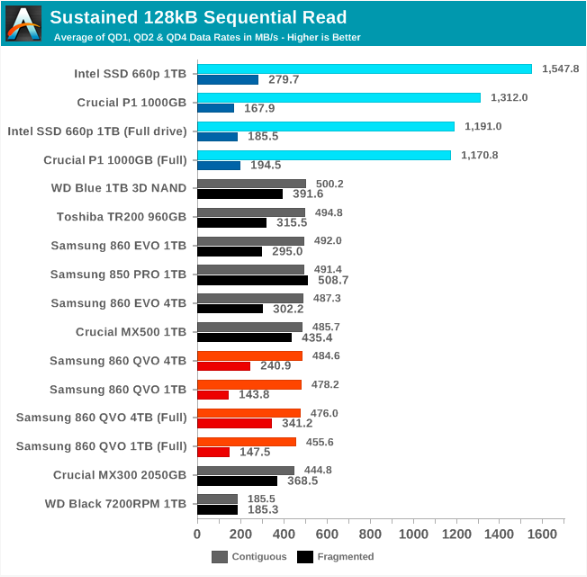
In a lengthy sequential read test, the 860 QVO is close to the SATA speed limit when reading data directly from flash memory. But in cases where internal fragmentation was created by randomly writing to a disk, the QVO reading speed dropped much more than that of TLC disks, and 1 TB of QVO 860 was even slower than a mechanical hard disk.
The energy efficiency of the 860 QVO is only slightly lower than that of TLC drives when reading continuous data. When working with fragmented data, QVO is slightly more efficient than Intel / Micron NVMe QLC drives, albeit a bit slower.
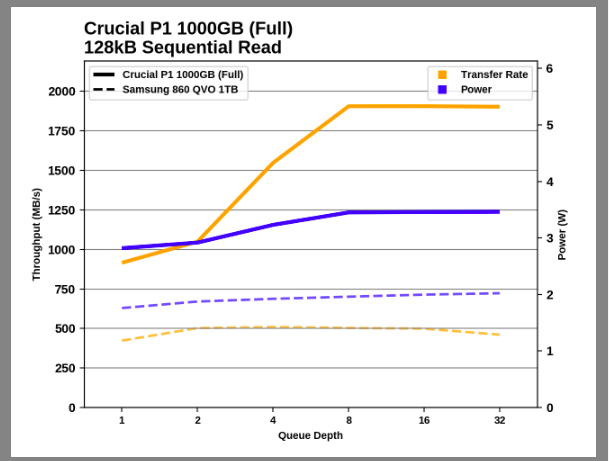
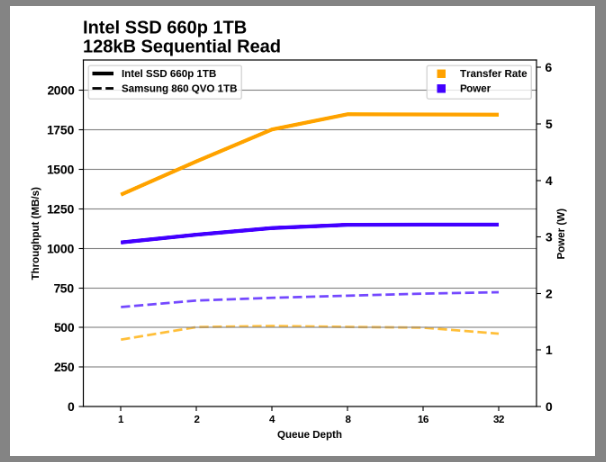
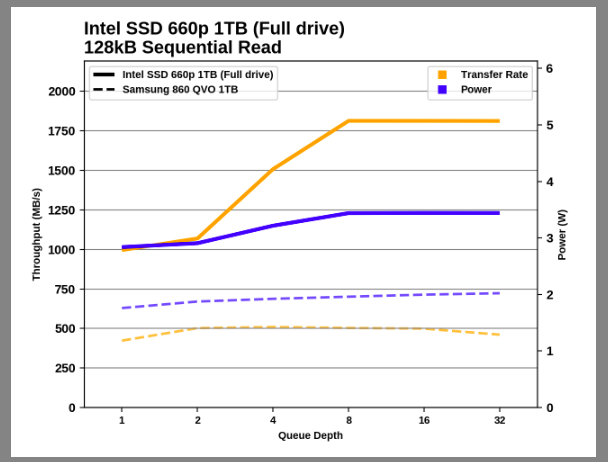
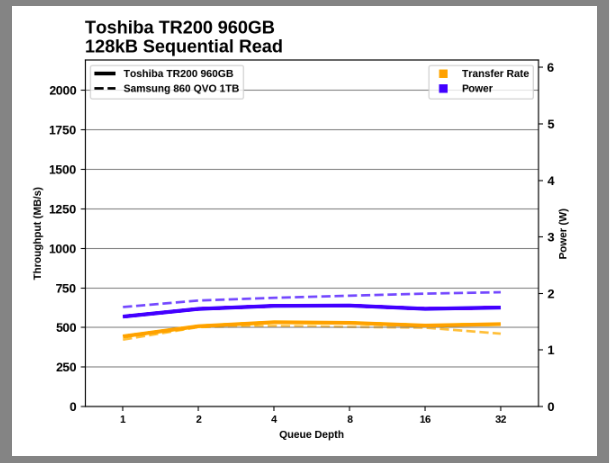
Scaling queue depth for QVO 860 is very typical: QD1 does not quite saturate the SATA channel, but higher queue depths reach almost full speed. The only exception is a slight drop in the Transfer Rate per 1 TB during the last QD32 phase.
In addition to a slight drop in performance on the QD32, sequential reading of the 860 QVO does not go beyond the normal ranges expected from TLC drives.
The short-term sequential write test is structured identically to the reading test, except for the direction of data transfer. Each batch of operations records 128 MB, 128 KB operations performed in QD1, a total of 1 GB of data is written to a disk containing 16 GB of data.
The Samsung 860 QVO does an excellent job with a sequential write test, when the drive is almost empty and there is enough space in the SLC cache. When the drive is full, the speed of the 1 TB model is somewhat reduced, but it is still much higher than that of a mechanical hard disk or a TLC drive without DRAM.
Our test of continuous sequential writing is identical to the second reading test, except for the direction of data transfer. The queue depth varies from 1 to 32, and each queue depth is checked for one minute or before recording 32 GB, after which there is a minute of inactivity when the disk is cooled and performs garbage collection. The test is limited to a disk capacity of 64 GB.
With a long sequential write test, the SLC 1TB 860 QVO cache is no longer sufficient, even if the disk is mostly empty, and it is in the last place. The 4 TB SLC cache holds this test and works just as fast as any SATA drive.
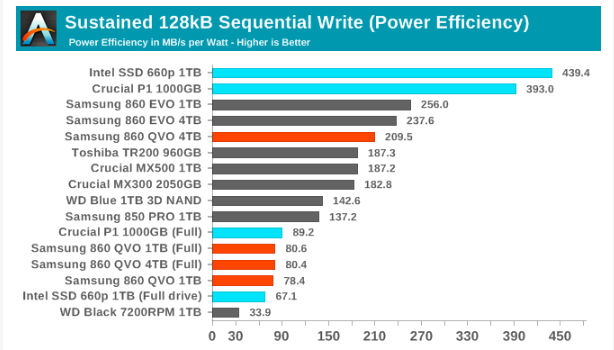
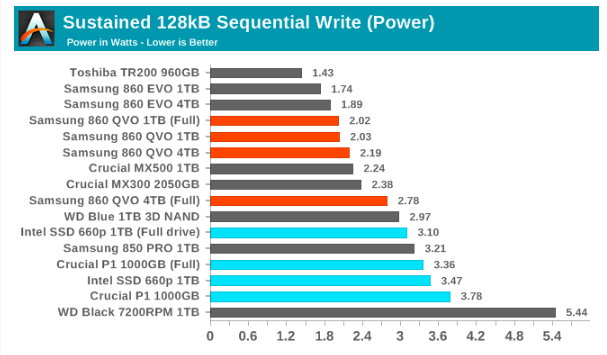
860 QVO is a bit more voracious than 860 EVO, so 4TB QVO ranks only third in efficiency in this group. The efficiency of 1 TB QVO is similar to faster, but more energy-intensive 1 TB drives QLC NVMe from Intel and Micron.
The 1TB 860 QVO shows a negligible increase in random write performance with increasing queue depth, although the power consumption increases significantly from QD1 to QD2. The 4TB 860 QVO demonstrates a much more typical scaling to saturation in QD4, with a performance curve that almost exactly corresponds to 4TB 860 EVO.
There are SATA TLC SSDs that consume the same power and only have half the performance of a random write of 1 TB 860 QVO. But in the general scheme, the results of 1 TB QVO in this test are not attractive. 4 TB starts there, but ultimately reaches the peak of SATA performance without consuming too much power.
In the first test of sequential read performance, 128 MB of short 128 KB operations are written, without a queue. The test averages performance over eight runs, and a total of 1 GB of data is transferred from a disk containing 16 GB of data. Between each package of operations, the drive is given enough downtime to maintain a total duty cycle of 20%.
The performance of the Samsung 860 QVO sequential read is comparable to conventional SSD SATA TLC, and is well ahead of the Toshiba TR200 DRAMless. The 1 TB of QVO 860 is slightly lower when the drive is not full due to the timing of the test: the drive was still flushing the SLC cache in the background when the reading test began.
The next test, continuous sequential reading, uses queue depths from 1 to 32, with performance and consumption figures being calculated as the average QD1, QD2, and QD4. Each queue depth is checked no more than one minute, or before reading 32 GB from a disk containing 64 GB of data. This test is run twice: once from a drive prepared by sequential recording of test data, and again after the random writing test has mixed everything, causing fragmentation within the SSD that is invisible to the OS. These estimates represent the two extremes of how the disk will work in actual use, when leveling wear and modification of existing data will create some internal fragmentation that will degrade performance but not to the degree shown here.
In a lengthy sequential read test, the 860 QVO is close to the SATA speed limit when reading data directly from flash memory. But in cases where internal fragmentation was created by randomly writing to a disk, the QVO reading speed dropped much more than that of TLC disks, and 1 TB of QVO 860 was even slower than a mechanical hard disk.
The energy efficiency of the 860 QVO is only slightly lower than that of TLC drives when reading continuous data. When working with fragmented data, QVO is slightly more efficient than Intel / Micron NVMe QLC drives, albeit a bit slower.
During the sequential test, the 1TB 860 QVO is slow and stable, while the performance of the 4TB model is the same as any other SATA drive.
Sequential write to 1TB 860 QVO is obviously slower than usual, but this is not unprecedented: there were the same slow TLC drives, but most of them had less than 1 TB. Model 4TB looks better in the big picture.
Thank you for staying with us. Do you like our articles? Want to see more interesting materials? Support us by placing an order or recommending to friends, 30% discount for Habr users on a unique analogue of the entry-level servers that we invented for you: The whole truth about VPS (KVM) E5-2650 v4 (6 Cores) 10GB DDR4 240GB SSD 1Gbps from $ 20 or how to share the server? (Options are available with RAID1 and RAID10, up to 24 cores and up to 40GB DDR4).
VPS (KVM) E5-2650 v4 (6 Cores) 10GB DDR4 240GB SSD 1Gbps until January 1 for free if you pay for a period of six months, you can order here .
Dell R730xd 2 times cheaper? Only we have 2 x Intel Dodeca-Core Xeon E5-2650v4 128GB DDR4 6x480GB SSD 1Gbps 100 TV from $ 249 in the Netherlands and the USA! Read about How to build an infrastructure building. class c using servers Dell R730xd E5-2650 v4 worth 9000 euros for a penny?
Random read
The first random read performance test uses very short bursts of operations, performed one at a time, without a queue. Drives have such idle time between packages so that the working time is 20%, so thermal regulation is not possible. Each package consists of 32 MB of random readings of 4 KB from a 16 GB disk range. The total amount of data read is 1 GB.
The random read speed of the Samsung 860 QVO is clearly lower than that of the 3D TLC, while the Intel / Micron QLC NVMe drives are no problem competing with traditional SATA TLC. But even in the worst case, when 1 TB of QVO is full, the read speed is still significantly higher than that of a hard disk.
')
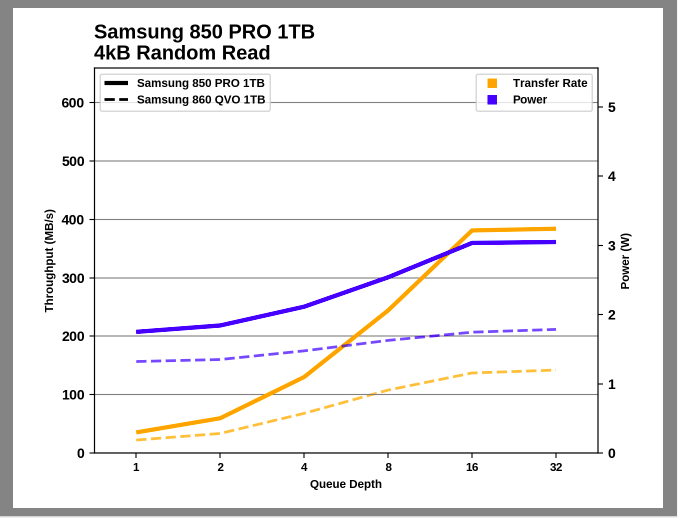
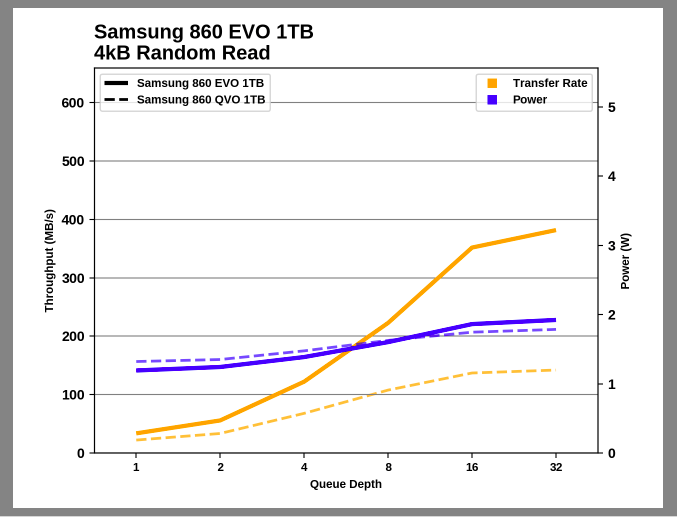
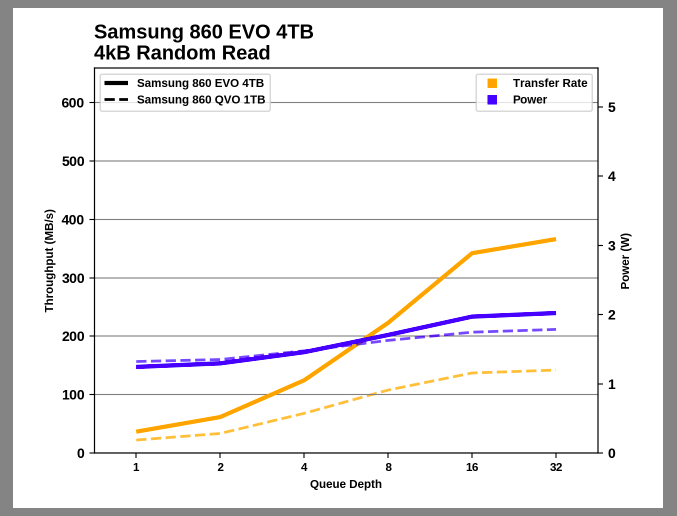
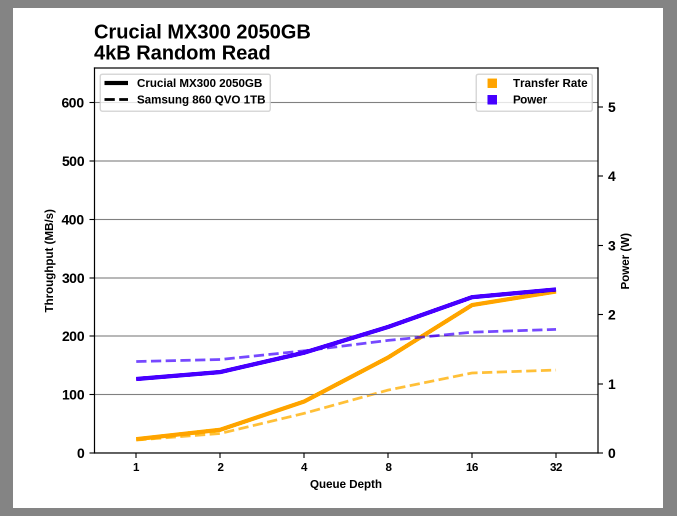
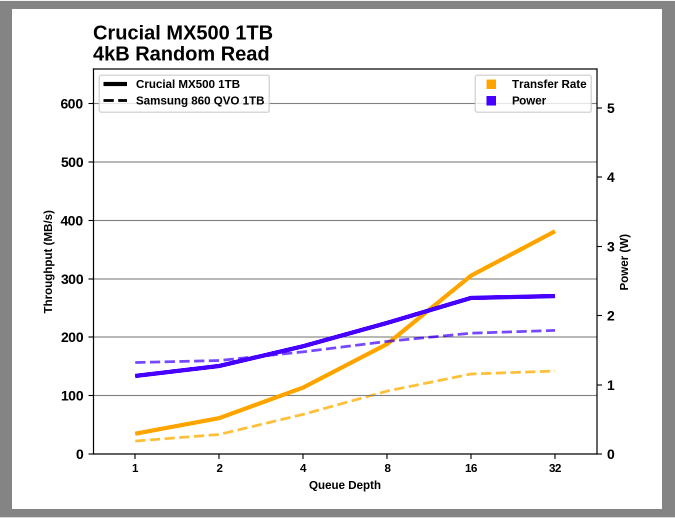
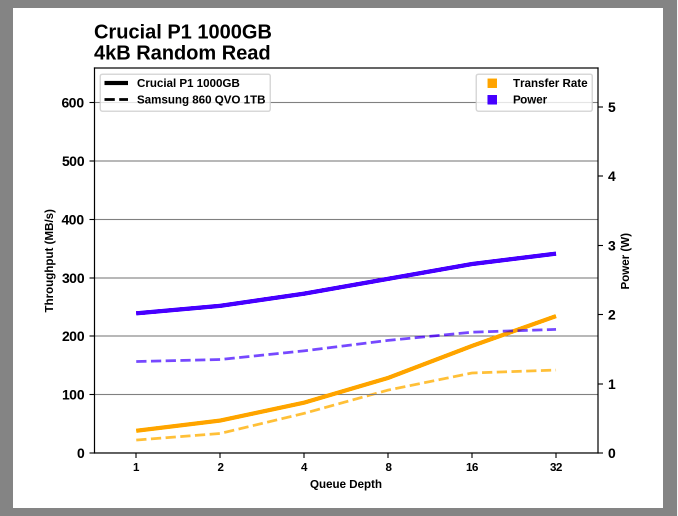
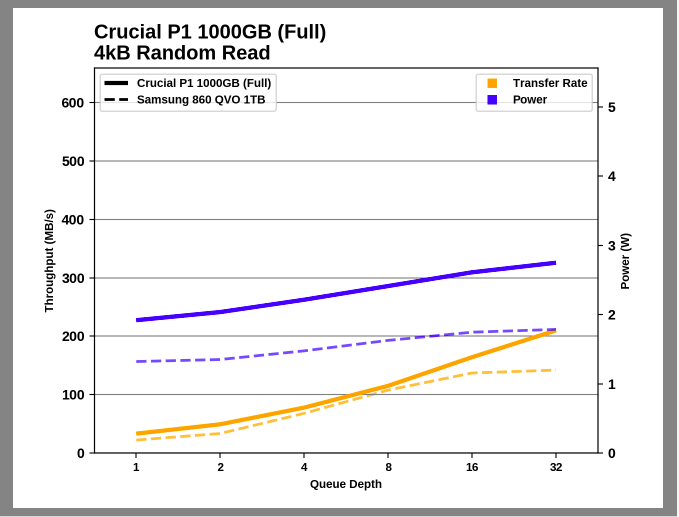
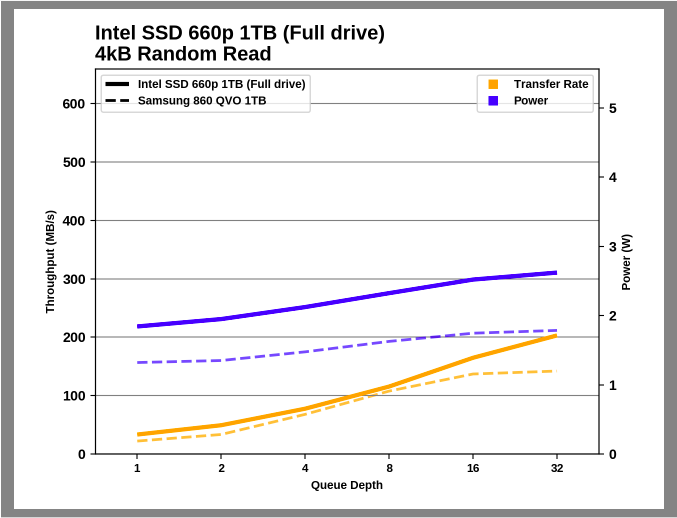
The second test of random read performance is as follows: queue depths from 1 to 32 are tested, and the average performance and energy efficiency of QD1, QD2 and QD4 are used as the main indicators. Each queue depth is checked one minute or 32 GB of transferred data, whichever is less. After checking each queue, the drive is given one minute to cool, so heat accumulation is unlikely to affect the large queue depths. Individual read operations are still 4 KB, and use 64 GB of disk.
With a longer test, the Toshiba TR200 DRAMless TLC drive can’t get ahead of the 860 QVO, and even Intel / Micron QLC drives lag behind most of the mainstream SSD SATA SSDs (especially when full).
The 860 QVO power consumption during the random reading test is only slightly higher than that of its relatives based on TLC, but this is enough to bring its performance indicators to the last place.
Comparison charts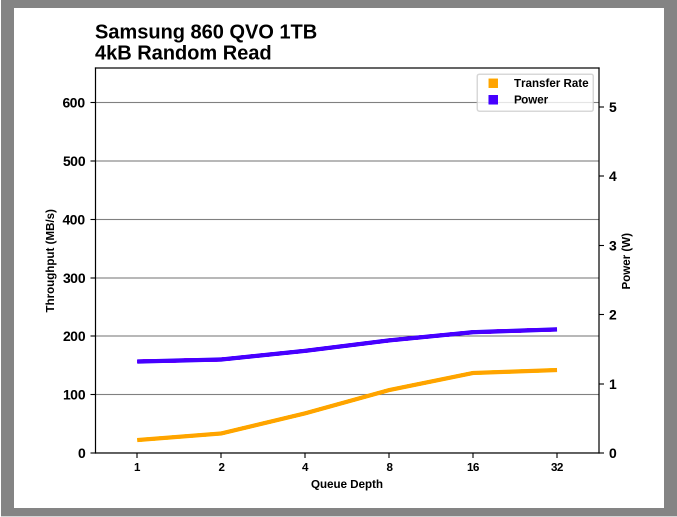
Samsung 860 QVO 1TB
Samsung 860 QVO 1TB (Full)
Samsung 860 QVO 4TB
Samsung 860 QVO 4TB (Full)
Samsung 850 PRO 1TB
Samsung 860 EVO 1TB
Samsung 860 EVO 4TB
Crucial MX300 2050GB
Crucial MX500 1TB
Crucial P1 1000GB
Crucial P1 1000GB (Full)

Intel SSD 660p 1TB
Intel SSD 660p 1TB (Full drive)
Toshiba TR200 960GB
WD Black 7200RPM 1TB
WD Blue 1TB 3D NAND
Samsung 860 QVO 1TB
Samsung 860 QVO 1TB (Full)
Samsung 860 QVO 4TB
Samsung 860 QVO 4TB (Full)
Samsung 850 PRO 1TB
Samsung 860 EVO 1TB
Samsung 860 EVO 4TB
Crucial MX300 2050GB
Crucial MX500 1TB
Crucial P1 1000GB
Crucial P1 1000GB (Full)
Intel SSD 660p 1TB
Intel SSD 660p 1TB (Full drive)
Toshiba TR200 960GB
WD Black 7200RPM 1TB
WD Blue 1TB 3D NAND
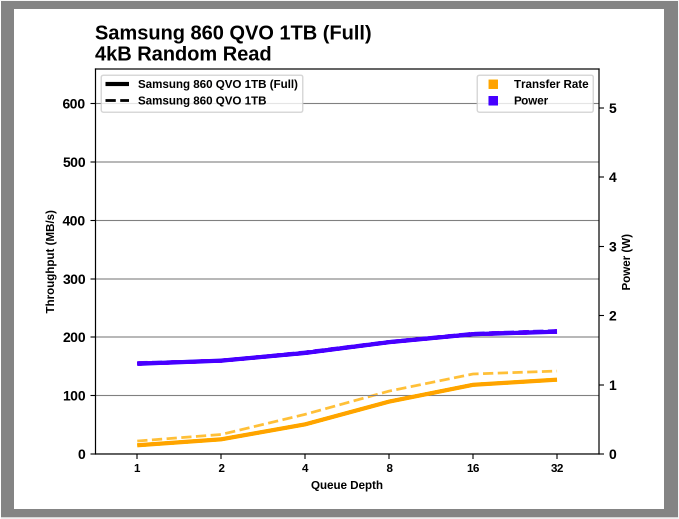
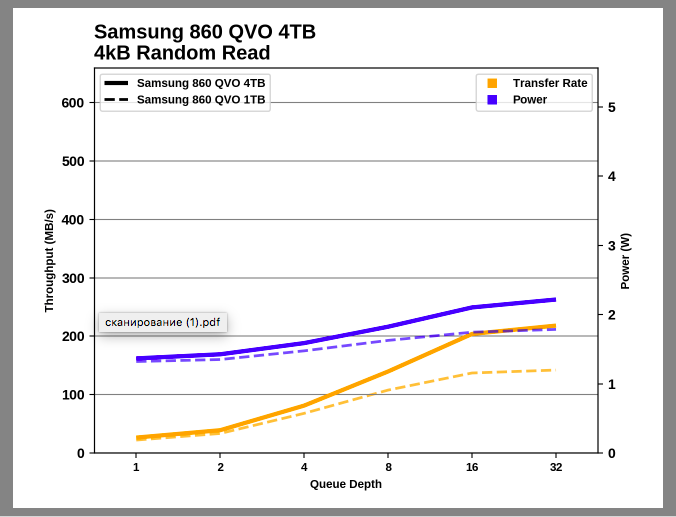
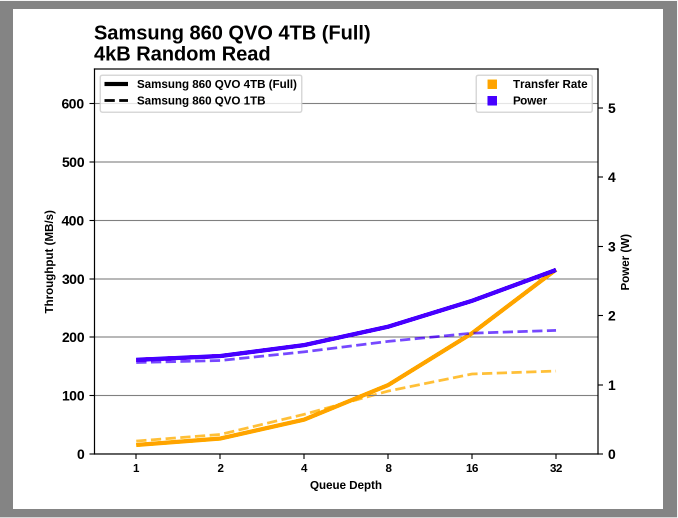
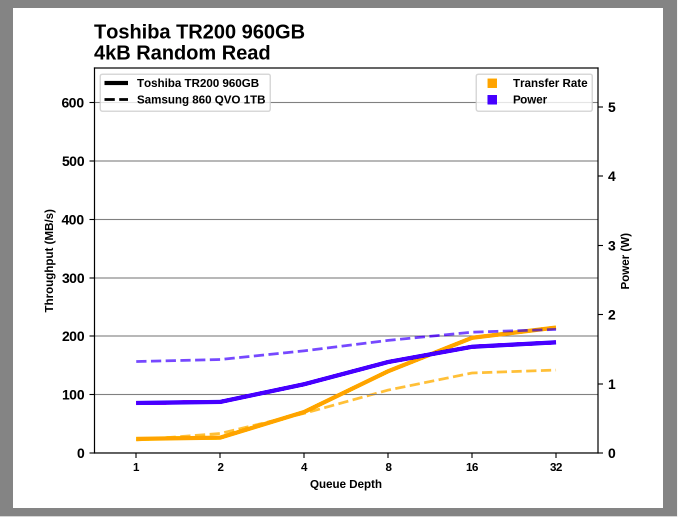
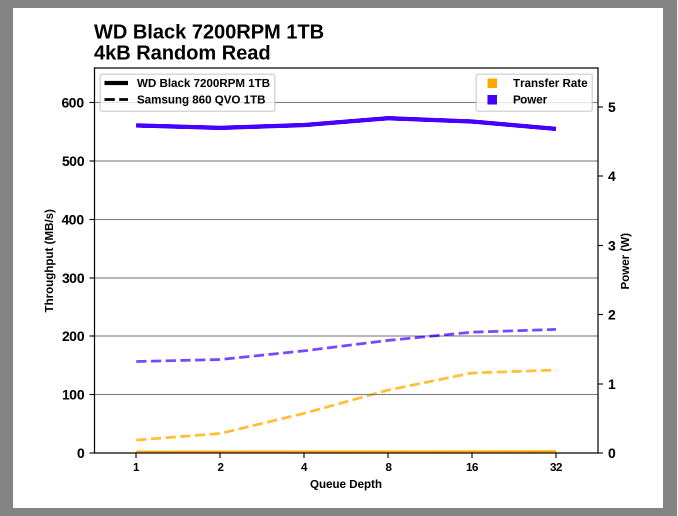
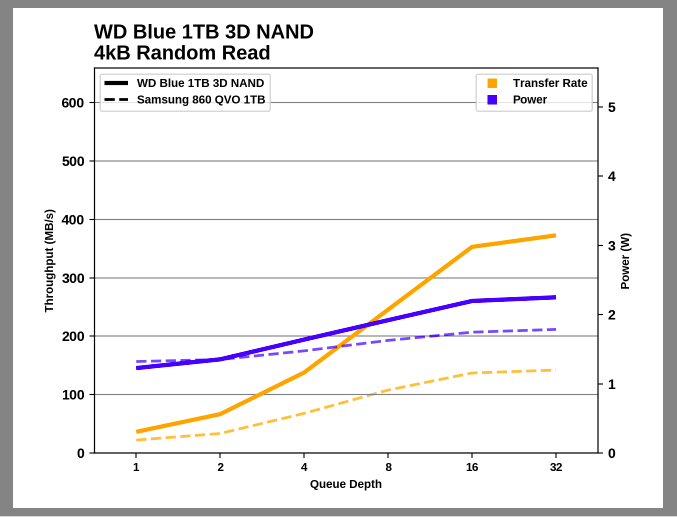
The scaling depth of the QVO 860 queue during random read is fairly typical, with a decrease in the gain after QD16. But the main thing on the graph is the difference between the disks: QVO never reaches half the performance of the best SATA solid-state drives based on TLC.
If we compare the results of random reading of 1VB 860 QVO with all the other SATA drives in the test database, it becomes clear that QVO is far from the most advanced in terms of energy efficiency or peak performance, but there are drives much worse than it.
Random record
Our first random write performance test is structured similarly to the first random read test, but each packet takes only 4 MB, and the total test length is 128 MB. Random write operations of 4 KB are allocated 16 GB of disk space, and operations are performed one by one, without a queue.
The 860 QVO SLC cache is very effective for the random write test, allowing you to slightly overtake even the 860 EVO.
As with the continuous random read test, our second random write test is performed in 4 KB blocks, one minute or 32 GB per queue depth, spanning 64 GB of disk and providing the disk with up to 1 minute of idle time between queue depths to ensure caches are cleared and cooled disk.
In a longer random write test, the larger SLC cache and large 4TB 860 QVO parallelism help it keep up with top SATA drives, but QVO 1 TB is, unfortunately, only slightly faster than a TLC drive without DRAM.
QVO is again a bit more power consuming than most TLC drives. This is less concerned with 4 TB of QVO, due to its good performance, but QVO by 1 TB eventually divides the last place with the QLC drives from Intel / Micron.
Comparison charts
Samsung 860 QVO 1TB
Samsung 860 QVO 1TB (Full)
Samsung 860 QVO 4TB
Samsung 860 QVO 4TB (Full)
Samsung 850 PRO 1TB
Samsung 850 EVO 1TB
Samsung 850 EVO 4TB

Crucial MX300 2050GB
Crucial MX500 1TB
Crucial P1 1000GB

Crucial P1 1000GB (Fuli)
Intel 660p 1TB
Intel 660p 1TB (Full drive)
Toshiba TR200 960GB
WD Black 7200RPM 1TB
WD Blue1 TB 3D NAND
Samsung 860 QVO 1TB
Samsung 860 QVO 1TB (Full)
Samsung 860 QVO 4TB
Samsung 860 QVO 4TB (Full)
Samsung 850 PRO 1TB
Samsung 850 EVO 1TB
Samsung 850 EVO 4TB
Crucial MX300 2050GB
Crucial MX500 1TB
Crucial P1 1000GB
Crucial P1 1000GB (Fuli)
Intel 660p 1TB
Intel 660p 1TB (Full drive)
Toshiba TR200 960GB
WD Black 7200RPM 1TB
WD Blue1 TB 3D NAND
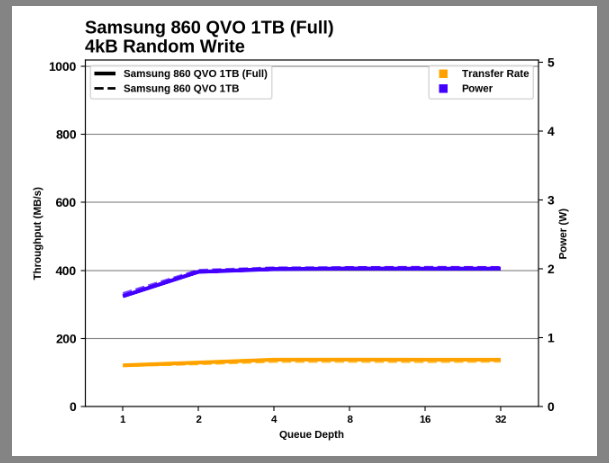
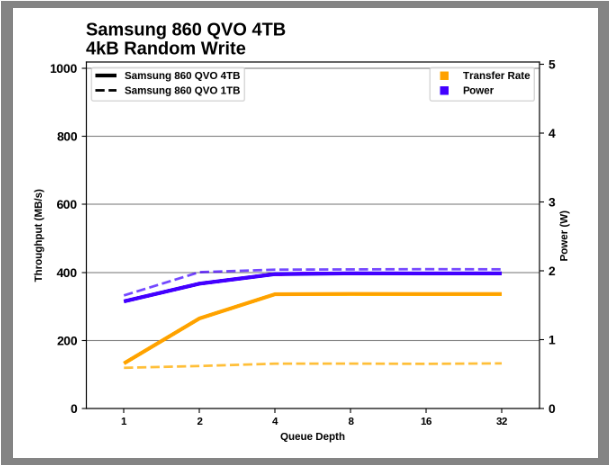
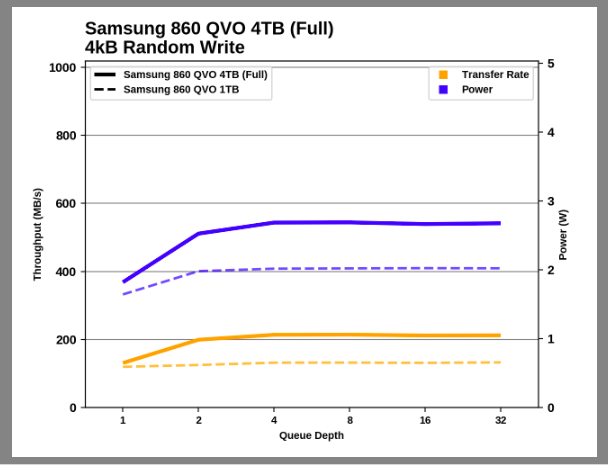
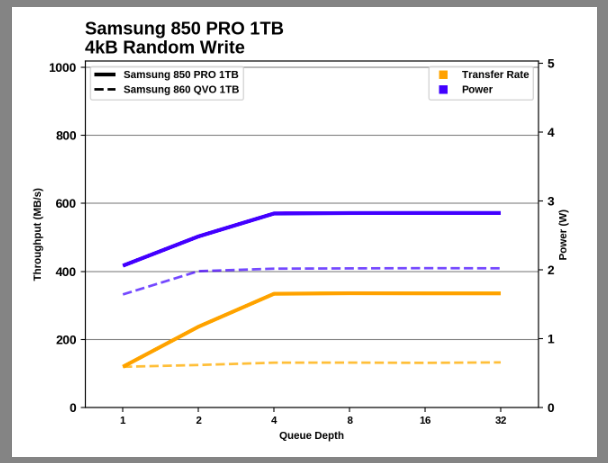
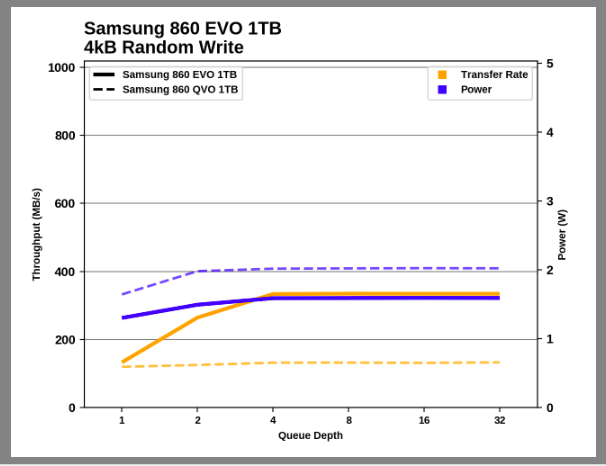
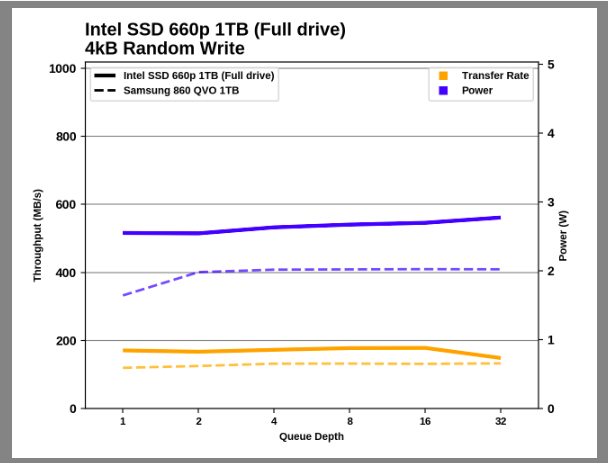
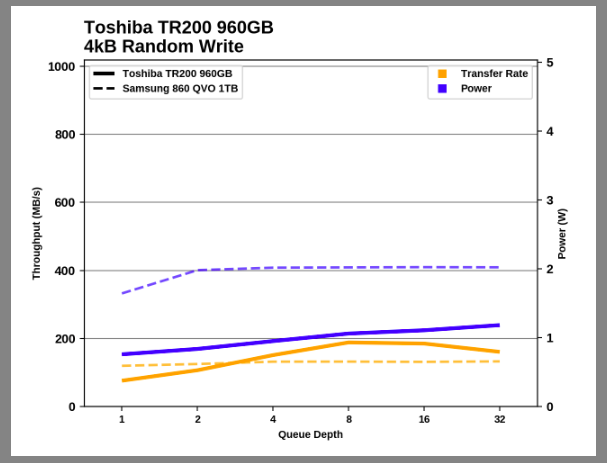
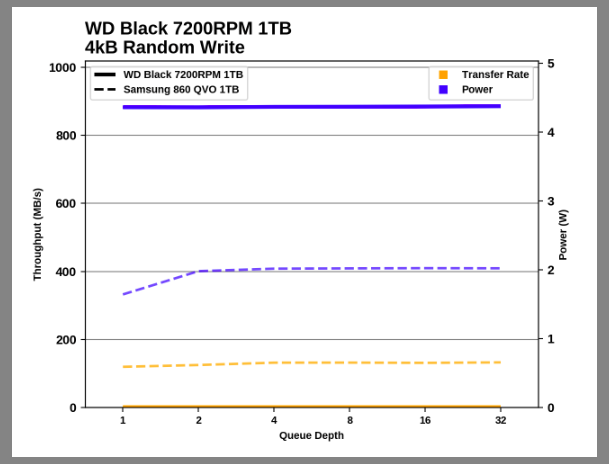
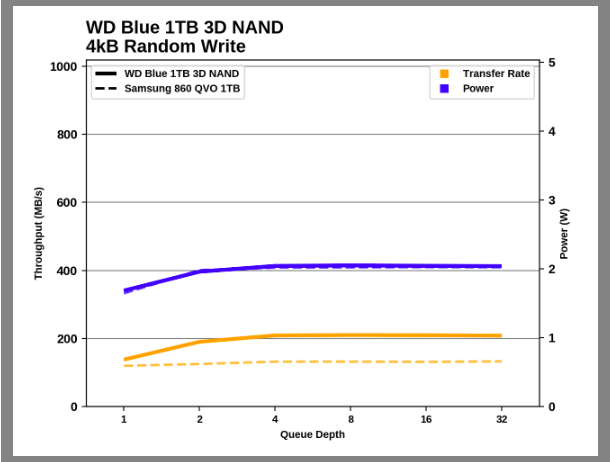
The 1TB 860 QVO shows a negligible increase in random write performance with increasing queue depth, although the power consumption increases significantly from QD1 to QD2. The 4TB 860 QVO demonstrates a much more typical scaling to saturation in QD4, with a performance curve that almost exactly corresponds to 4TB 860 EVO.
There are SATA TLC SSDs that consume the same power and only have half the performance of a random write of 1 TB 860 QVO. But in the general scheme, the results of 1 TB QVO in this test are not attractive. 4 TB starts there, but ultimately reaches the peak of SATA performance without consuming too much power.
Sequential read performance
In the first test of sequential read performance, 128 MB of short 128 KB operations are written, without a queue. The test averages performance over eight runs, and a total of 1 GB of data is transferred from a disk containing 16 GB of data. Between each package of operations, the drive is given enough downtime to maintain a total duty cycle of 20%.
The performance of the Samsung 860 QVO sequential read is comparable to conventional SSD SATA TLC, and is well ahead of the Toshiba TR200 DRAMless. The 1 TB of QVO 860 is slightly lower when the drive is not full due to the timing of the test: the drive was still flushing the SLC cache in the background when the reading test began.
The next test, continuous sequential reading, uses queue depths from 1 to 32, with performance and consumption figures being calculated as the average QD1, QD2, and QD4. Each queue depth is checked no more than one minute, or before reading 32 GB from a disk containing 64 GB of data. This test is run twice: once from a drive prepared by sequential recording of test data, and again after the random writing test has mixed everything, causing fragmentation within the SSD that is invisible to the OS. These estimates represent the two extremes of how the disk will work in actual use, when leveling wear and modification of existing data will create some internal fragmentation that will degrade performance but not to the degree shown here.
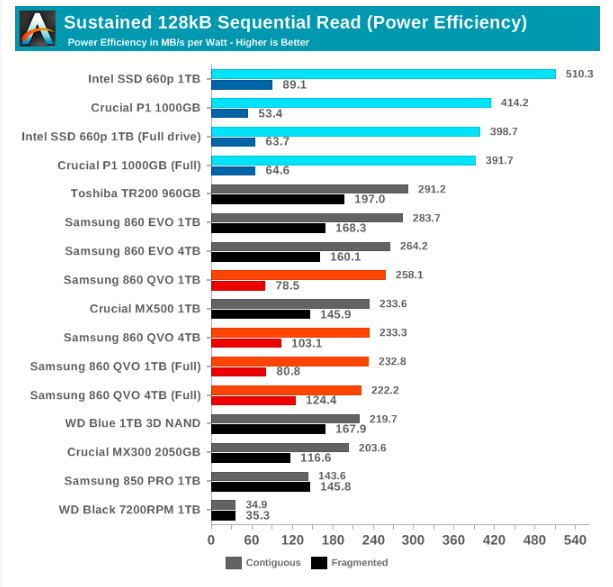
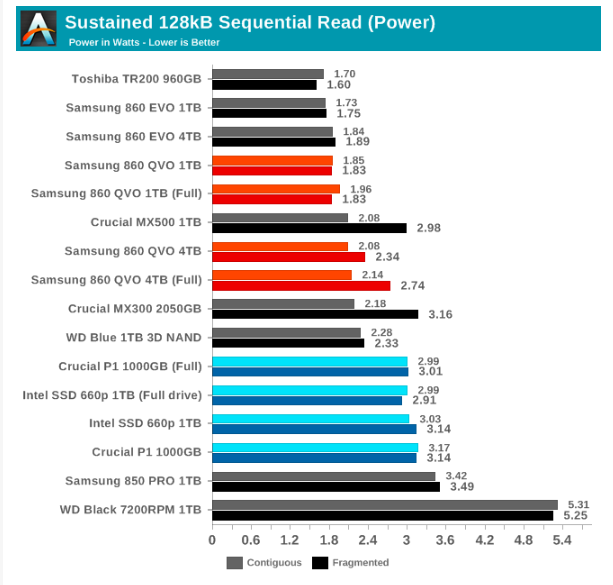
In a lengthy sequential read test, the 860 QVO is close to the SATA speed limit when reading data directly from flash memory. But in cases where internal fragmentation was created by randomly writing to a disk, the QVO reading speed dropped much more than that of TLC disks, and 1 TB of QVO 860 was even slower than a mechanical hard disk.
The energy efficiency of the 860 QVO is only slightly lower than that of TLC drives when reading continuous data. When working with fragmented data, QVO is slightly more efficient than Intel / Micron NVMe QLC drives, albeit a bit slower.
Comparison charts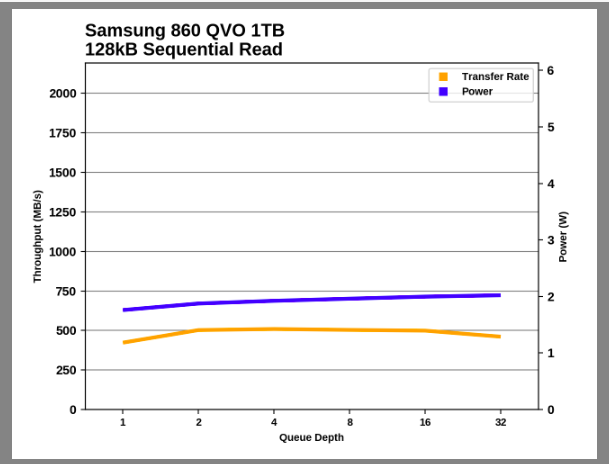
Samsung 860 QVO 1TB
Samsung 860 QVO 1TB (Full)
Samsung 860 QVO 4TB
Samsung 860 QVO 4TB (Full)

Samsung 850 PRO 1TB
Samsung 850 EVO 1TB
Samsung 850 EVO 4TB
Crucial MX300 2050GB
Crucial MX500 1TB

Crucial P1 1000GB
Crucial P1 1000GB (Fuli)
Intel 660p 1TB
Intel 660p 1TB (Full drive)
Toshiba TR200 960GB
WD Black 7200RPM 1TB
WD Blue1 TB 3D NAND
Samsung 860 QVO 1TB
Samsung 860 QVO 1TB (Full)
Samsung 860 QVO 4TB
Samsung 860 QVO 4TB (Full)
Samsung 850 PRO 1TB
Samsung 850 EVO 1TB
Samsung 850 EVO 4TB
Crucial MX300 2050GB
Crucial MX500 1TB
Crucial P1 1000GB
Crucial P1 1000GB (Fuli)
Intel 660p 1TB
Intel 660p 1TB (Full drive)
Toshiba TR200 960GB
WD Black 7200RPM 1TB
WD Blue1 TB 3D NAND
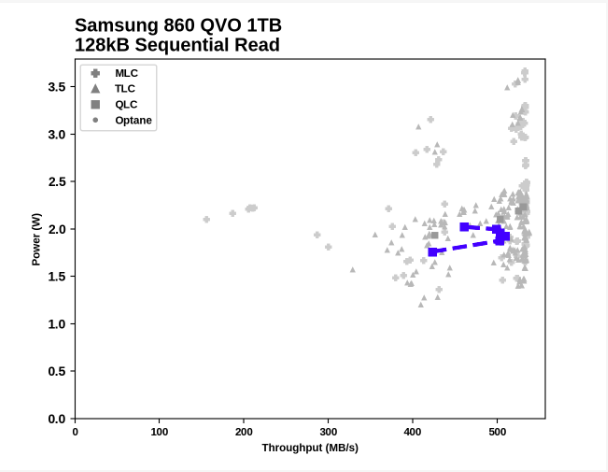
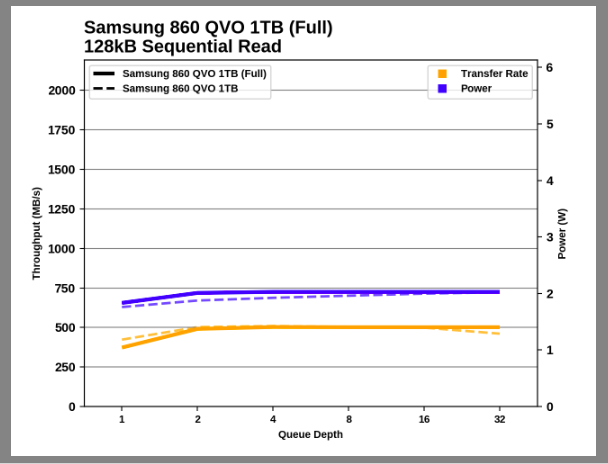
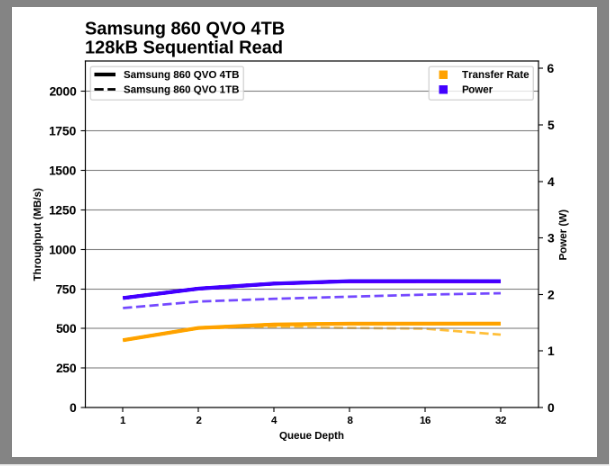
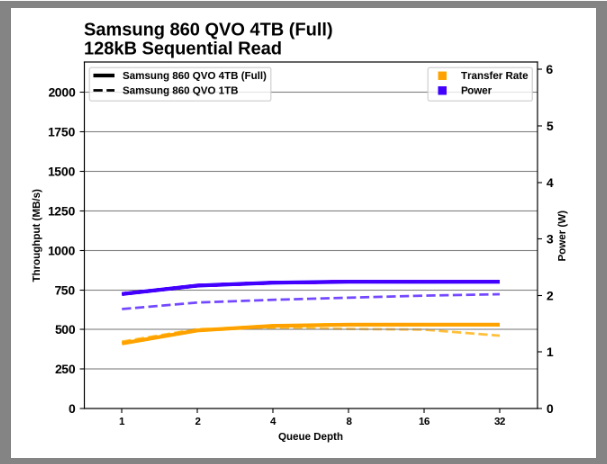
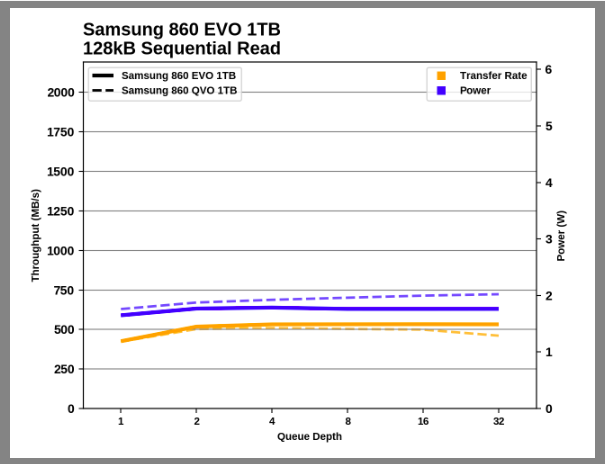
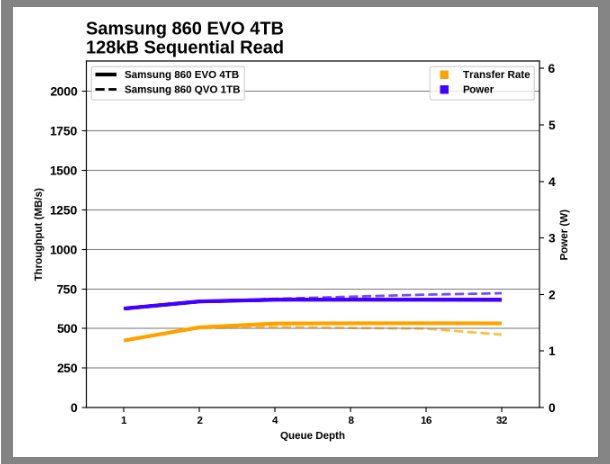
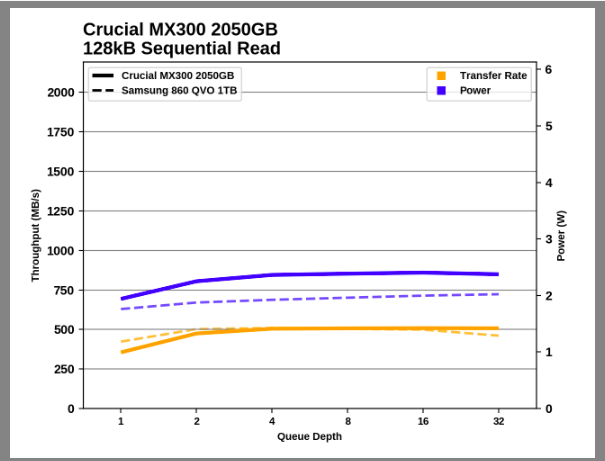
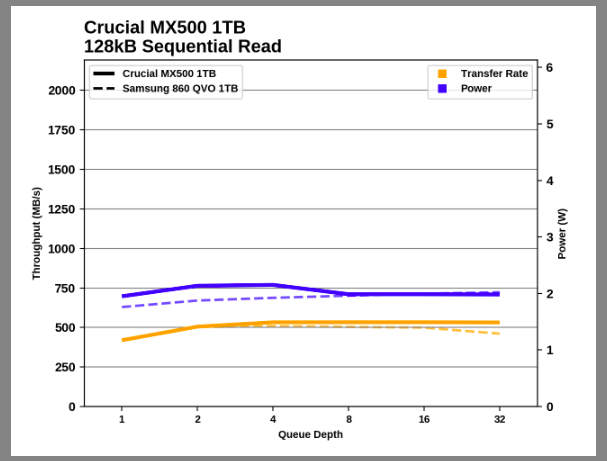
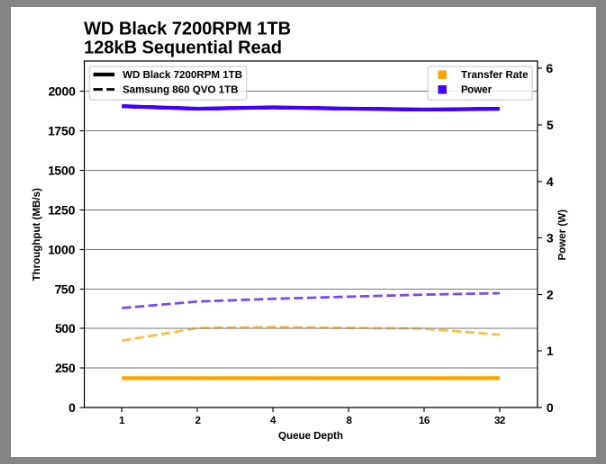
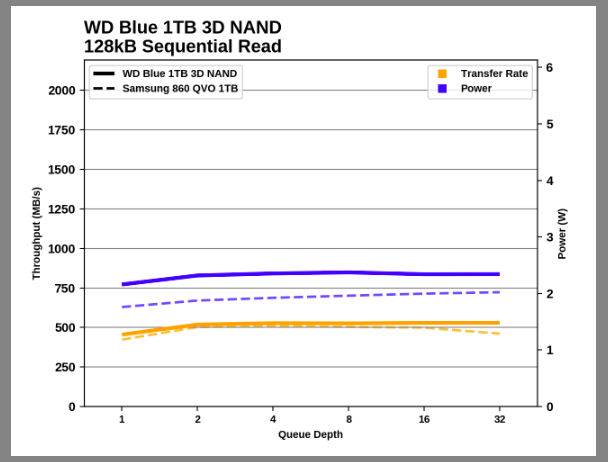
Scaling queue depth for QVO 860 is very typical: QD1 does not quite saturate the SATA channel, but higher queue depths reach almost full speed. The only exception is a slight drop in the Transfer Rate per 1 TB during the last QD32 phase.
In addition to a slight drop in performance on the QD32, sequential reading of the 860 QVO does not go beyond the normal ranges expected from TLC drives.
Sequential write performance
The short-term sequential write test is structured identically to the reading test, except for the direction of data transfer. Each batch of operations records 128 MB, 128 KB operations performed in QD1, a total of 1 GB of data is written to a disk containing 16 GB of data.
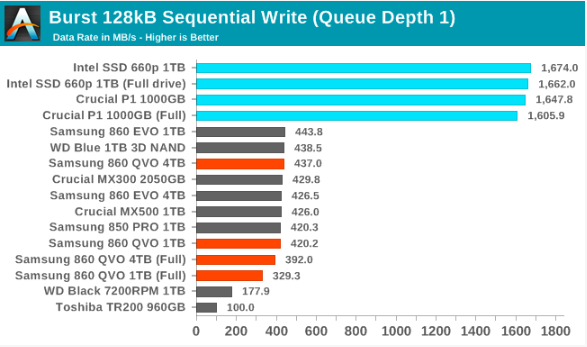
The Samsung 860 QVO does an excellent job with a sequential write test, when the drive is almost empty and there is enough space in the SLC cache. When the drive is full, the speed of the 1 TB model is somewhat reduced, but it is still much higher than that of a mechanical hard disk or a TLC drive without DRAM.
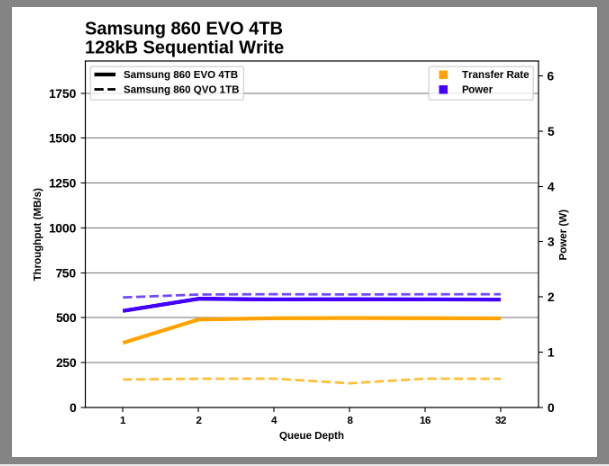
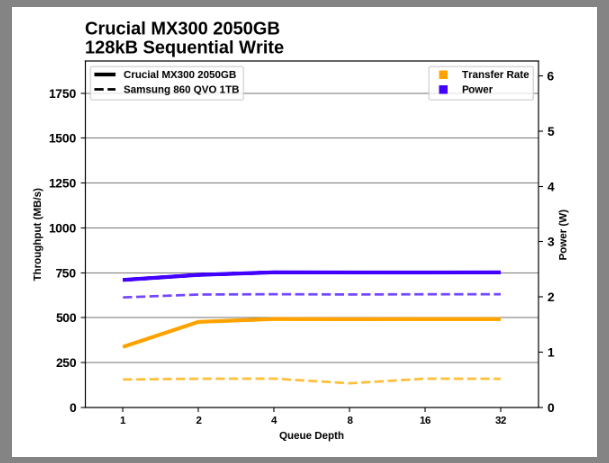
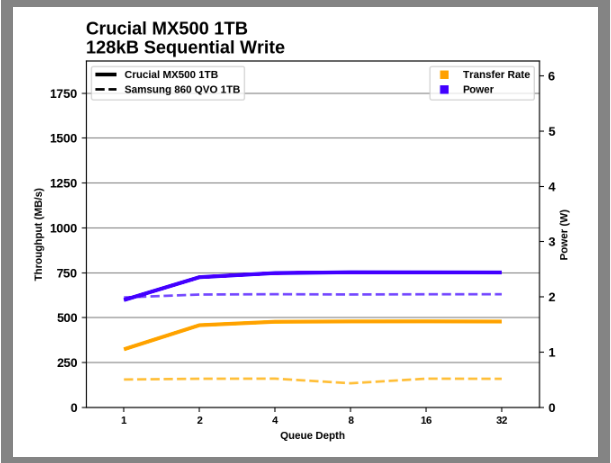
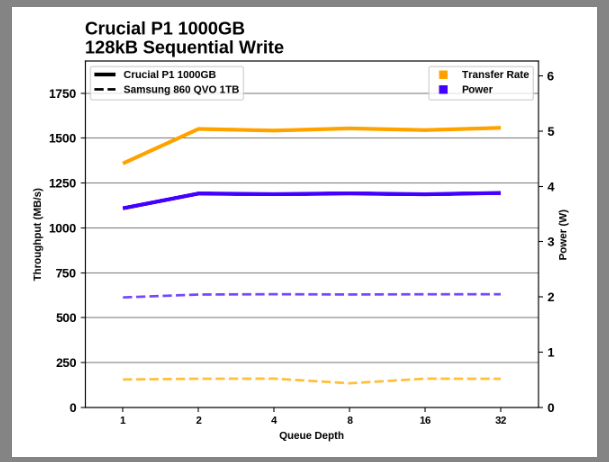
Our test of continuous sequential writing is identical to the second reading test, except for the direction of data transfer. The queue depth varies from 1 to 32, and each queue depth is checked for one minute or before recording 32 GB, after which there is a minute of inactivity when the disk is cooled and performs garbage collection. The test is limited to a disk capacity of 64 GB.
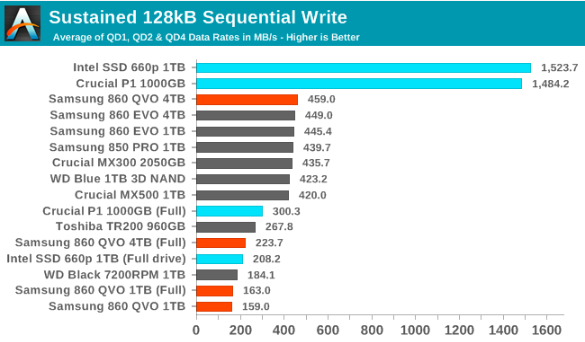
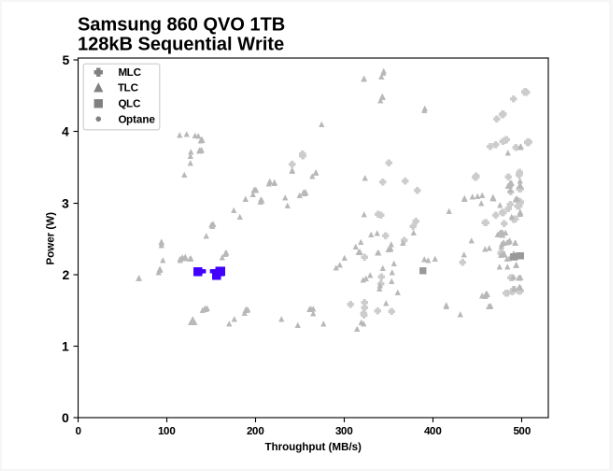
With a long sequential write test, the SLC 1TB 860 QVO cache is no longer sufficient, even if the disk is mostly empty, and it is in the last place. The 4 TB SLC cache holds this test and works just as fast as any SATA drive.
860 QVO is a bit more voracious than 860 EVO, so 4TB QVO ranks only third in efficiency in this group. The efficiency of 1 TB QVO is similar to faster, but more energy-intensive 1 TB drives QLC NVMe from Intel and Micron.
Comparison charts
Samsung 860 QVO 1TB
Samsung 860 QVO 1TB (Full)
Samsung 860 QVO 4TB
Samsung 860 QVO 4TB (Full)
Samsung 850 PRO 1TB
Samsung 850 EVO 1TB
Samsung 850 EVO 4TB
Crucial MX300 2050GB
Crucial MX500 1TB
Crucial P1 1000GB
Crucial P1 1000GB (Fuli)
Intel 660p 1TB
Intel 660p 1TB (Full drive)
Toshiba TR200 960GB
WD Black 7200RPM 1TB
WD Blue1 TB 3D NAND
The 1TB 860 QVO shows a negligible increase in random write performance with increasing queue depth, although the power consumption increases significantly from QD1 to QD2. The 4TB 860 QVO demonstrates a much more typical scaling to saturation in QD4, with a performance curve that almost exactly corresponds to 4TB 860 EVO.
There are SATA TLC SSDs that consume the same power and only have half the performance of a random write of 1 TB 860 QVO. But in the general scheme, the results of 1 TB QVO in this test are not attractive. 4 TB starts there, but ultimately reaches the peak of SATA performance without consuming too much power.
Sequential read performance
In the first test of sequential read performance, 128 MB of short 128 KB operations are written, without a queue. The test averages performance over eight runs, and a total of 1 GB of data is transferred from a disk containing 16 GB of data. Between each package of operations, the drive is given enough downtime to maintain a total duty cycle of 20%.
The performance of the Samsung 860 QVO sequential read is comparable to conventional SSD SATA TLC, and is well ahead of the Toshiba TR200 DRAMless. The 1 TB of QVO 860 is slightly lower when the drive is not full due to the timing of the test: the drive was still flushing the SLC cache in the background when the reading test began.
The next test, continuous sequential reading, uses queue depths from 1 to 32, with performance and consumption figures being calculated as the average QD1, QD2, and QD4. Each queue depth is checked no more than one minute, or before reading 32 GB from a disk containing 64 GB of data. This test is run twice: once from a drive prepared by sequential recording of test data, and again after the random writing test has mixed everything, causing fragmentation within the SSD that is invisible to the OS. These estimates represent the two extremes of how the disk will work in actual use, when leveling wear and modification of existing data will create some internal fragmentation that will degrade performance but not to the degree shown here.
In a lengthy sequential read test, the 860 QVO is close to the SATA speed limit when reading data directly from flash memory. But in cases where internal fragmentation was created by randomly writing to a disk, the QVO reading speed dropped much more than that of TLC disks, and 1 TB of QVO 860 was even slower than a mechanical hard disk.
The energy efficiency of the 860 QVO is only slightly lower than that of TLC drives when reading continuous data. When working with fragmented data, QVO is slightly more efficient than Intel / Micron NVMe QLC drives, albeit a bit slower.
Comparison charts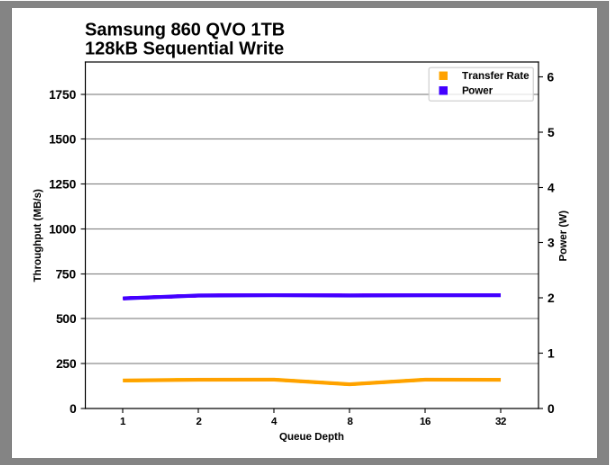
Samsung 860 QVO 1TB
Samsung 860 QVO 1TB (Full)
Samsung 860 QVO 4TB
Samsung 860 QVO 4TB (Full)
Samsung 850 PRO 1TB
Samsung 850 EVO 1TB
Samsung 850 EVO 4TB
Crucial MX300 2050GB
Crucial MX500 1TB
Crucial P1 1000GB
Crucial P1 1000GB (Full)

Intel 660p 1TB
Intel 660p 1TB (Full drive)
Toshiba TR200 960GB

WD Black 7200RPM 1TB
WD Blue1 TB 3D NAND
Samsung 860 QVO 1TB
Samsung 860 QVO 1TB (Full)
Samsung 860 QVO 4TB
Samsung 860 QVO 4TB (Full)
Samsung 850 PRO 1TB
Samsung 850 EVO 1TB
Samsung 850 EVO 4TB
Crucial MX300 2050GB
Crucial MX500 1TB
Crucial P1 1000GB
Crucial P1 1000GB (Full)
Intel 660p 1TB
Intel 660p 1TB (Full drive)
Toshiba TR200 960GB
WD Black 7200RPM 1TB
WD Blue1 TB 3D NAND
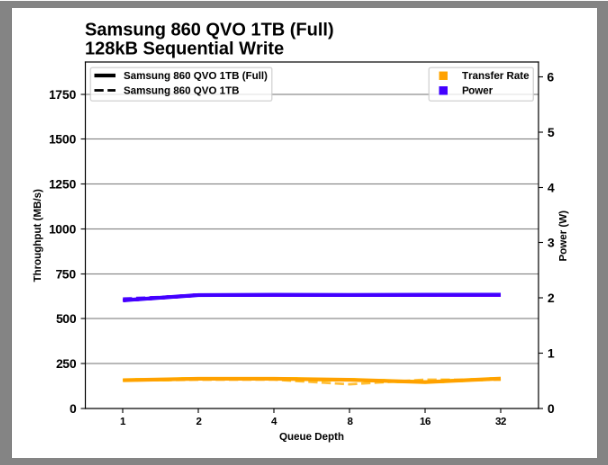
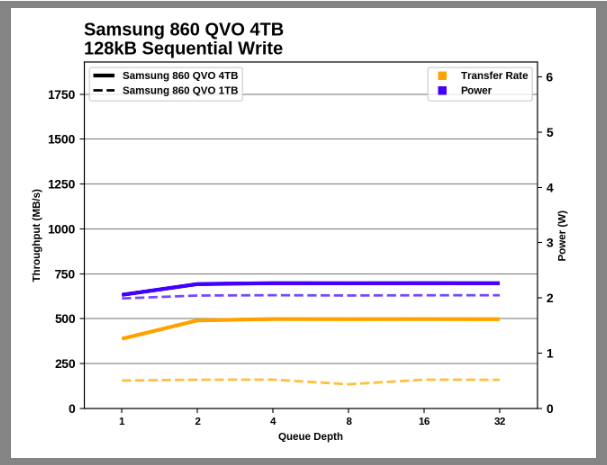
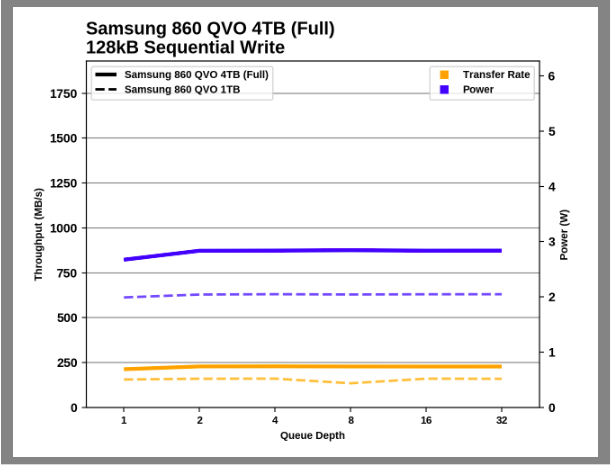
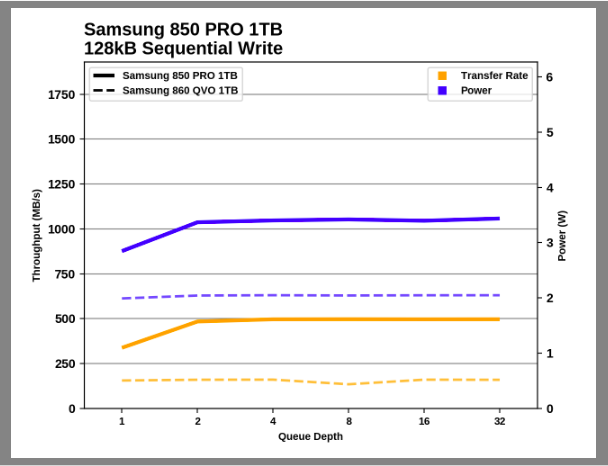
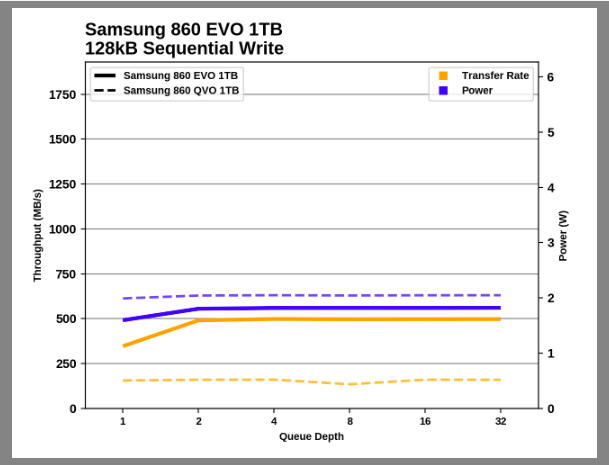
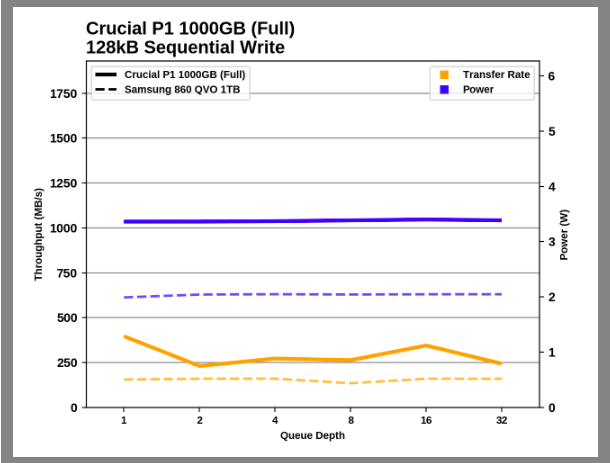
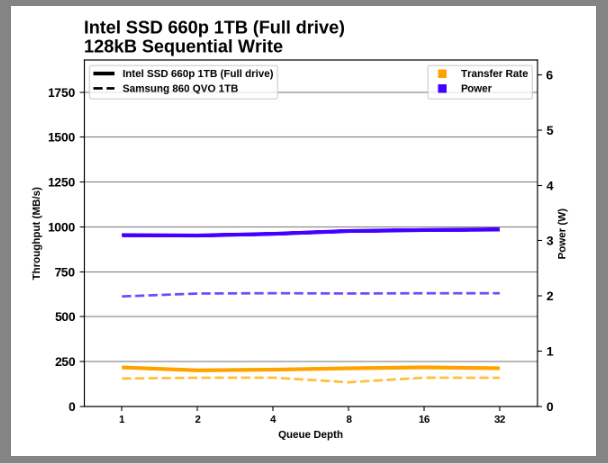
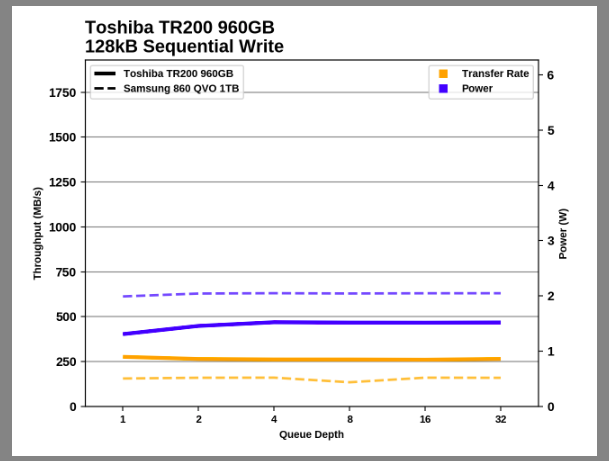
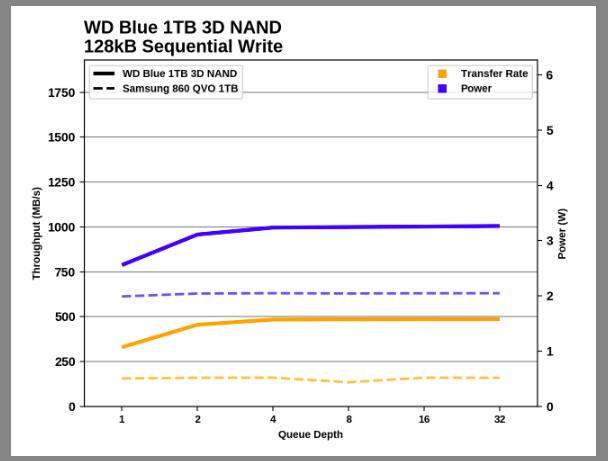
During the sequential test, the 1TB 860 QVO is slow and stable, while the performance of the 4TB model is the same as any other SATA drive.
Sequential write to 1TB 860 QVO is obviously slower than usual, but this is not unprecedented: there were the same slow TLC drives, but most of them had less than 1 TB. Model 4TB looks better in the big picture.
Thank you for staying with us. Do you like our articles? Want to see more interesting materials? Support us by placing an order or recommending to friends, 30% discount for Habr users on a unique analogue of the entry-level servers that we invented for you: The whole truth about VPS (KVM) E5-2650 v4 (6 Cores) 10GB DDR4 240GB SSD 1Gbps from $ 20 or how to share the server? (Options are available with RAID1 and RAID10, up to 24 cores and up to 40GB DDR4).
VPS (KVM) E5-2650 v4 (6 Cores) 10GB DDR4 240GB SSD 1Gbps until January 1 for free if you pay for a period of six months, you can order here .
Dell R730xd 2 times cheaper? Only we have 2 x Intel Dodeca-Core Xeon E5-2650v4 128GB DDR4 6x480GB SSD 1Gbps 100 TV from $ 249 in the Netherlands and the USA! Read about How to build an infrastructure building. class c using servers Dell R730xd E5-2650 v4 worth 9000 euros for a penny?
Source: https://habr.com/ru/post/434744/
All Articles