We respond to cable vandalism quickly, everywhere and without physical traps
Hey.
There is a desire to share with the community an idea that is implemented in the company of the provider for the rapid response to damage to the copper cable. It's about twisted pair and Ethernet. Of course, I do not pretend to the elegance of the solutions, but the service has shown good results.
For those who are too lazy to read. How it works: monitor fall sessions on a radius, group by switches, test the line, helmet notification.
')
I can’t give all the project code for corporate reasons, and the one that is, I’ll remove for those interested in spoilers. Yes, and the implementation of each provider will vary. Fast rather aims to share an idea that might help someone.
The equipment in the company consists of 99% D-link, so the SNMP MIB is listed for this vendor. Some of them are RFCs and should be suitable for other manufacturers.
A little story about what it all came out of.
It all started in the spring of 2018. The load on the technical support group (TP) has increased. In addition to working out subscribers' calls, TP also coordinated installers when connecting new subscribers, as well as when leaving for the restoration and debug of existing customers. It was necessary to slightly unload the TP and give some tools in the hands of installers. It was decided to compose a messenger “bot”, which would accept the subscriber’s login / agreement and the installer, directly in the fields, could produce a minimum debug.
I did not want to insert all the functionality into one application, since in fact, such a functional would be useful to the technical point in the browser in the same CRM when working out a call, so it was decided to bring the mechanisms of interaction with network equipment, billing, radius into a separate service, make it an API and connect via API and bot and CRM, and everything anything.
Now a little code and go to the essence of the post.
And so, what the installer may need in the fields:
We will interact with the switches via SNMP, and in some places via telnet.
I used Bottle as a web framework.
So,
We add a sheet with API keys and decorators for checking, we will not give the data to everyone in a row).
Well, actually a couple of functions to interact with the equipment.
Inside the snmp we have a dictionary with decryption of the returned SNMP statuses of the pair on the port.
Preparation of the dictionary under the result of measurements of the port. We will copy it in order not to make a new one every time.
Function
the function will return
Later I added another similar function, exclusively for the script, it accepts a list of ports as input, and not one, and does not check the status of the port before testing, this is not necessary for a massive drop in links.
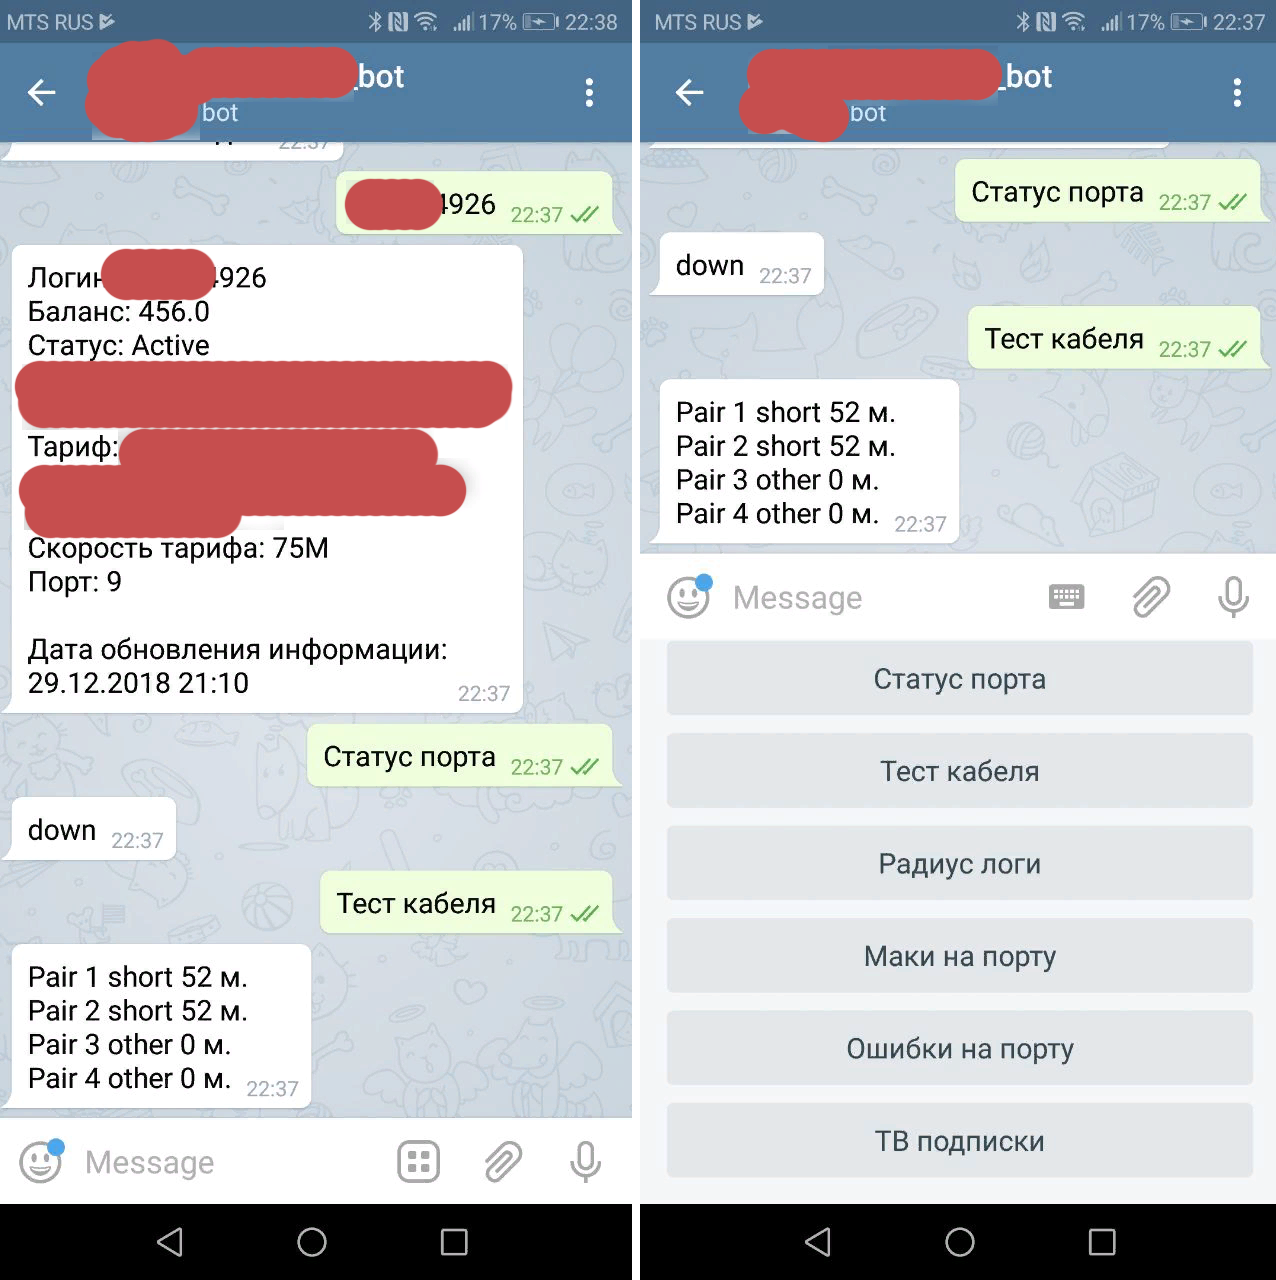
This is how the bot began to look like
Now to the point of the post.
Prior to the debug server implementation, a technology similar to that described in the post habr.com/post/188730 was used . Loop on the port with SNMP trap enabled. When the "slab" on the port fell, the monitoring about the fall in the monitoring.
First of all, I screwed up the script so that when the trace link drops, the debag server went to the switch, checked if the port really lay, and not just blinked, and the pairs on it were open or shorted, and then sent a message to the operators.
However, these physical traps were only about 10% of the switches, but this was not enough.
Later came up with a monitor radius. And this allowed to increase the percentage of monitoring coverage to 100%. And here everything is already different from the infrastructure of the provider.
Periodically we look, how many client sessions from this or that switch fell. It's easy to do this if circuit_id is turned on on the switches, which looks like
D4: CA: 6D: 0A: 66: C9 :: 192.168.20.86 :: 20
Here we have the subscriber's MAC, the IP of the switch, the port number of the subscriber. Those. all you need to debug.
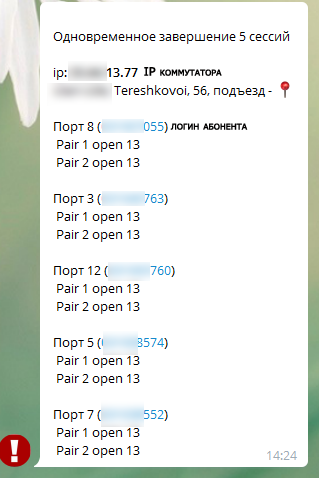
We group completed sessions by IP switch, if there are more such sessions (a trigger is set to 2 sessions per minute), then the script accesses the debug server and tests ports of dropped sessions. If the ports are still lying and cable pairs are open or shorted, and the length is at least two ports the same (+ - 2 meters), and this is how the cable cut looks through the eyes of the switch, then we consider the situation suspicious and send a message to the operator.
Of course there will be false positives when the light blinks in the house, or it’s just the same that the subscribers turn off the cable at the same time and the length will be the same, but this is the case, as they say, when it’s better to perebdet. In addition, you can make a limit on the length (to respond only to short lengths), the number of simultaneous falls, etc.
Here is the real suspicious event message.
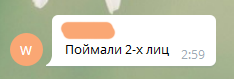
And the results of processing such messages
There was a case when the script sent a similar message, and after a couple of seconds the switch went offline, because damaged optics, and if it were not for the speed of the software, the situation would be taken as a typical power outage in the house.
Another time, the management company, without warning, began to make repairs to the roof and flew to them with automatic guns, a sudden stress for the mechanics.
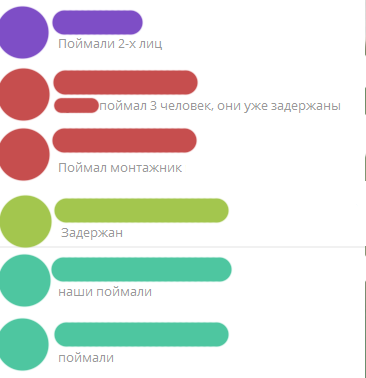
So the script began to show good results and for 4 months of work, the VOKhR, the police, and the provider’s employees successfully completed over 10 cases of vandalism. That's why I decided to share the concept of such monitoring.
Now the script monitors about 15,000 switches without any physical traps and SNMP traps.
Good luck to everyone in the new year!
There is a desire to share with the community an idea that is implemented in the company of the provider for the rapid response to damage to the copper cable. It's about twisted pair and Ethernet. Of course, I do not pretend to the elegance of the solutions, but the service has shown good results.
For those who are too lazy to read. How it works: monitor fall sessions on a radius, group by switches, test the line, helmet notification.
')
I can’t give all the project code for corporate reasons, and the one that is, I’ll remove for those interested in spoilers. Yes, and the implementation of each provider will vary. Fast rather aims to share an idea that might help someone.
The equipment in the company consists of 99% D-link, so the SNMP MIB is listed for this vendor. Some of them are RFCs and should be suitable for other manufacturers.
A little story about what it all came out of.
It all started in the spring of 2018. The load on the technical support group (TP) has increased. In addition to working out subscribers' calls, TP also coordinated installers when connecting new subscribers, as well as when leaving for the restoration and debug of existing customers. It was necessary to slightly unload the TP and give some tools in the hands of installers. It was decided to compose a messenger “bot”, which would accept the subscriber’s login / agreement and the installer, directly in the fields, could produce a minimum debug.
I did not want to insert all the functionality into one application, since in fact, such a functional would be useful to the technical point in the browser in the same CRM when working out a call, so it was decided to bring the mechanisms of interaction with network equipment, billing, radius into a separate service, make it an API and connect via API and bot and CRM, and everything anything.
Now a little code and go to the essence of the post.
And so, what the installer may need in the fields:
- Cable test course
- View port errors
- View port status
- See if there are MAC addresses on the port. (suddenly the subscriber turned on the cable to the LAN port instead of the WAN)
- IPTV subscriptions
- View logs of authorizations
- Balance status
We will interact with the switches via SNMP, and in some places via telnet.
I used Bottle as a web framework.
So,
import the necessary ones
#!/usr/bin/python # -*- coding: utf_8 -*- from bottle import route, run, template, auth_basic, request, error from lib import crm, snmp, gis, billing import time We add a sheet with API keys and decorators for checking, we will not give the data to everyone in a row).
code
apikeys = ['RANDOM_KEY1', 'RANDOM_KEY2'] api_error = '{"error":"apikey invalid"}' host_down_error = '{"error":"host down"}' def apikey_checker(fn): def wrapper(*args, **kwargs): if not check_apikey(): return api_error return fn(*args, **kwargs) return wrapper def check_apikey(): return 'apikey' in request.query and request.query['apikey'] in apikeys Well, actually a couple of functions to interact with the equipment.
code
@route('/port_status/<ip>/<port>') @apikey_checker def get_port_status(ip=' ', port=' '): return snmp.port_status(ip, port) @route('/cable_test/<ip>/<port>') @apikey_checker def get_cable_test(ip, port): return snmp.cable_test(ip, port) Inside the snmp we have a dictionary with decryption of the returned SNMP statuses of the pair on the port.
Status Dictionary
pair_status = { '0': 'ok', '1': 'open', '2': 'short', '3': 'open-short', '4': 'crosstalk', '5': 'unknown', '6': 'count', '7': 'no-cable', '8': 'other' } Preparation of the dictionary under the result of measurements of the port. We will copy it in order not to make a new one every time.
Hidden text
pair_result = { 'pairs': { 1: { 'status': '-', 'length': '-' }, 2: { 'status': '-', 'length': '-' }, 3: { 'status': '-', 'length': '-' }, 4: { 'status': '-', 'length': '-' }, } } Function
cable test
def cable_test(ip, port): if not check_ip(ip): # IP return {'error': "IP %s invalid" % (ip)} host_status = check_host(ip) # if host_status['status'] == 'down': return {'error': u" "} result = copy.deepcopy(pair_result) # , UP, .. # . if port_status(ip, port)['status'] == 'down': try: mib = '.1.3.6.1.4.1.171.12.58.1.1.1.12.%s' % str( port) # # snmp_int_set(ip, mib, 1) time.sleep(1) # result['pairs'][1]['status'] = pair_status[ snmp_get(ip, '.1.3.6.1.4.1.171.12.58.1.1.1.4.%s' % str(port))] result['pairs'][2]['status'] = pair_status[ snmp_get(ip, '.1.3.6.1.4.1.171.12.58.1.1.1.5.%s' % str(port))] result['pairs'][3]['status'] = pair_status[ snmp_get(ip, '.1.3.6.1.4.1.171.12.58.1.1.1.6.%s' % str(port))] result['pairs'][4]['status'] = pair_status[ snmp_get(ip, '.1.3.6.1.4.1.171.12.58.1.1.1.7.%s' % str(port))] result['pairs'][1]['length'] = snmp_get( ip, '.1.3.6.1.4.1.171.12.58.1.1.1.8.%s' % str(port)) result['pairs'][2]['length'] = snmp_get( ip, '.1.3.6.1.4.1.171.12.58.1.1.1.9.%s' % str(port)) result['pairs'][3]['length'] = snmp_get( ip, '.1.3.6.1.4.1.171.12.58.1.1.1.10.%s' % str(port)) result['pairs'][4]['length'] = snmp_get( ip, '.1.3.6.1.4.1.171.12.58.1.1.1.11.%s' % str(port)) return result except Exception as e: print(e) return {'error': u' '} else: return {'error': u' . Link UP.'} the function will return
result
{ "pairs": { "1": { "status": "other", "length": "0" }, "2": { "status": "open", "length": "4" }, "3": { "status": "open", "length": "4" }, "4": { "status": "other", "length": "0" } } } Later I added another similar function, exclusively for the script, it accepts a list of ports as input, and not one, and does not check the status of the port before testing, this is not necessary for a massive drop in links.
This is how the bot began to look like
Now to the point of the post.
Prior to the debug server implementation, a technology similar to that described in the post habr.com/post/188730 was used . Loop on the port with SNMP trap enabled. When the "slab" on the port fell, the monitoring about the fall in the monitoring.
First of all, I screwed up the script so that when the trace link drops, the debag server went to the switch, checked if the port really lay, and not just blinked, and the pairs on it were open or shorted, and then sent a message to the operators.
However, these physical traps were only about 10% of the switches, but this was not enough.
Later came up with a monitor radius. And this allowed to increase the percentage of monitoring coverage to 100%. And here everything is already different from the infrastructure of the provider.
Periodically we look, how many client sessions from this or that switch fell. It's easy to do this if circuit_id is turned on on the switches, which looks like
D4: CA: 6D: 0A: 66: C9 :: 192.168.20.86 :: 20
Here we have the subscriber's MAC, the IP of the switch, the port number of the subscriber. Those. all you need to debug.
We group completed sessions by IP switch, if there are more such sessions (a trigger is set to 2 sessions per minute), then the script accesses the debug server and tests ports of dropped sessions. If the ports are still lying and cable pairs are open or shorted, and the length is at least two ports the same (+ - 2 meters), and this is how the cable cut looks through the eyes of the switch, then we consider the situation suspicious and send a message to the operator.
Of course there will be false positives when the light blinks in the house, or it’s just the same that the subscribers turn off the cable at the same time and the length will be the same, but this is the case, as they say, when it’s better to perebdet. In addition, you can make a limit on the length (to respond only to short lengths), the number of simultaneous falls, etc.
Here is the real suspicious event message.
And the results of processing such messages
There was a case when the script sent a similar message, and after a couple of seconds the switch went offline, because damaged optics, and if it were not for the speed of the software, the situation would be taken as a typical power outage in the house.
Another time, the management company, without warning, began to make repairs to the roof and flew to them with automatic guns, a sudden stress for the mechanics.
So the script began to show good results and for 4 months of work, the VOKhR, the police, and the provider’s employees successfully completed over 10 cases of vandalism. That's why I decided to share the concept of such monitoring.
Now the script monitors about 15,000 switches without any physical traps and SNMP traps.
Good luck to everyone in the new year!
Source: https://habr.com/ru/post/434674/
All Articles