Using machine learning is not difficult. Enough for a week ...

In previous articles, I tried to talk about the basics of pricing and building a buyer's decision tree for classic retail. In this article I will tell you about a very non-standard case and try to convince you that using machine learning is not as difficult as it seems. The article is less technical and rather designed to show that you can start small and this will already bring tangible benefits to the business.
Initial problem
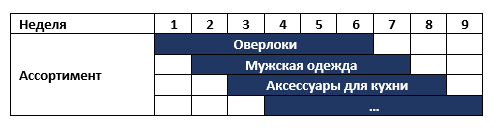
On our continent there is a chain of stores that changes its assortment once a week, for example, it sells overlocks first and then men's sportswear. All unsold goods are sent to warehouses and six months later they are returned to stores again. At the same time in the store there are about 6 different categories of goods. Those. The assortment of stores for each week are as follows:
The network has requested a range planning system with a prerequisite for analytical decision support for category managers. After talking with the business, they proposed two very fast potential solutions that can bring results while the planning system is being deployed:
- sales of goods that are not sold during the main sales
- improving the accuracy of forecasting demand for stores
The first item did not suit the customer - the company is proud of the fact that it does not arrange sales and maintains a constant level of margins. At the same time, huge amounts of money are spent on logistics and storage of goods. As a result, it was decided to improve the accuracy of demand forecasting for more accurate distribution between stores and warehouses.
Current process
Due to the nature of the business, each individual product is not sold for a long time and it is problematic to collect enough history for a classic analysis. The current forecasting process is very simple and is built as follows: a few weeks before the start of the main sales, test sales start on a small part of the stores. According to the results of test sales, a decision is made to introduce goods to the entire network and it is assumed that each store will sell on average the same amount as was sold at test stores.
When we descended to the customer, we analyzed the current data, realized what was happening, and offered a very simple solution to improve the accuracy of the forecast.
Analyzing data
From the data provided to us:
- Transaction data history for 1 year and 2 months
- Product hierarchy for planning. Unfortunately, it almost completely lacked the attributes of goods, but more on that later
- Information about the range and prices for specific weeks
- Information about the cities in which there are shops
We could not in a short time unload information about the balances, which is critical in this kind of analysis (if you do not store this information - start), so later we used the assumption that the goods are on the shelves and there is no shortage of goods.
We immediately set aside 2 months for a test sample to demonstrate the results. Then we put all the available data into one large storefront, clearing them of returns and strange sales (for example, the amount in the check is 0.51 per piece goods). It took several days. After preparing the showcase, we looked at the sale of goods [pcs.] At the highest level and saw the following picture:
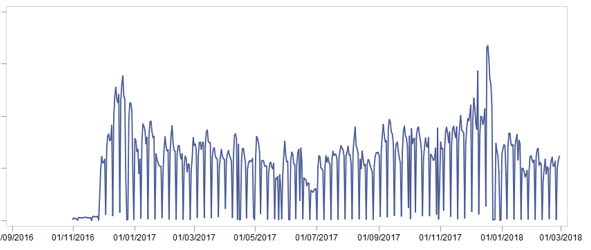
How can this picture help us? .. And this is what:
- Obviously, there is seasonality - sales at the end of the year are higher than in the middle
- There is seasonality within the month - in the middle of the month, sales are higher than at the beginning and at the end
- There is seasonality within the week - it is not so interesting, because as a result, the forecast was based on weeks
The described items confirmed the business. But it is also an excellent feature in order to improve the forecast! Before adding them to the forecasting model, let's think about what other features of sales should be considered ... “obvious” ideas come to mind:
- Sales on average vary between different product groups.
- Sales vary between different stores.
- (Similar to the previous item) Sales vary between different cities
- (A less obvious idea) due to the nature of the business, the following dependence is visible: if the future and the previous assortment are similar, then the sales of the new assortment will be lower.
At this point we decided to stop and build a model.
Building ABT ( analytical base table )
As part of the construction of the model, all the features found were translated into “feature” models. Here is a list of features used as a result:
- current forecast, i.e. average sales of test stores in [pcs.] common to all stores
- month number and week number in month
- all categorical variables (city, store, product categories) were coded with the help of smoothed likelihood (useful technique - who does not use it, take it into service)
- counted lag 4 medium sales product categories. Those. if the company plans to sell the blue jersey, then the lag of the average sales of the jersey category was calculated
ABT turned out to be simple, each parameter was clear to the business and did not cause misunderstanding or rejection. Then it was necessary to understand how we would compare the quality of the forecast.
Metric selection
The customer measured the current prediction accuracy using the MAPE metric. The metric is popular and simple, but it has certain drawbacks when it comes to demand forecasting. The fact is that when using MAPE, forecast errors of the form have the greatest impact on the final indicator:
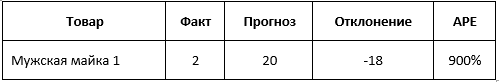
The relative forecast error of 900% seems to be big, but let's look at the sales of another product:
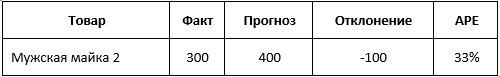
The relative error of the forecast is 33%, which is much less than 900%, but the absolute deviation deviation of 100 [units] is much more important for business than deviation of 18 [units]. To take into account these features, you can come up with your own interesting measures, or you can use another popular measure when forecasting demand - WAPE . This measure gives more weight to goods with higher sales, which is great for the task.
We told the company about various approaches to measuring forecast errors, and the customer readily agreed that using WAPE in this task is more reasonable. After that, we launched Random Forest with virtually no tuning of the hyperparameters and obtained the following results.
results
After forecasting the test period, we compared the predicted values with the actual ones, as well as with the company's forecast. As a result, MAPE decreased by more than 15%, WAPE by more than 10% . Having calculated the impact of the improved forecast on business indicators, it turned out to be a reduction in costs by a very big amount, amounting to millions of dollars.
All work spent 1 week!
Further steps
As a bonus for the customer, we conducted a small DQ experiment. For the same product group from the product names, we distribute the characteristics (color, type of product, composition, etc.) and added them to the forecast. The result was inspiring - in this category, both error measures improved by an additional more than 8%.
As a result, the customer was given a description of each feature, model parameters, assembly parameters of the ABT showcase, and described further steps to improve the forecast (use historical data for more than one year; use balances; use product characteristics, etc.).
Conclusion
In one week of working together with the customer, it was possible to significantly increase the accuracy of forecasting, while practically without changing the business process.
Surely many people now think that this case is very simple and they will not get off with such an approach in the company. Experience shows that there are almost always places where only basic assumptions and expert opinions are used. You can start using machine learning from these places. To do this, you need to carefully prepare and examine the data, talk to the business and try to apply popular models that do not require long tuning. And stacking, embedding features, complex models are all for later. I hope I have convinced you that this is not as difficult as it may seem, you just need to think a little and not be afraid to start.
Do not be afraid of machine learning, look for places where it can be applied in the processes, do not be afraid to explore your data and let consultants come to them and get great results.
PS We recruit in practice young padawan students for internships under the guidance of experienced Jedi. For the start enough common sense and knowledge of SQL, the rest will teach. You can develop into a business expert or technical consultant, depending on what is more interesting. If you have interest or recommendations - write in a personal
')
Source: https://habr.com/ru/post/433896/
All Articles