HomeKit and ioBroker Let's be friends houses

Without a doubt, Apple iOS remains one of the most popular mobile operating systems, which means that modern automation systems must be able to integrate into this ecosystem and provide interoperability. This is the purpose of the Homekit framework, which allows you to work with smart devices from the iPhone / iPad / iWatch screen, and more recently from the Mac (macOS Mojave).
Most automation systems (I don’t like the marketing name "smart home") have long contain integration modules with Homekit, but even a trained user is not always easy to figure out how to make his device accessible in the Home application (or Eve).
Today I will tell you how to do these manipulations in the ioBroker system (this is an open and free automation system). But in order not to stupidly cite all the many examples of devices, I want to explain some principles and show approaches, knowing that, you can easily implement the other examples.
"Knowledge of some principles easily compensates for ignorance of some facts"
Claude Adrian Helvetius
ioBroker. Drivers, devices and states
First of all I want to explain what a device is in the ioBroker system, and how it is presented.
Let me remind you that the ioBroker system is modular, and extension modules are called drivers (or adapters). A driver is an integration module with a device or a group of devices united by a common functionality, protocol or manufacturer, and therefore it can drag one to several devices into the ioBroker system. Another feature is the ability to create multiple instances of the same driver, differing in any settings.
But each device is unique and unique, has different characteristics and capabilities. Based on this, in ioBroker, they are primarily oriented not on the device itself, but on its characteristics, which are represented by states. A state is an internal ioBroker object that accepts and stores any value. Synonyms of the state can be considered: signs, attributes, characteristics, properties, events. Examples of states: "temperature", "brightness level", "battery level", "switch on indicator", "error sign", "click sign", "double click sign", etc. Thus, each device is represented by many different states.

States can be divided into informative - display information from the device, and modifiable - can be changed by the user or the script and send these changes to the device. Accordingly, when something changes on the device — this data is displayed in states, and when ioBroker changes state (by user or script), the device receives a signal about the change and must respond accordingly (this depends on the device itself and the driver that is with it works).
All device states are combined into a single tree (registry) of states. They are grouped first by device (in some cases, grouping by channel is also applied), and then by driver instances.
The concept of topics of the MQTT protocol easily falls into such a state tree. In this way, you can connect additional equipment or third-party systems that support the MQTT-protocol. Just put the MQTT driver - the corresponding branch will appear in the state tree.
And then there are all sorts of online services that can provide useful information and / or give the ability to control other equipment (car alarms, for example). The result of interaction with these services is also represented as a set of states.

Thus, a device in ioBroker is represented as a set of states characterizing the device and allowing it to interact with it.
Homekit. Accessories, services and specifications
Now turn to Homekit. Here, a classification of devices, their functionality and characteristics is applied.

Accessories are the equivalent of a physical device. The accessory has a category for assigning it to a specific group.
Services (Services) is the equivalent of the functionality that the accessory has. One accessory may have several services.
Services indicate the capabilities of the device: lamp, battery, button, air quality sensor, door, air cleaner, camera ..
It is the service that determines the display, behavior of the device and a set of characteristics.
Characteristics is the equivalent of the attributes / properties that characterize the service. It is the characteristics that determine whether the device is on, the brightness level of the lamp, or how many times a button is pressed. One service can have many characteristics.

Applications that work with Homekit read the services and features of the accessories, and then display and let them change the values in the characteristics through the user interface. The modified values are sent to the Homekit devices to apply them, and from the Homekit devices, respectively, the values of the characteristics are also sent with some changes from the device side.
Total, the device in HomeKit is an accessory with a set of services and features.
Yahka Dock concept
IoBroker uses the Yahka driver to work with Homekit ( additional modules must be installed before installation) - add-on above the well-known library https://github.com/KhaosT/HAP-NodeJS , on which the popular HomeBridge project is also built. This library is designed to create a virtual gateway / bridge that provides a set of virtual devices in HomeKit. Configuring the virtual devices and services accordingly, setting the values of the characteristics - we will get the finished device in Homekit and the Home application, and we can also ask Siri to manage it.
The Yahka driver is precisely designed to set up accessories, add services to them, and indicate compliance of characteristics (HomeKit) and states (ioBroker).
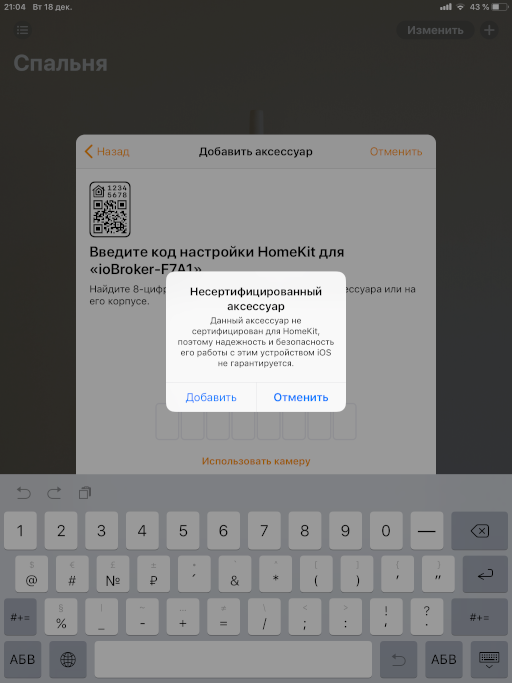
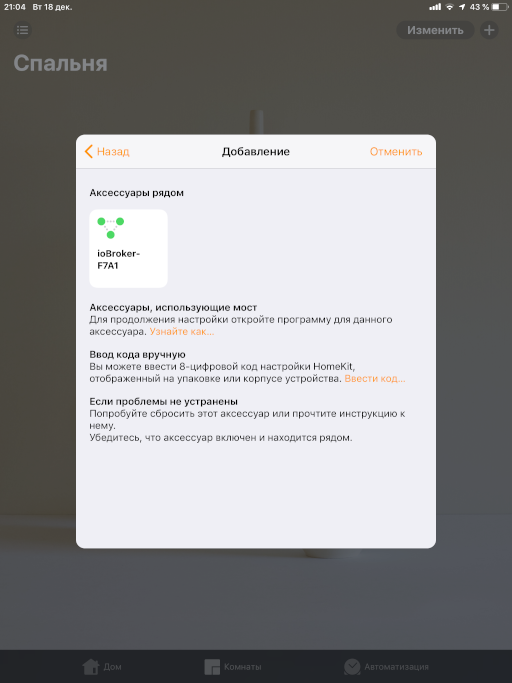
But first, after installation, you need to configure the gateway and bring it into the Home application. After configuration, all devices added to the gateway will be automatically added to Home. To do this, you must specify the "Device Name" (it is desirable to specify only Latin letters) and remember the pin code (or specify your own).

Now we will deal with devices. Everything would be fine if the state set for the device in ioBroker uniquely corresponded to the set of services and features in HomeKit. And it would be even better if the values in the states were suitable for the values of the characteristics. But often this is not the case, and you have to invent unusual ways of docking. I will tell about some of them below, and you will have to implement all other options yourself, “in the image and likeness”.
For convenience, I created a document with the translation of services and types, as well as possible values of characteristics. All types and services used correspond to the HAP-NodeJS library .
temperature sensor
This is the simplest example - you just have one state that contains a numerical value of temperature. It can be obtained from anywhere: from sensors or from Internet services (weather).
You need to add a device of the Sensor category, and add a TemperatureSensor service to the device, and give a name to this service. This service has 5 characteristics, of which the most important for us is CurrentTemperature (Current Temperature).


It is enough to indicate in the characteristic CurrentTemperature the name of the state corresponding to the temperature.
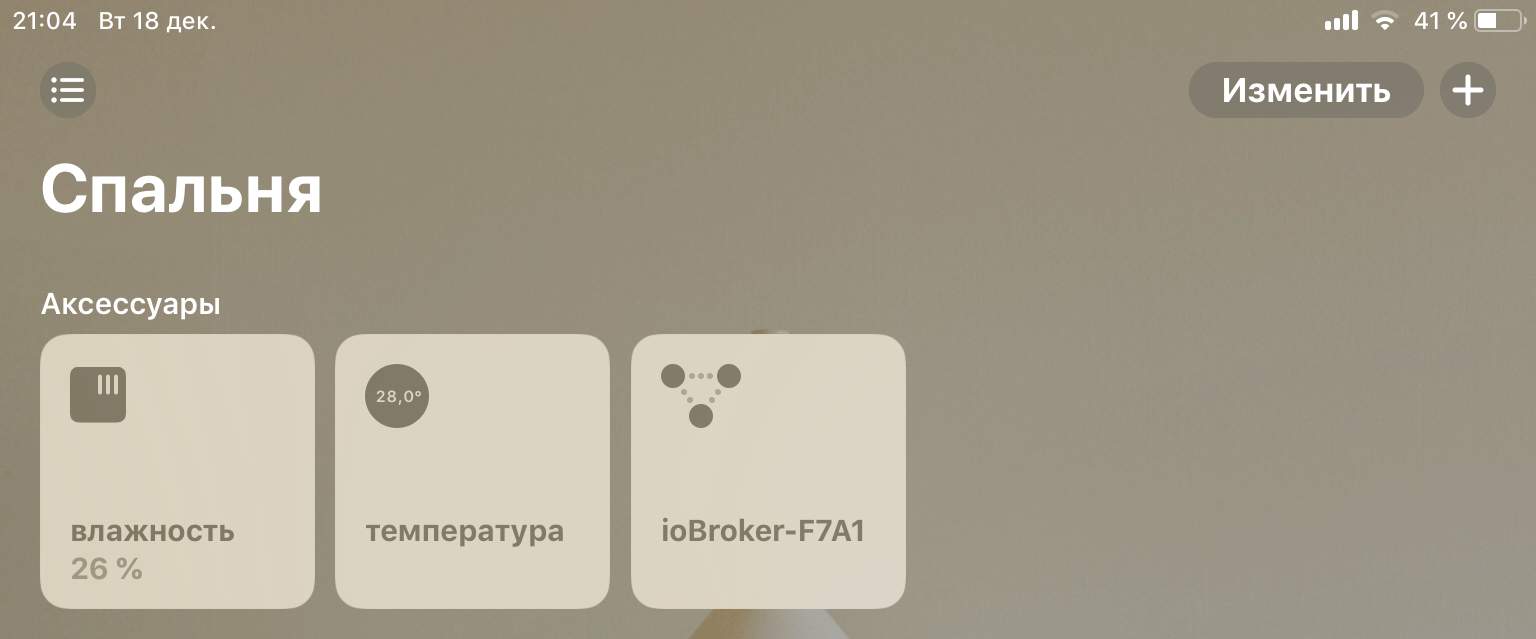
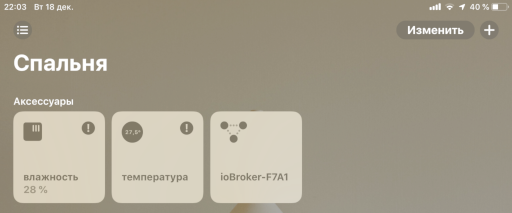
We’ll also add the Humidity Sensor humidity service here, and a separate accessory icon will be created in Homekit.

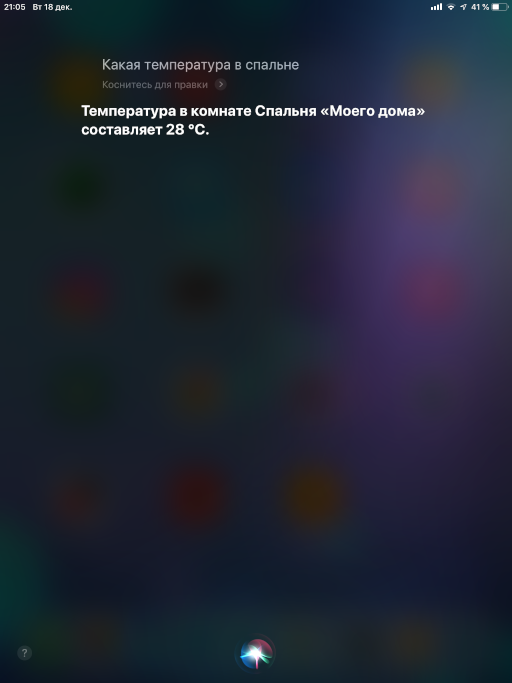
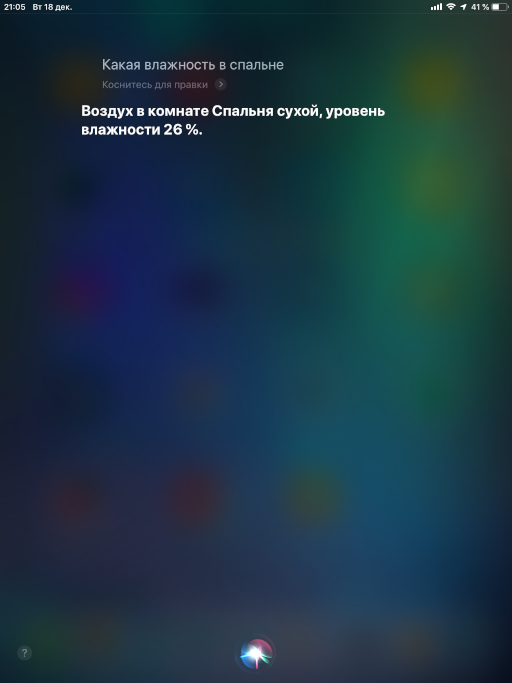
Save, and everything is ready. Now you can contact Siri and ask her about the temperature and humidity.
Battery
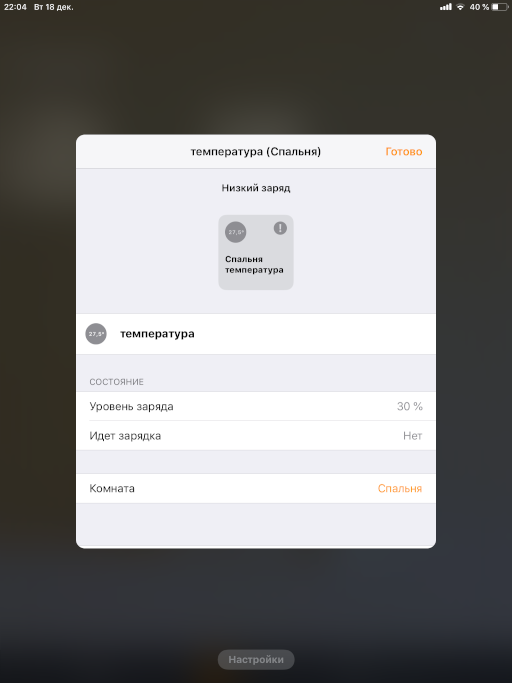
Another simple service. Its feature is that it can be added to almost any accessory. We add the BatteryService service and indicate in the BatteryLevel characteristic a state containing the battery charge percentage. After that, the data on the charge will appear in the additional data about the device.

You can also set the “low charge” feature (the StatusLowBattery characteristic), if the value of the specified state is 1, then the corresponding icon will be displayed on the device image.
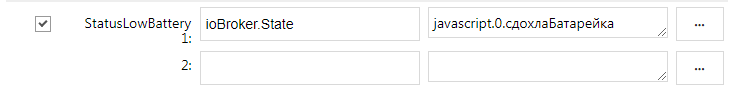
But what to do if you do not have such a state, and you want to see the low charge icon? You need to create this state manually or by a script, and specify the created state in the characteristics.
Now it remains only to correctly set the value true in this state. For this we will use the script - it will set the value to true when the battery reaches 30 percent.
createState(""); on({id: "zigbee.0.00158d0001f41725.battery", change: "ne"}, function (obj) { var value = obj.state.val; setState("javascript.0.", (value <= 30)); }); After the first launch, the script will create a state, and it can be selected in the characteristics.
This sign will be displayed on the images of accessories.
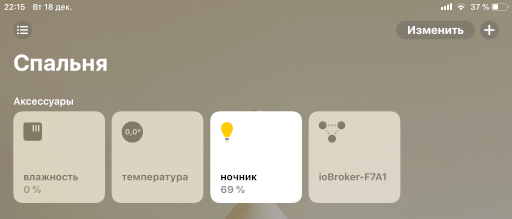
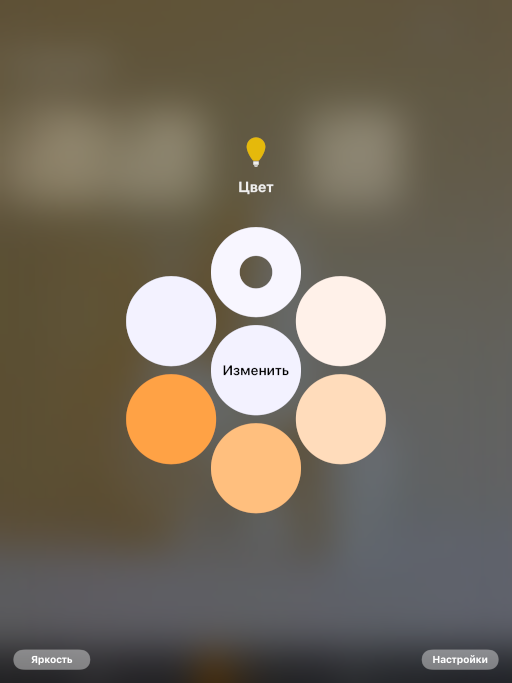
Lamps
Light bulbs are different - bright, warm, red. There are 4 cases:
- Simple - controlled by "on" and "off"
- Dimmable - also controlled by the brightness level
- With temperature - it is possible to control the temperature of the glow
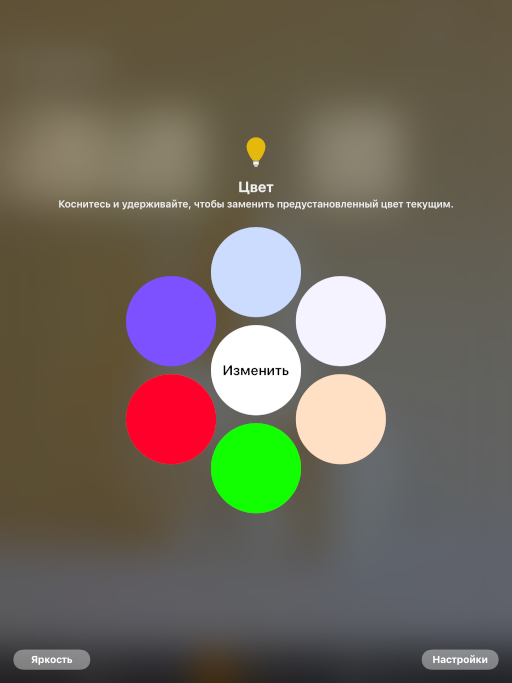
- Colored - it is possible to control the color of the glow
For each of these cases, there is a corresponding characteristic in the Lightbulb service:
- On - on / off
- Brightness - brightness level
- Hue - shade
- Saturation - saturation
- ColorTemperature - color temperature
In the simple case, in the "On" characteristic, we indicate the state responsible for switching on and off.
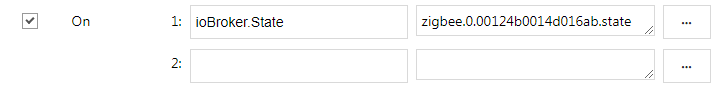
If the lamp is dimmable, then additionally indicate the state with the level of brightness.
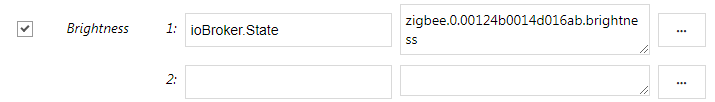
In addition to the assignment of correct states, it is important to observe the interval of acceptable values!
Example: in some cases, the state responsible for the brightness of the lamp can take values from 0 to 255, but in Homekit these values are limited to an interval from 0 to 100. For this case, you can use the transformation functions of the Yahka driver. The function "level255" just converts the interval of values 0..255 into the interval 0..100 (and vice versa).
The following difficulties may arise if your lamp is colored, but the color is RGB. These can be either three different states or one number (or a string). In this case, you will need to do a conversion from one RGB color space to another XYB space (this space is used by HomeKit), or to the XY plane.
To do this, you need to make 2 new states (Hue and Saturation), into which we will convert the values from the RGB state and back.
// createState("Hue"); createState("Sat"); // RGB- on({id: "Hue", ack: false, change: 'any'}, function (obj) { var hue = parseInt(obj.state.val); var sat = parseInt(getState('Sat').val); var res = hsvToRgb(hue, sat, 100); setRGB(parseInt(res[0]), parseInt(res[1]), parseInt(res[2])); }); // RGB- function setRGB(r, g, b){ var val = ('00'+r.toString(16)).slice(-2)+('00'+g.toString(16)).slice(-2)+('00'+b.toString(16)).slice(-2); // RGB- setState('zigbee.0.00124b0014d016ab.color', val, false); } // HSV RGB function hsvToRgb(h, s, v) { var r, g, b; var i; var f, p, q, t; h = Math.max(0, Math.min(360, h)); s = Math.max(0, Math.min(100, s)); v = Math.max(0, Math.min(100, v)); s /= 100; v /= 100; if(s == 0) { r = g = b = v; return [ Math.round(r * 255), Math.round(g * 255), Math.round(b * 255) ]; } h /= 60; i = Math.floor(h); f = h - i; p = v * (1 - s); q = v * (1 - s * f); t = v * (1 - s * (1 - f)); switch(i) { case 0: r = v; g = t; b = p; break; case 1: r = q; g = v; b = p; break; case 2: r = p; g = v; b = t; break; case 3: r = p; g = q; b = v; break; case 4: r = t; g = p; b = v; break; default: // case 5: r = v; g = p; b = q; } return [ Math.round(r * 255), Math.round(g * 255), Math.round(b * 255) ]; } You can do more easily with the color temperature - if you know the range of available values for your lamp, then you can convert it to the range available for HomeKit (via the scaleInt function).

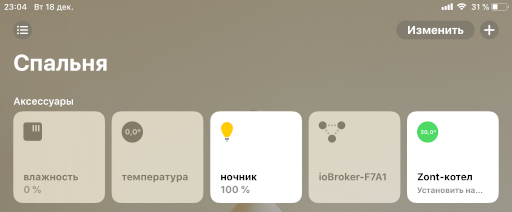
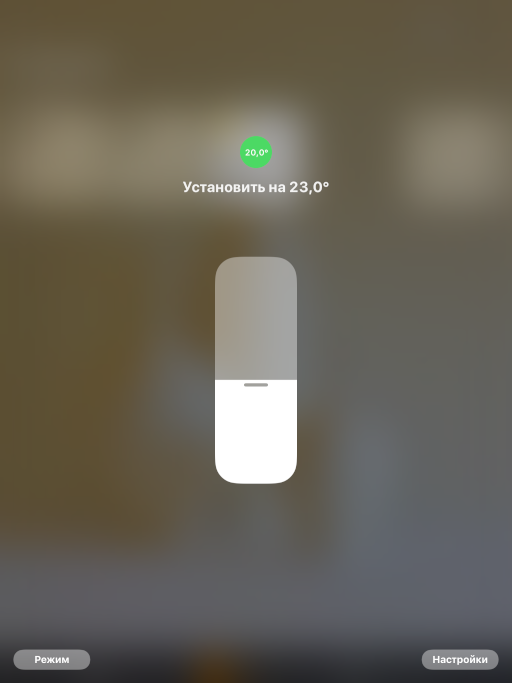
Thermostat
Thermostat - a device for maintaining the set temperature (service Thermostat). Accordingly, the main characteristic of the thermostat is the desired temperature (TargetTemperature). In addition to the set temperature, the current temperature (CurrentTemperature) can be indicated, which is informational (as the device only reads it from the sensors).
From the House application in the thermostat, the target temperature is set and the current temperature is monitored. In my thermostat (Zont) there were just these two states - they were accessible through the service cloud api.
For the beauty of the device display in HomeKit, we had to add a couple of constants: the current state of heating is active (1), the target state of heating is automatic (3).

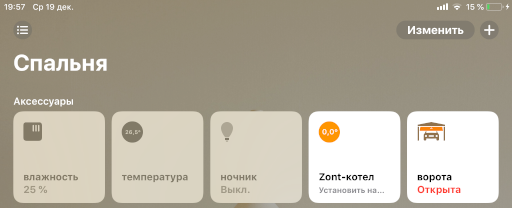
Goal
With garage doors (GarageDoorOpener service) everything is trickier than with a thermostat.
Of the available characteristics, the gate has a target state (TargetDoorState), which indicates our desire for the gate to be “open” or “closed”. But you also need to correctly display the current state of the gate (CurrentDoorState): are they open or closed, or maybe they open or close?
In my case, the gate was opened through mqtt in ioBroker by several information states:
- sign of openness of the gate
- sign of the movement of the gate (DV)

Thanks to these states, you can calculate the current status of the gate:
- if there is no OB and there is no DV, then the gate is closed
- if there is no OB and there is DV, then the gate opens
- if there is an agent and there is no DV, then the gate is open
- if there is an agent and there is a Far East, then the gate is closed
To send a signal for opening and closing the gate, I have two separate states (I could manage with one state, but I have two), which send a message via mqtt to the gate control controller:
- opening signal
- close signal
To send a signal, you need to simulate the "pressing" of the button: set the value to true, and after a while reset it to false. In this regard, for integration with HomeKit, we had to create another state - the “target state of the gate”, which, if changed, would send the corresponding signal.
A sign of the openness of the gate can be replaced with a target state (i.e., what the gate will strive for):
- if the CA is "closed" and there is no Far East, then the gate is closed
- if the CA is "closed" and is LW, then the gate opens
- if CA is “open” and there is no Far East, then the gate is open
- if the CA is "open" and is LW, then the gate is closed
We will also create a separate state “the current state of the gate”, and we will fill it in the script depending on the value of the signs and on the target state.
createState("gate_0.current"); // createState("gate_0.target"); // // 0, 300 on({id: "mqtt.0.gate.gpio.13", ack: false, val: 1}, function (obj) { setStateDelayed("mqtt.0.gate.gpio.13", 0, 300); }); on({id: "mqtt.0.gate.gpio.12", ack: false, val: 1}, function (obj) { setStateDelayed("mqtt.0.gate.gpio.12", 0, 300); }); // on({id: "mqtt.0.gate.is_open", ack: false, val: 1}, function (obj) { // "" setState("javascript.0.gate_0.current", 0, true); }); on({id: "mqtt.0.gate.is_open", ack: false, val: 0}, function (obj) { // "" setState("javascript.0.gate_0.current", 1, true); }); // - , on({id: "javascript.0.gate_0.target", ack: false, val: 0}, function (obj) { setState("mqtt.0.gate.gpio.12", 1); }); // - , on({id: "javascript.0.gate_0.target", ack: false, val: 1}, function (obj) { setState("mqtt.0.gate.gpio.13", 1); }); on({id: "mqtt.0.gate.in_progress", ack: true, change: 'any'}, function (obj) { // " ", if (obj.state.val === 1) { // "", const target = getState("javascript.0.gate_0.target"); if (target.val === 0) { // "" setState("javascript.0.gate_0.current", 2, true); } else { // "" setState("javascript.0.gate_0.current", 3, true); } } // " ", if (obj.state.val === 0) { // "", const target = getState("javascript.0.gate_0.target"); if (target.val === 0) { // "" setState("javascript.0.gate_0.current", 0, true); } else { // "" setState("javascript.0.gate_0.current", 1, true); } } }); After running the script, you can configure the characteristics of the service of garage doors:

Camera
To add a camera to HomeKit, the "classic" method will be used. An image broadcast from the camera is organized via the ffmpeg module. Through it, the input stream will be encoded, encrypted and sent to Homekit.
First you need to install ffmpeg on the server where ioBroker is located.
For each platform, it is placed differently, you can build it from source, or you can search for a ready-made assembly, for example, here: https://www.johnvansickle.com/ffmpeg/ A libx264 encoder is required. You can check the presence of an encoder after installing ffmpeg with the command:
ffmpeg -codecs | grep 264 The results should contain a string like:
DEV.LS h264 H.264 / AVC / MPEG-4 AVC / MPEG-4 part 10 (decoders: h264 h264_v4l2m2m h264_vdpau ) (encoders: libx264 libx264rgb h264_v4l2m2m ) For Raspberry Pi 3, you can use a ready-made assembly , in which there is a codec with support for hardware encoding of the GPU (h264_omx, consumes less resources). Put so:
wget https://github.com/legotheboss/YouTube-files/raw/master/ffmpeg_3.1.4-1_armhf.deb sudo dpkg -i ffmpeg_3.1.4-1_armhf.deb Both codecs are present in this build: libx264 and h264_omx
Next, you need to get the address of the camera stream, which must be translated (this step is beyond the scope of this article). For example, you can take a ready-made public stream .
Now we add the camera to Yahka, specify the stream address, and if necessary, change the codec parameters, image size, frame rate.
Important: Parameter combinations are very important for correct display of the camera in Homekit and depend on the camera and the stream. It also affects system performance, because running ffmpeg process takes a lot of resources.


Bonus
As a bonus, I will talk about the unusual use of camera broadcast.
Using the very same ffmpeg, instead of the camera, you can try to broadcast an image, any picture. These pictures can also be merged with the video stream. The image can display text, graphics and other information.

As a result, you can get an interesting dashboard. And if you update the picture periodically, you get dynamic data.
As an example, I displayed a graph of changes in some indicators in the form of a picture (file on disk). This schedule is updated once per minute and overwrites the image in the file.
I'll tell you how you can get a graph in the form of a picture.
IoBroker has a standard graphing method - the Flot driver. This driver is paired with the Web driver and displays the result in a browser. But in order to get the created graph on the server (in the script) in the form of a picture, an additional PhantomJS driver is needed, which makes a “screenshot” of the page (on which we will draw a Flot graph).
But I will talk about an alternative way of plotting graphs on a server in a script.
There is such a library Chart.js http://www.chartjs.org/ which allows you to draw nice-looking graphics in the browser (examples http://www.chartjs.org/samples/latest/ ).
For drawing it uses the “canvas” (canvas, canvas) of the browser. Therefore, to draw using this library on the server, you need to use the “server” version of the “canvas” and DOM objects. This is what the chartjs-node package does ( https://github.com/vmpowerio/chartjs-node ).
The main dependency for this package is the canvas package ( https://github.com/Automattic/node-canvas ), which should be installed globally (or in the iobroker folder). It is important to install all the dependencies for the platform where you put https://github.com/Automattic/node-canvas#compiling .
After that, in the javascript driver settings, add the modules chart.js, chartjs-node. They should be installed correctly, without errors. Otherwise, deal with errors and solve them.
And then, you can write a script.
Below is a script for an example, since it includes the use of the History driver and uses specific state names.
Attention! The script has a complex for beginners design - Promise. This is a convenient way to not write functions with callback, but to make chains of steps. For example, it is convenient to do this to obtain data from the history of states.
'use strict'; const ChartjsNode = require('chartjs-node'); /** * sendTo Promise, */ function sendToPromise(adapter, cmd, params) { return new Promise((resolve, reject) => { sendTo(adapter, cmd, params, (result) => { resolve(result); }); }); } // const chartColors = { black: 'rgb(0, 0, 0)', red: 'rgb(255, 99, 132)', orange: 'rgb(255, 159, 64)', yellow: 'rgb(255, 205, 86)', green: 'rgb(75, 192, 192)', blue: 'rgb(54, 162, 235)', purple: 'rgb(153, 102, 255)', grey: 'rgb(201, 203, 207)' }; /** * * : * @param config - * @param filename - * : * @param Promise - */ function doDraw(config, filename) { // 640x480 var chartNode = new ChartjsNode(640, 480); return chartNode.drawChart(config) .then(() => { // return chartNode.writeImageToFile('image/png', filename); }); } /** * ChartJS. * : * @param Promise - */ function prepareDraw0(){ // , var ; // Promise return new Promise((resolve, reject)=>{resolve()}) // , .then(()=>{ // , , = [ {"val":3,"ack":1,"ts":1539063874301}, {"val":5,"ack":1,"ts":1539063884299}, {"val":5.3,"ack":1,"ts":1539063894299}, {"val":3.39,"ack":1,"ts":1539063904301}, {"val":5.6,"ack":1,"ts":1539063914300}, {"val":-1.3,"ack":1,"ts":1539063924300}, {"val":-6.3,"ack":1,"ts":1539063934302}, {"val":1.23,"ack":1,"ts":1539063944301}, ]; }) // - .then(()=>{ const chartJsOptions = { // - type: 'line', data: { // datasets: [ { // label: '', // backgroundColor: chartColors.black, borderColor: chartColors.black, // pointRadius: 3, // borderWidth: 3, // '' data: .map((item) => { return {y: item.val, t: new Date(item.ts)} }), // - fill: false, } ] }, options: { // legend: { labels: { // fontSize: 20, }, }, // scales: { // X xAxes: [{ // - type: 'time', display: true, // scaleLabel: { display: true, labelString: '' }, }], // Y yAxes: [{ // - type: 'linear', display: true, // scaleLabel: { display: true, labelString: '' }, }] } } }; return chartJsOptions; }); } /** * ChartJS. * , * . * * : * @param hours - , * : * @param Promise - */ function prepareDraw1(hours){ // , const end = new Date().getTime(), start = end - 3600000*(hours || 1); // 1 = // , // var , 2, 1, 2, 2; // Promise return new Promise((resolve, reject)=>{resolve()}) // 'mqtt.0.ESP_Easy..Temperature' .then(() => { return sendToPromise('history.0', 'getHistory', { id: 'mqtt.0.ESP_Easy..Temperature', options: { start: start, end: end, aggregate: 'onchange' } } ).then((result) => { // '' = result.result; }); }) // 'sonoff.0.chicken2.DS18B20_Temperature' .then(() => { return sendToPromise('history.0', 'getHistory', { id: 'sonoff.0.chicken2.DS18B20_Temperature', options: { start: start, end: end, aggregate: 'onchange' } }).then((result)=>{ // '2' 2 = result.result; }); }) .then(() => { return sendToPromise('history.0', 'getHistory', { id: 'sonoff.0.sonoff_chicken_vent.DS18B20_Temperature', options: { start: start, end: end, aggregate: 'onchange' } }).then((result)=>{ 1 = result.result; }); }) .then(() => { return sendToPromise('history.0', 'getHistory', { id: 'sonoff.0.chicken2.POWER1', options: { start: start, end: end, aggregate: 'onchange' } }).then((result)=>{ 2 = result.result; }); }) .then(() => { return sendToPromise('history.0', 'getHistory', { id: 'sonoff.0.chicken2.POWER2', options: { start: start, end: end, aggregate: 'onchange' } }).then((result)=>{ 2 = result.result; }); }) // - .then(()=>{ const chartJsOptions = { // - type: 'line', data: { // datasets: [ { // label: ' ('+[.length - 1].val+')', // backgroundColor: chartColors.blue, borderColor: chartColors.blue, // . 0 - pointRadius: 0, // borderWidth: 3, // '' data: .map((item) => { return {y: item.val, t: new Date(item.ts)} }), // - fill: false, // Y yAxisID: 'y-axis-1', },{ label: ' 1 ('+1[1.length - 1].val+')', backgroundColor: chartColors.green, borderColor: chartColors.green, pointRadius: 0, borderWidth: 3, data: 1.map((item) => { return {y: item.val, t: new Date(item.ts)} }), fill: false, yAxisID: 'y-axis-1', },{ label: ' 2 ('+2[2.length - 1].val+')', backgroundColor: chartColors.red, borderColor: chartColors.red, pointRadius: 0, borderWidth: 3, data: 2.map((item) => { return {y: item.val, t: new Date(item.ts)} }), fill: false, yAxisID: 'y-axis-1', },{ label: ' 2 ('+2[2.length - 1].val+')', backgroundColor: chartColors.yellow, borderColor: chartColors.yellow, pointRadius: 0, borderWidth: 1, data: 2.map((item) => { return {y: (item.val) ? 1 : 0, t: new Date(item.ts)} }), fill: true, lineTension: 0, steppedLine: true, yAxisID: 'y-axis-2', },{ label: ' 2 ('+2[2.length - 1].val+')', backgroundColor: chartColors.grey, borderColor: chartColors.grey, pointRadius: 0, borderWidth: 1, data: 2.map((item) => { return {y: (item.val) ? -1 : 0, t: new Date(item.ts)} }), fill: true, lineTension: 0, steppedLine: true, yAxisID: 'y-axis-2', } ] }, options: { // legend: { labels: { // fontSize: 20, }, }, // scales: { // X xAxes: [{ // - type: 'time', display: true, // scaleLabel: { display: true, labelString: '' }, // () time: { unit: 'minute', displayFormats: { minute: 'HH:mm' } }, }], // Y yAxes: [{ // - type: 'linear', display: true, // scaleLabel: { display: true, labelString: '' }, // - position: 'left', // id: 'y-axis-1', },{ type: 'linear', display: true, scaleLabel: { display: true, labelString: ' ' }, ticks: { min: -4, max: 2 }, // - position: 'right', id: 'y-axis-2', }] } } }; return chartJsOptions; }); } function createImage(filename, callback){ // filename - , // prepareDraw1(2) // .then((result) => { // return doDraw(result, filename); }) .then(()=>{ if (callback) callback(); }) .catch((err)=>{ console.error(err); }); } 
The thumbnail image is updated about once per minute, so let's set the update to be done once every 10 seconds:
var fs = require('fs'); // 10 schedule("*/10 * * * * *", () => { createImage1('/tmp/1_new.jpg', ()=> { fs.renameSync('/tmp/1_new.jpg', '/tmp/1.jpg'); }); createImage2('/tmp/2_new.jpg', ()=> { fs.renameSync('/tmp/2_new.jpg', '/tmp/2.jpg'); }); }); The peculiarity is that in the process of image broadcasting, it is necessary to replace the image quickly enough so that ffmpeg does not collapse :) Therefore, the image is first formed into one file, and then the file is renamed to the one used for translation.
Now in the camera settings, we specify the name of the file being formed instead of the stream address, and add the settings that the image is "updated" (the "-loop 1" parameter). This is configured in the advanced properties of the camera. These properties are nothing more than command line options for running ffmpeg. Therefore, combinations of parameters should be sought in the ffmpeg documentation and examples.
Properties are divided into 2 types: for getting a "preview" (small image of the camera) and for broadcasting. Therefore, you can specify different image source files, for example, with different details.


Conclusion
ioBroker . , . , , .
, Yahka , Material. , HomeKit.
Yahka, HomeKit — Ham, HomeBridge . .
')
Source: https://habr.com/ru/post/433798/
All Articles