Performance checks and gradual degradation of distributed systems

As always, thanks to Fred Hebert and Sargun Dhillon for reading the draft of this article and offering some invaluable advice.
In her report on speed, Tamar Berkovichi from Box stressed the importance of performance checks during automatic failover of databases. In particular, she noted that monitoring the runtime of end-to-end queries, as a method for determining the performance of a database, is better than simple echo testing (pinging).
... transferring traffic to another node (replica), in order to eliminate inaction, it is necessary to build defenses against bounce and other border situations. It is not difficult. The trick when organizing effective work is to know when to transfer the database to the first position, i.e. one must be able to correctly assess the performance of the database. Now, many of the parameters we are accustomed to pay attention to — for example, processor load, lock timeout, error rate — are secondary signals. None of these parameters actually speaks of the database’s ability to handle client traffic. Therefore, if you use them to make a decision about switching, you can get both false positive and false negative results. Our health checker actually performs simple queries to database nodes and uses data about completed and failed requests to more accurately assess the health of the database.
I discussed this with a friend, and he suggested that health checks should be as simple as possible, and that real traffic is the best criterion for assessing the health of a process.
Often, discussions related to the implementation of a performance check revolve around two opposing options: simple connection / signal checks or complex end-to-end tests. In this article, I want to emphasize the problem of using the above-mentioned form of testing for certain types of load balancing solutions, as well as the need for a more detailed approach to assessing the efficiency of the process.
Two types of health checks
Performance checks, even in many modern systems, tend to fall into two categories: checks at the node level and at the service level.
For example, Kubernetes implements validation by analyzing readiness and survivability . Readiness check is used to determine the ability to serve traffic. If the readiness check is not performed, it is removed from the endpoints that make up the service , and because of this, in the link, until the check is completed, no traffic is routed. On the other hand, the survivability test is used to determine the response of a service to a hang or lock. If it is not executed, the individual container is restarted to the kubelet . Similarly, Consul allows several forms of checks ( checks ): based on script , checks based on HTTP, sent to a specific URL, checks based on TTL, or even checks for aliases.
The most common method for implementing service -level health checks is to define end-point health checks. For example, in gRPC, the health check itself becomes an RPC call. gRPC also allows service level health checks and general gRPC server health checks .
In the past, node-level health checks were used as a signal to trigger an alert. For example, an alert with an average processor load (currently, it is considered to be a design anti-pattern). Even if the health check is not used directly for alerting, it still serves as the basis for a number of other automated infrastructure decisions, such as load balancing and (sometimes) open circuit. In the service grid data schemes, for example, Envoy, health checks , when it comes to determining the routing of traffic to an instance, go ahead with service discovery data.
Performance is a spectrum, not a binary taxonomy.
Ping, or ping, can only establish whether the service is running , while end-to-end tests are proxies to determine if the system is able to perform a specific unit of work , where the unit of work can be a database query or a specific calculation . Regardless of the form of the health check, its result is considered as purely binary: “passed” or “not passed”.
In today's dynamic and often “automatically scalable” infrastructure options, a single process that simply “works” does not matter if it cannot complete a specific unit of work. It turns out that simplified checks, for example, echo testing, are almost useless.
It is easy to determine when a service is completely disabled , but it is much more difficult to establish the degree of efficiency of a running service. It is quite possible that the process is working (that is, a functional test passes), and traffic is routed, but to perform a certain unit of work, say, during the service delay period p99, this is not enough.
Often the work can not be completed due to the fact that the process is overloaded. In highly competitive services, “overload” is neatly compared to the number of concurrent requests processed by only one process with redundant queuing, which can lead to an increase in the delay for an RPC call (although most often the lower-level service simply puts the request on standby and retries on after a specified timeout). This is especially true if the endpoint of the health check is configured to automatically return to the HTTP status code 200, while the actual operation performed by the service involves network I / O or calculation.

Process efficiency is a spectrum. First of all, we are interested in the quality of service , for example, the time required for the process to restore the result of a specific unit of work, and the accuracy of the result.
It is possible that the process fluctuates between different degrees of working capacity during its service life: from full working capacity (for example, the ability to function at the expected level of parallelism) to the verge of inoperability (when the queues begin to fill) and the point where the process goes completely into an unworkable zone (felt reduced quality of service). Only the most trivial services can be built on the assumption of the absence of some degree of partial failure in any period, where partial failure implies that some functions work and others are disabled, and not just "some requests are being executed, some are not being executed." If the architecture of the service does not allow correcting a partial failure correctly, the task of correcting errors is automatically placed on the client .
An adaptive, self-healing infrastructure must be built with the understanding of the fact that such fluctuations are perfectly normal . It is also important to remember that this distinction matters only in relation to load balancing - the orchestra, for example, does not make sense to restart the process only because it is on the verge of overload.
In other words, for the level of orchestration, it is quite reasonable to consider the operation of the process as a binary state and restart the process only after a crash or hang. But in the load balancing layer (whether it is an external proxy, for example, Envoy, or an internal library from the client), it is extremely important that it acts on the basis of more detailed information about the process performance - when it makes appropriate decisions about breaking the circuit and dropping the load. Gradual degradation of the service is impossible if it is impossible to accurately determine the level of service health at any point in time.
I will say from experience: unlimited parallelism is often the main factor leading to the degradation of the service or permanent performance degradation. Load balancing (and, as a result, load shedding) often comes down to efficiently managing parallelism and applying backpressure, preventing the system from being overloaded.
The need for feedback when applying backpressure
Matt Ranney wrote a phenomenal article about unlimited parallelism and the need for back pressure in Node.js. The article is curious in its entirety, but the main conclusion (at least for me) was the need for feedback between the process and its output unit (usually a load balancer, but sometimes another service).
The trick is that when resources are exhausted, something must be given somewhere. Demand is growing, but productivity cannot magically increase. To limit incoming tasks, first of all, it would be nice to set a certain speed limit at the site level, by IP address, user, session, or, at best, by some important element for the application. Many load balancers may limit the speed in a more complicated way than restricting an incoming Node.js server, but usually do not notice problems until the process is in a difficult position.
Speed limits and open circuits based on static thresholds and limits can be unreliable and unstable in terms of both correctness and scalability. Some load balancers (in particular, HAProxy) provide a variety of statistics on the length of internal queues for each server and server part . In addition, HAProxy allows agent-check testing (auxiliary validation independent of the regular health check), which allows the process to provide the proxy server with more accurate and dynamic health feedback. Link to documents :
The agent’s health check is performed by a TCP connection to the port based on theagent-portparameter set and reading the ASCII string. A string consists of a series of words, separated by spaces, tabs or commas in any order, optionally ending with/rand / or/nand including the following elements:
- Representation of positive integer percentage ASCII, for example,75%. The values in this format determine the weight in proportion to the initial
the weight of the server configured when HAProxy starts. Please note that the zero weight value is indicated on the statistics page asDRAINfrom the moment of similar impact on the server (it is removed from the LB farm).
- Themaxconnstringmaxconn: followed by an integer (no space). Values in
This format defines themaxconnservermaxconn. Maximum number
The claimed connections must be multiplied by the number of load balancers and the various server parts using this health check to get the total number of connections that the server can establish. For example:maxconn:30
')
- The wordready. This translates the administrative state of the server intoREADYmode, canceling theDRAINorMAINT.
- The worddrain. This translates the administrative state of the server intoDRAINmode (“drain”), after which the server will not accept new connections, except for connections that are received through the database.
- The wordmaint. This translates the administrative state of the server intoMAINTmode (“maintenance”), after which the server will not accept any new connections, and the health checks will stop.
- The wordsdown,failedorstopped, followed by a descriptive line after the pound (#) character. They all indicate the operational state of theDOWNserver (“off”), but since the word itself is displayed on the statistics page, the difference allows the administrator to determine if the situation was expected: the service can be intentionally stopped, it may appear, but not pass some confirmation tests or considered as disabled (no process, no response from the port).
- The word up indicates the operational status of theUPserver (“on”), if the health checks also confirm the availability of the service.
Parameters that are not declared by the agent are not changed. For example, an agent can only be designed to monitor processor usage and report only a relative weight value, without interacting with the operating state. Similarly, an agent program can be designed as an end-user interface with 3 switches, allowing the administrator to change only the administrative state.
However, it is necessary to take into account that only the agent can cancel its own actions, therefore, if the server is set to DRAIN mode or to the DOWN state using an agent, then the agent must perform other equivalent actions to restart the service.
Failed connection with the agent is not considered as an error, because the connectivity is tested by regularly performing a health check, which is run using the check parameter. However, if a disconnection message has been received, a warning is not a good idea to stop the agent, since only the agent reporting the activation can re-enable the server.
Such a scheme of dynamic communication service with the output unit is extremely important for creating a self-adaptable infrastructure. An example would be the architecture that I worked with in my previous work.
I used to work at imgix , a real-time start-up image processing company. Using a simple URL API, images are extracted and converted in real time and then used anywhere in the world via CDN. Our stack was quite complex ( as described above ), but briefly, our infrastructure included a level of balancing and load balancing (in tandem with a level to get data from a source), a source caching level, an image processing level and a content delivery level.

At the heart of the load balancing level was the Spillway service, which acted as a reverse proxy and query broker. It was a purely internal service; on the verge we were running nginx and HAProxy and Spillway, so it was not designed to complete TLS or perform any other functions from the innumerable set that is usually within the competence of the border proxy.
Spillway consisted of two components: the client part (Spillway FE) and the broker. Although initially both components were in the same binary file, at some point we decided to separate them into separate binaries that were deployed simultaneously on the same host. Mainly, because these two components had different performance profiles, and the client part was almost completely connected to the processor. The client-side task was to perform preprocessing of each request, including a preliminary check at the source caching level, to make sure that the image is cached in our data center before sending the request for image conversion to the executor.
At any point in time, we had a fixed pool (a dozen or so, if memory serves) performers who could be connected to one Spillway broker. Artists were responsible for the actual image conversion (cropping, resizing, PDF processing, GIF rendering, etc.). They processed everything from PDF files of hundreds of pages and GIF files with hundreds of frames to simple image files. Another feature of the artist was that, although all the networks were completely asynchronous, there were no actual conversions on the GPU itself. Considering that we were working in real time, it was impossible to predict what our traffic would look like at a certain point in time. Our infrastructure had to self-adapt to various forms of incoming traffic - without manual intervention by the operator.
Given the disparate and disparate traffic patterns that we often encountered, it became necessary for executors to refuse to accept incoming requests (even when fully operational) if accepting a connection threatened to overload the executor. Each request to the executor contained some set of metadata about the nature of the request, which allowed the executor to determine whether he was able to service this request. Each performer had his own set of statistics on the requests with which he currently worked. The employee used these statistics in conjunction with the query metadata and other heuristics, such as socket buffer size data, to determine if he had correctly received the incoming query. If the employee determined that he could not accept the request, he created a response that is not different from checking the HAProxy agent, which informs his output unit (Spillway) about its operation.
Spillway tracked the performance of all pool artists. At first, I tried to send a request three times in succession to various performers (preference was given to those who had the original image in local databases and who were not overloaded), and if all three executors refused to accept the request, the request was queued at a broker inside the memory. The broker supported three forms of queues: a LIFO queue, a FIFO queue, and a priority queue. If all three queues were filled, the broker simply rejected the request, allowing the client (HAProxy) to try again after the delay period. When a request was placed in one of three queues, any free agent could remove it from there and process it. There are certain difficulties associated with assigning a priority to a request and deciding which of the three queues (LIFO, FIFO, queues based on priority) should be placed, but this is a topic for a separate article.
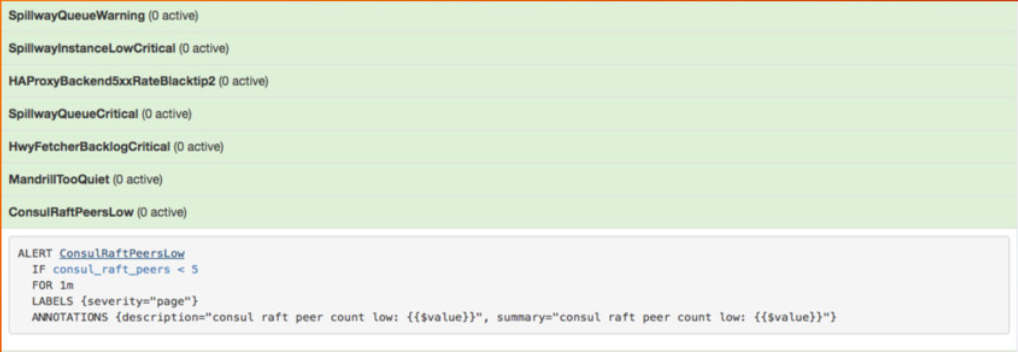
We did not need to discuss this form of dynamic feedback in order to work effectively. We closely monitored the broker queue size (all three queues), and Prometheus gave one of the key alerts when the queue size exceeded a certain threshold (which was quite rare).

Earlier this year, Uber published an interesting article in which he shed light on his approach to implementing a level of load shedding based on quality of service.
Analyzing the failures over the past six months, we found that 28% of them could be mitigated or prevented by smooth degradation .
The three most common types of failures were due to the following factors:
- Changes to the incoming request schema, including overload and bad operator nodes.
- Depletion of resources such as a processor, memory, I / O circuit or network resources.
- Dependency crashes, including infrastructure, data storage, and downstream services.
We implemented an overload detector based on the CoDel algorithm. For each enabled endpoint, a lightweight request buffer is added (implemented on the basis of the gateway and channels ) in order to track the delays between the moment the request is received from the call source and the start of the request processing in the handler. , , .
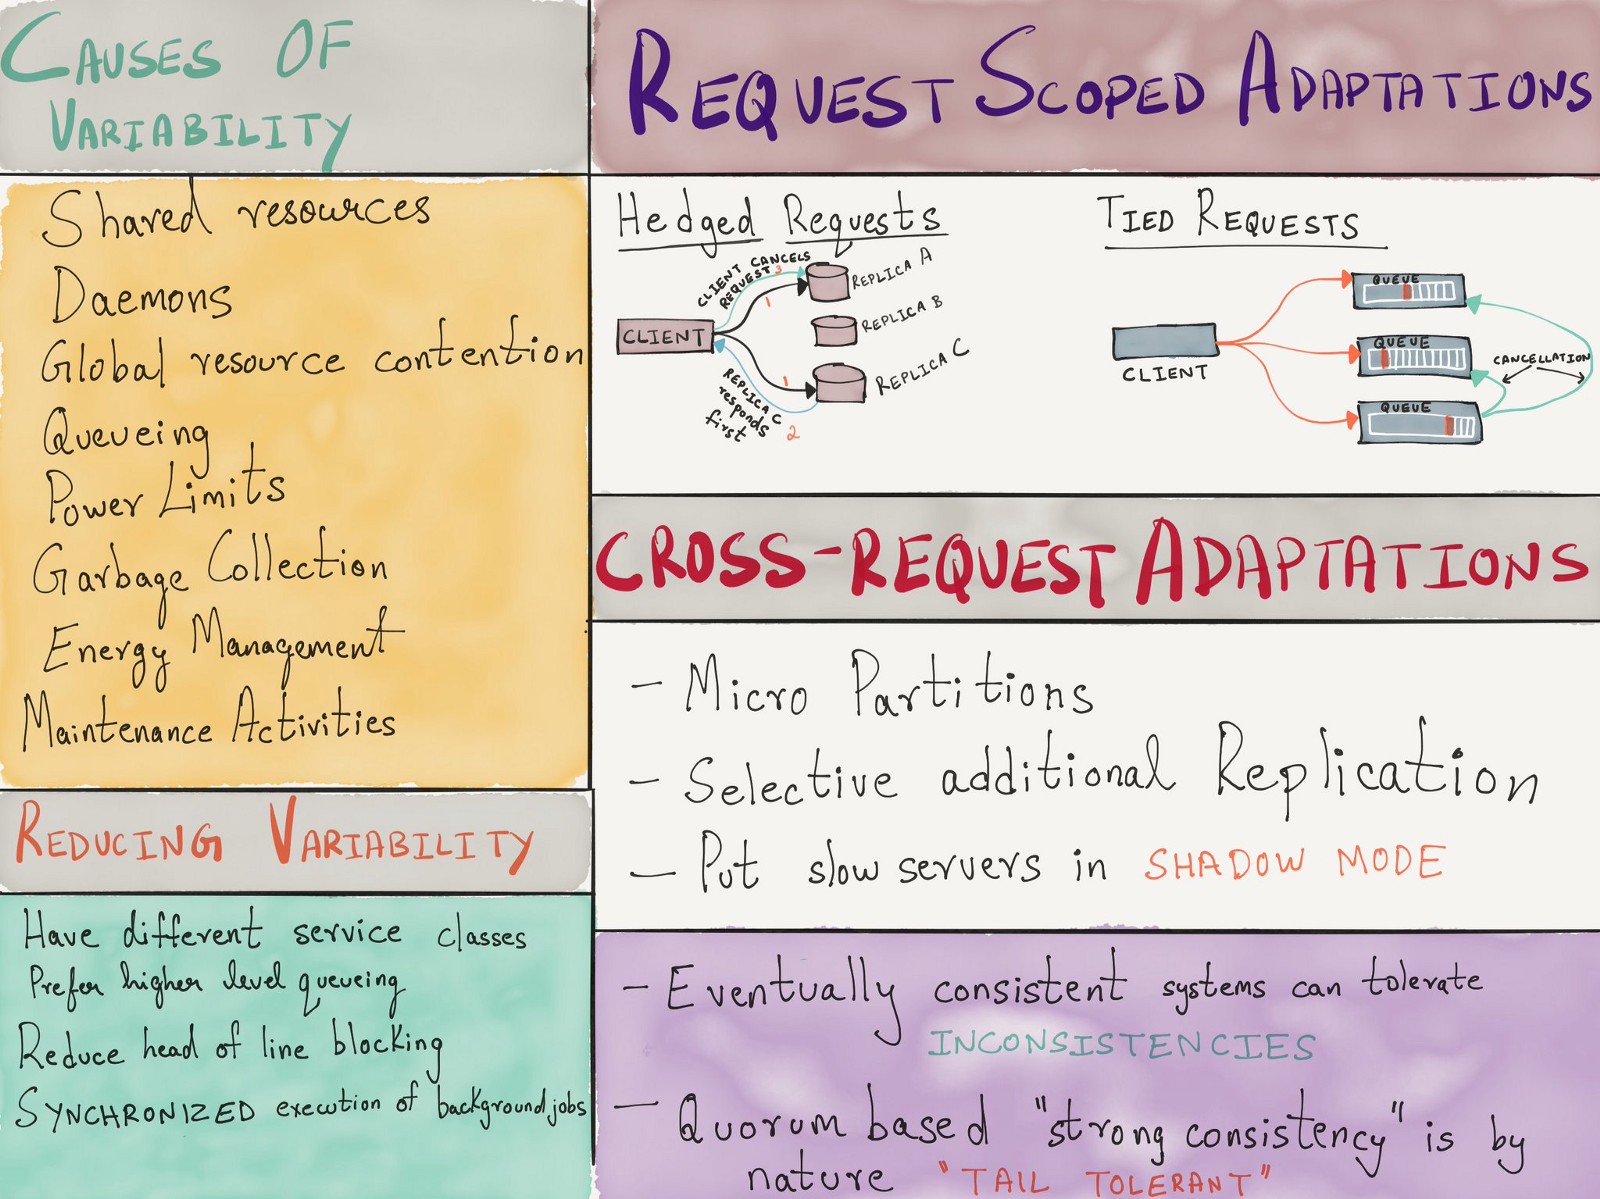
, , , - . 2013 Google «The Tail at Scale» , ( ), ( ) .
( )
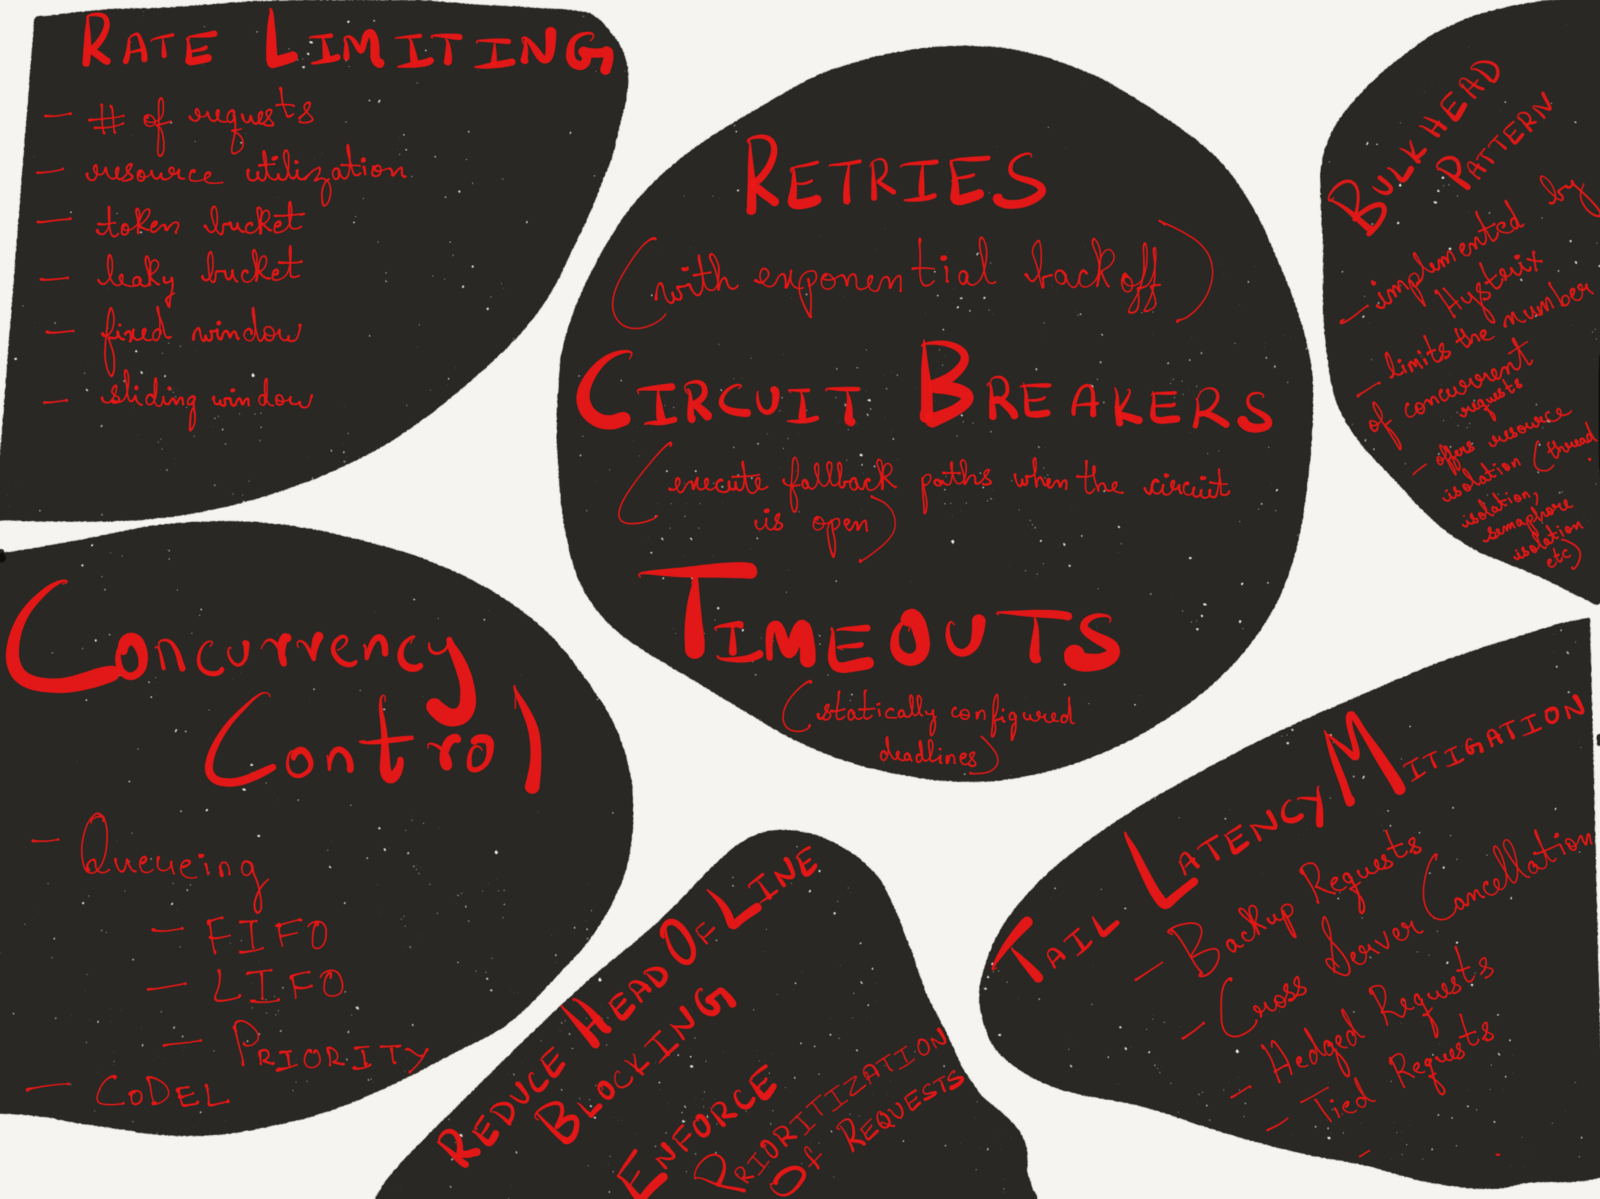
, , :
Conclusion
, TCP/IP ( ), IP ECN ( IP ) Ethernet, , .
Large-scale health checks may suffice for orchestration systems, but not to ensure quality of service and prevent cascading failures in distributed systems. Load balancers need to see the level of the application in order to successfully and accurately apply backpressure to customers. Gradual degradation of the service is impossible if it is impossible to accurately determine its level of performance at any time. In the absence of timely and sufficient back pressure, services can quickly fall into a quagmire of failures.
Source: https://habr.com/ru/post/433462/
All Articles