PRTG Network Monitor testing and comparison with Zabbix
We publish the translation of the Flavio Xandó article about testing PRTG Network Monitor and comparing it with Zabbix. Testing was conducted not in laboratory conditions, but in real use, in a real-life company with its entire infrastructure in the course of its daily activities.
The concept of PRTG and its characteristics are not new. However, Paessler has been working hard year after year, with the result that important changes in the form, interface and functionality of its products are realized. In this regard, it is necessary to conduct a new assessment. This time the environment was analyzed, which consisted of the following locations, equipment and functionality:
')
It seems that it is enough to understand when something is going well or badly; nevertheless, it is necessary to comply with the basic requirements. There must be an observation point, a variable that can be measured, and a specific standard, a reference value, is also needed. In PRTG, we call these observation points sensors.
It is easy to list the elements of the IT environment that need to be monitored for analysis, diagnostics, preventive procedures, adjustments, etc. There are a variety of sensors in PRTG that go beyond the obvious and allow monitoring of complex scenarios. In each new version of this tool, new types of sensors are presented to the monitoring world as peripheral functions, which greatly facilitates the work.
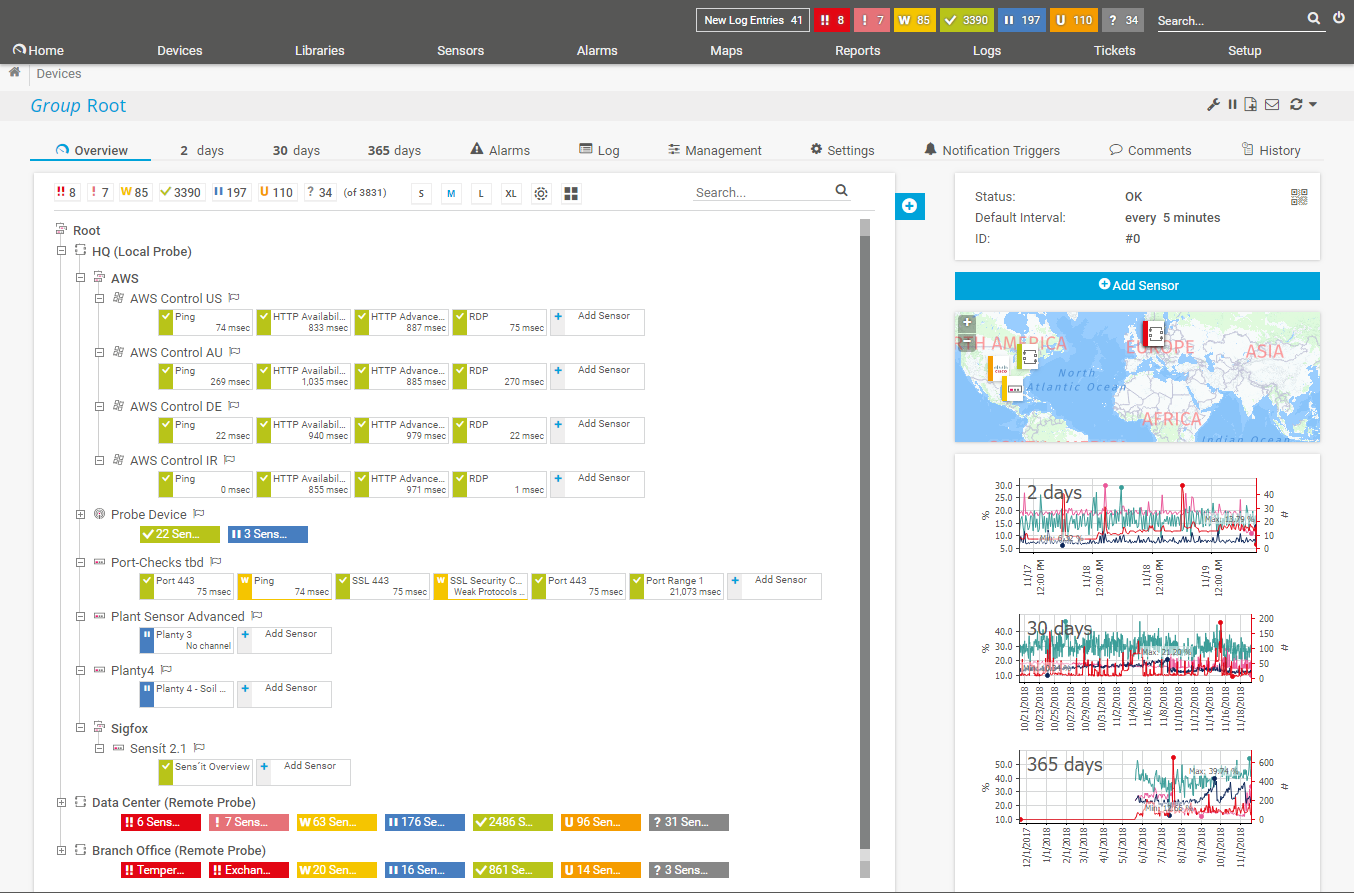
Image 1: Monitored Environment Overview
With each new version of PRTG, new monitoring capabilities are being introduced, they are increasingly being improved and specialized. There are many interesting features, such as monitoring hardware, software environments, networks, data traffic, etc. Commercially, a product license is granted based on the number of sensors required. For this reason, it is important to conduct a thorough assessment of the actual need for control points, since if more sensors are used, it will be necessary to purchase a license to support them. This is not a problem, since at any time you can purchase more sensors by paying only the difference in cost between the current and the required licenses.
However, too many sensors deployed in the IT environment and visible in the PRTG panel can clog the console and make it difficult to determine what needs to be analyzed first. A balance is needed between quantity, quality, and the ability to evaluate information, and the PRTG helps in this task.
It does not make sense to give in this text all the sensors existing in PRTG, since there are a lot of them. But there are several among them that are considered simple and usually serve as the starting point of any deployment. These include sensors: presence (response to the PING command), CPU utilization level, free disk space, operating time, number of printed pages, etc. But there are also highly specialized sensors that monitor specific applications, such as SQL Server, Microsoft Exchange, Oracle, Web server, etc.
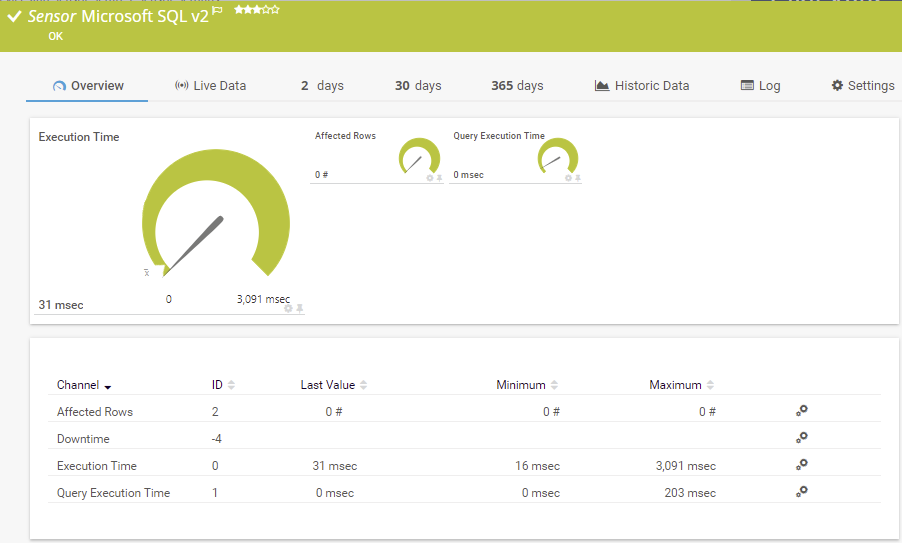
Image 2: Microsoft SQL Sensor
In the latest versions of PRTG, this type of specialized monitoring is widely used, serving not only Windows servers, but also Linux, virtualization environments, etc. In the case of Windows servers, sensors can be deployed that monitor the performance of specific services that are critical to the operation. If any of these sensors fail or stop working, you can take immediate action. In addition, PRTG allows you to configure re-activation of the service in case of its interruption. Thus, the program not only warns about stopping the service with an indication of a failure that needs to be fixed, but also takes appropriate corrective measures. The main function of PRTG is, of course, monitoring, but for this type of sensor this option is also provided.
In the figure below you can see some critical services, such as DNS, DHCP, Firewall, Update, etc., that were selected for monitoring on one of the servers.
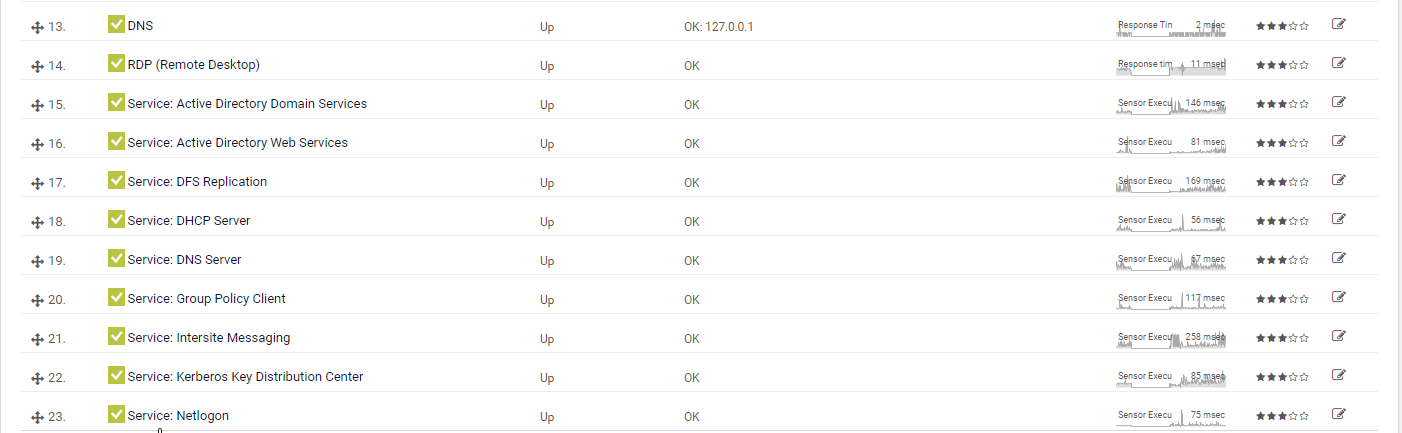
Image 3: Example of monitoring Microsoft Windows Server services
The function of monitoring and restarting services has already helped to solve problems. For example, difficulties with the NETLOGON service, which prevented access to shared folders. During the new testing, this happened again, the DHCP service on one of the servers arbitrarily stopped. This prohibited access to the network by new computers when they were connected. The service re-activation function after detecting the stop helped not only smooth out this problem, but also finally solve it.
The network was an access point in the outlet with poor contact. This periodically made him reconnect. This access point, even when it was configured with its own DHCP turned off, was raised during the “boot” with DHCP enabled and then connected. The Windows DHCP server turned off when it detected another DHCP on the network (access point). During a search in the PRTG and Windows log, a conflict was found between the two DHCP services that were turned off. After determining the IP address, the access point was found. But this was not immediately clear, since DHCP was turned off. After updating the firmware of this access point, the problem was resolved. In fact, during a shutdown, it itself went through a post-boot with DHCP enabled and then hung up, but sometimes this led to the shutdown of the same Windows service. Windows would have had an unmanaged DHCP service until today if it hadn't been possible to install it in the logs using PRTG.
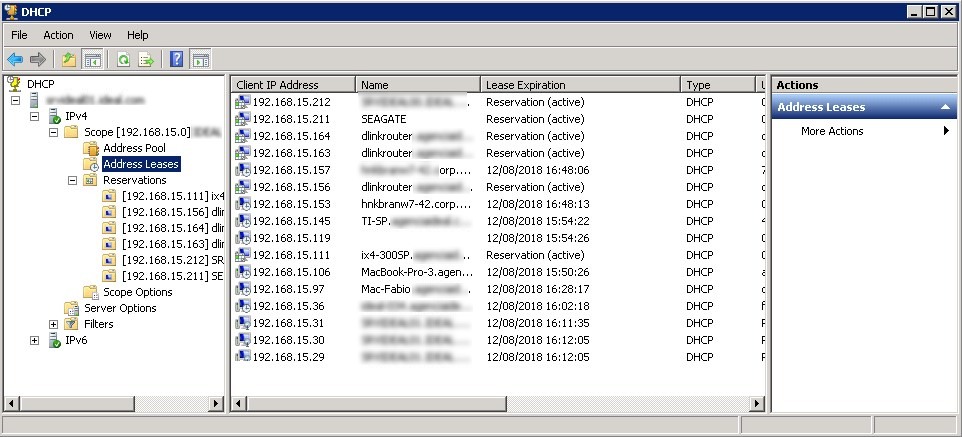
Image 4: DHCP Manager on Windows
To install the PRTG software, the company’s headquarters was chosen - a facility with a more complex infrastructure, which has several remote locations. This allowed to work first in the local network, and then remotely.
From previous deployments, the PRTG Auto-Discovery feature (automatic detection) was already familiar. It is very practical because it allows you to "scour" the network, detect devices and, depending on the policy chosen, select simple or complex sensors. Using the "simple sensors" mode, hundreds of devices were discovered and unnecessary ones were deleted, including user computers.
On servers that did not receive the expected level of information, Auto-Discovery was restarted with the ability to select more sensors and get more analysis points. On the other hand, some servers have activated 20, 30, or even more sensors.
Auto-Discovery can be performed for the entire network, usually during initial deployment. However, it may be used later to supplement the sensors on a device that has little information, by introducing dozens more new sensors.
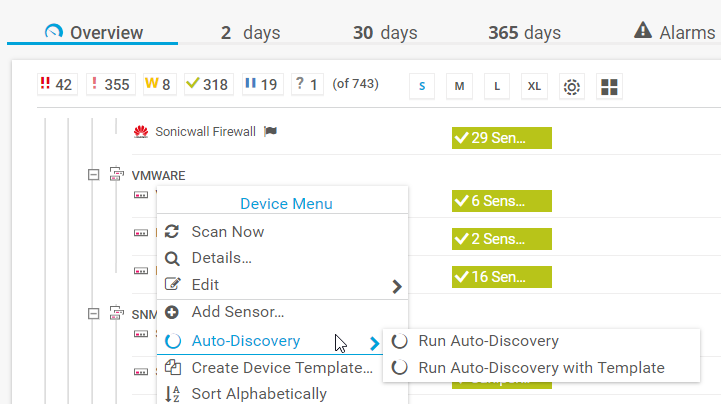
Image 5: Adding Sensors with Auto Detection
In such a situation, it is important that the PRTG administrator be present, who can review the sensors and leave only those that matter most to him. Minor can be selected and immediately removed. As a rule, first you want to create sensors for everything, but it is useless and can even interfere.
Let's draw an analogy with the medical intensive care unit. Is there any advantage of keeping the patient's hair informed? Or, in the case of the server, is it necessary to report how many times the virtual memory paging file has been used? If an extraordinary event occurs for which a large analysis is required, the PRTG immediately allows you to select additional sensors and immediately disconnect after use. It is wiser to continuously monitor what is directly related to your environment.
The use of Auto-Discovery in early versions of PRTG was more difficult, since both devices and sensors in large quantities were placed on the device panel in a not very structured way. However, from 2016, devices are automatically added to a group called Network Discovery (network discovery) and subgroups with very didactic names, such as “Servers”, “Network”, “Virtual Systems”, “Printers”, etc. Thus, it is much easier to make the necessary adjustments, the choice of devices and sensors that must be removed or left.
The test environment included several branches and small remote offices. How can you monitor these environments? Like space and underwater probes, equipment sent to remote locations for analyzing information, the concept of probes to meet this kind of need is also present in the PRTG.
The concept of remote probes is very well applied to remote locations, branches, offices, to which a VPN connection or dedicated channels (for example, MPLS) with the headquarters, where the PRTG core is installed, do not necessarily exist. Access to the PRTG server is also provided via the Internet. This is a very lightweight application installed on small local servers or even on ordinary workstations.
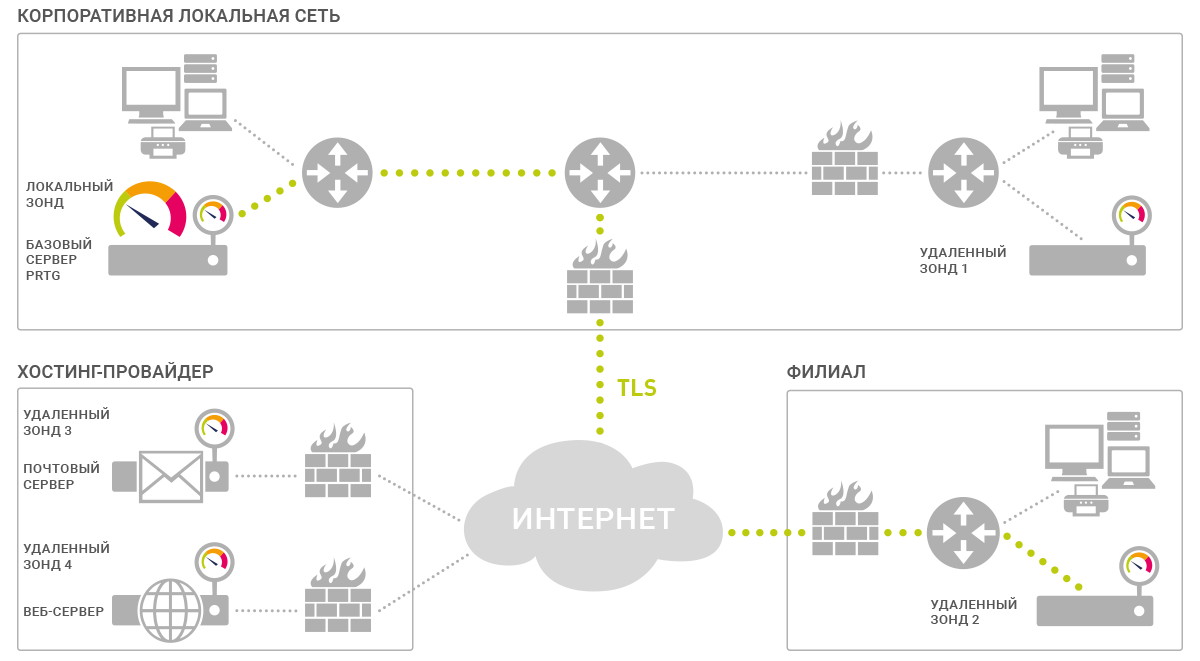
Image 6: Remote probes in PRTG
If the remote environment uses a large number of sensors on many devices, probe processing will be more intensive and may require a dedicated computer. Security when accessing the probe is guaranteed by strict security measures that allow you to avoid unauthorized access. During installation, a password is generated to connect to the central PRTG, the access IP address must be previously registered / authorized and, in addition, the probe must be approved in the PRTG console. An important reminder: at the central point, in the firewall, TCP port 23560 must be opened, and traffic must be redirected from this port to the server running PRTG (the core server).
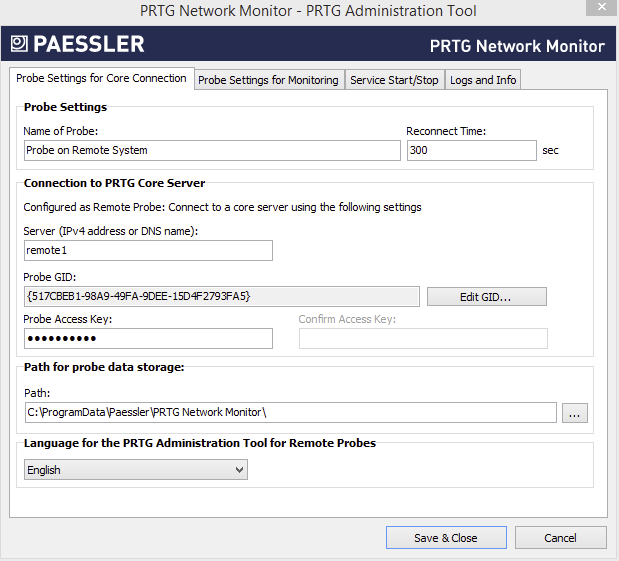
Image 7: PRTG Administration Tool for remote probes
After the probes are installed and approved, the PRTG administrator can request the Auto-Discovery function on a remote network to discover devices, allocate sensors, or obtain permission to install sensors manually, including at the central location of the PRTG core installation. Thus, remote offices receive as much attention as the central point. Simple and effective!
It is important to note how PRTG handles version updates related to remote probes. When the PRTG kernel is updated, they receive this information and proceed to automatic updating. This ensures communication with the probes, and after updating the new sensor functions (or sensors) will be available in remote locations.
The natural interface of the PRTG is a web console. This allows the administrator to connect to the program from any computer from anywhere in the world and perform all the tasks of monitoring, creating new sensors, implementing remote probes, etc.
With each new version there is an update and modernization of the web interface - it is becoming more and more clear and didactic.
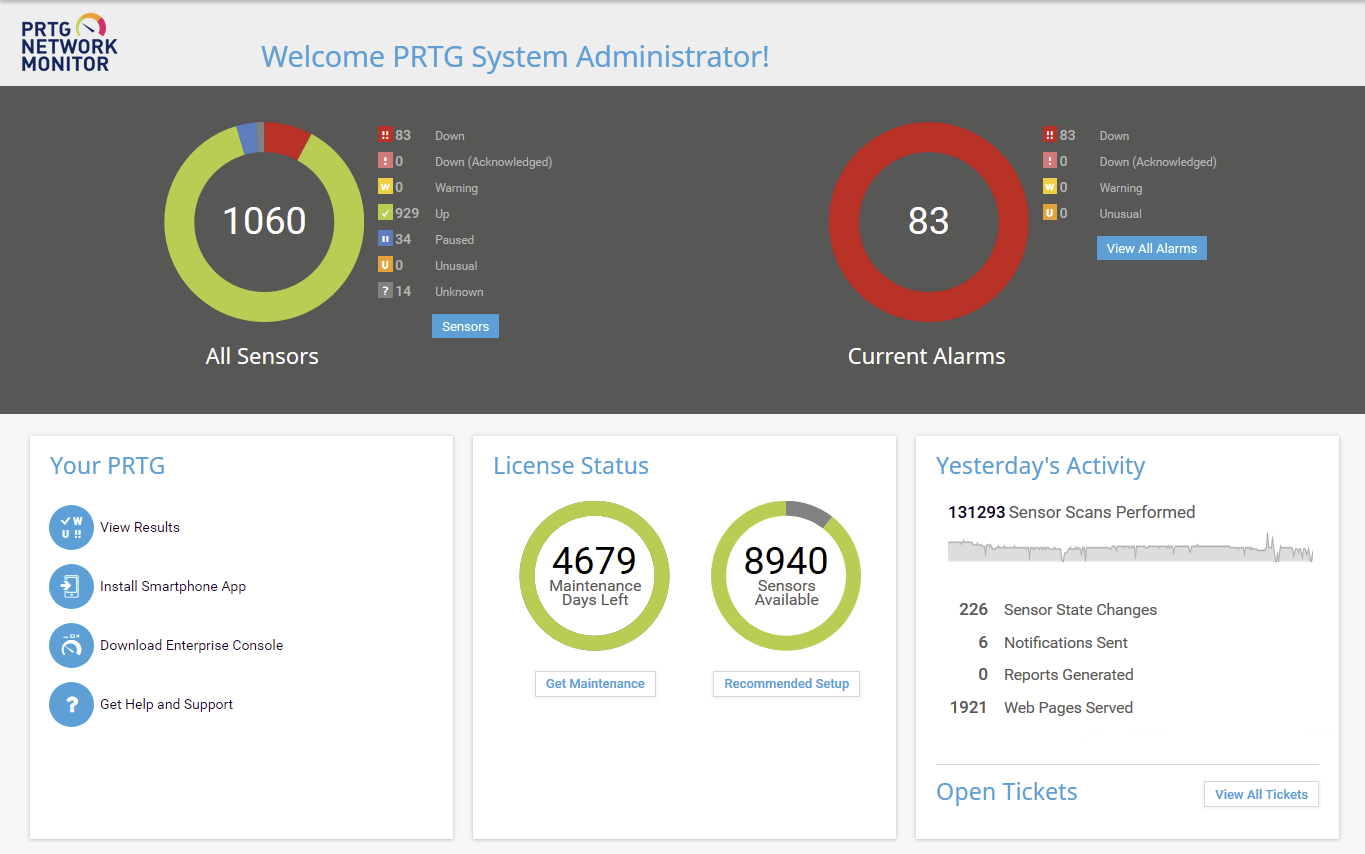
Image 8: PRTG web interface
The expression "didactic interface" is applicable, since it immediately attracts attention with images in the form of donut charts, clearly shows the number of sensors used, how many of them are green (OK), yellow (warning) and red (error). The second graph, also in the form of a ring, presents the number of warnings and errors. In our example, 73 warnings and 15 errors were detected, i.e. non-standard defective devices or sensors.
Image 9: PRTG web interface - device tree, including remote probes
The web interface contains all the functionality of PRTG, they are also available in the application called PRTG Desktop.
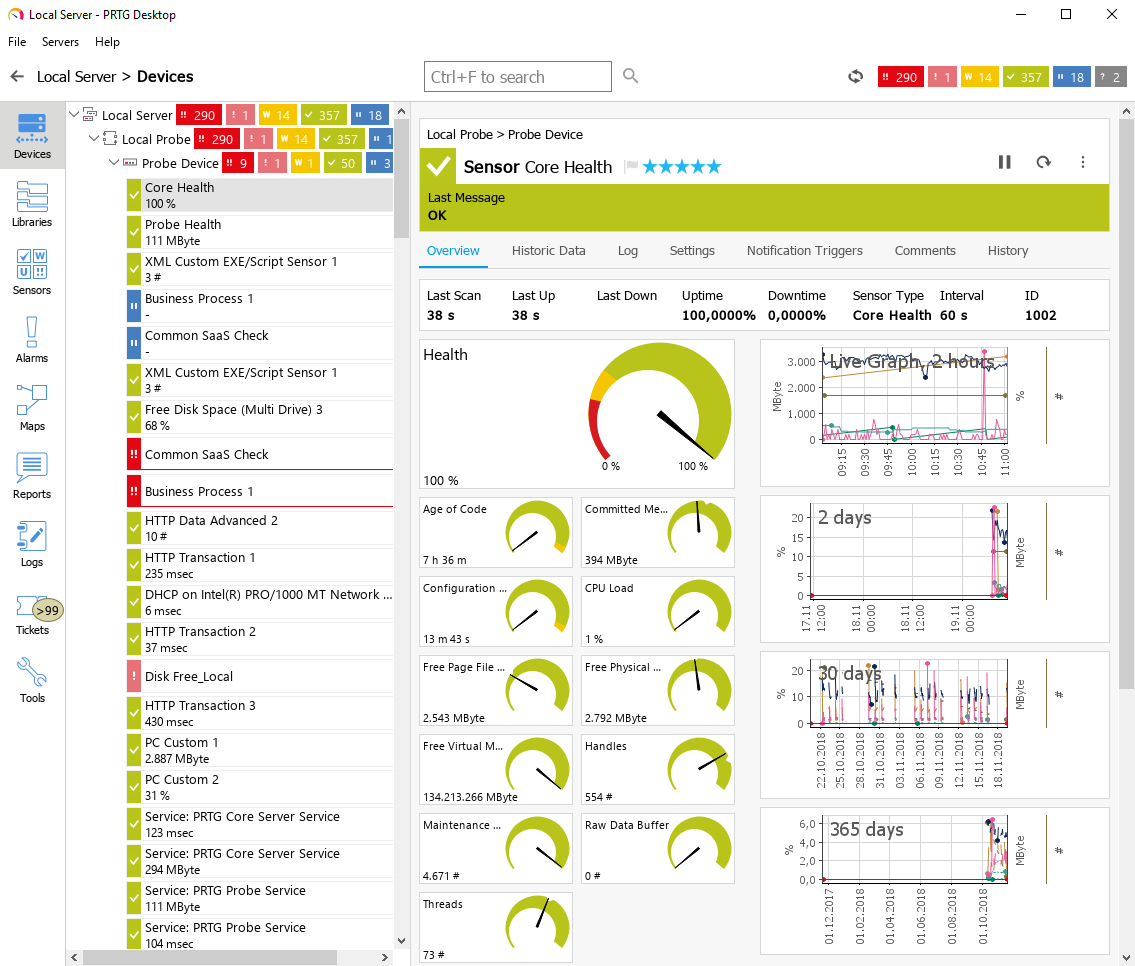
Image 10: PRTG Desktop Client
There is an important distinction between PRTG Desktop and the web interface. Despite the fact that they display the same information, PRTG Desktop has the ability to launch a screen with critical alerts when booting. Paessler replaces the Enterprise Console with a new PRTG Desktop program. This is a beta version that you can use and evaluate at .
There is also a similar version of the application for mobile devices. With it, the administrator can receive notifications about the health of their infrastructure, wherever he is. Even without a computer, it can access PRTG (or PRTG Desktop). There are versions of the application for iOS and Android. The simplified interface displays devices, remote probes, and locations. It uses the same symbols, colors and visual templates to make it easier to evaluate the device or location. The element to which the alarm relates can be opened, and each touch of the screen opens up more and more details until you understand the essence of the problem. You can view applications and temporarily suspend the alarm (for example, for a printer that is sent for maintenance for 3 days, the sensor may be suspended to not generate an alarm during this time).
PRTG provides the ability to deliver instant notifications to the application. Usually, the sensor is updated every “x” seconds, and you can also configure it so that when a certain situation occurs, an immediate notification of the administrator, user or the whole group will come.
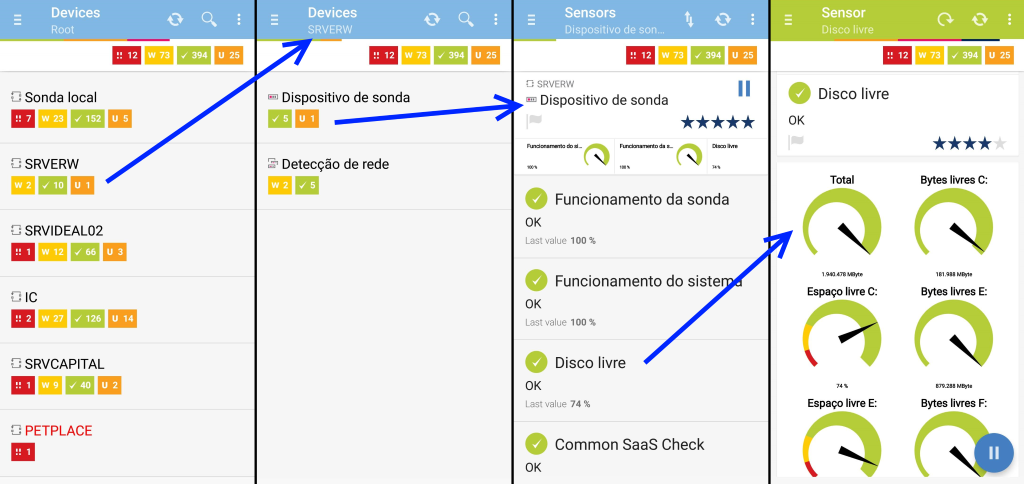
Image 11: Smartphone PRTG screen - sensor evaluation without problems
In addition to everything PRTG includes a very useful resource - a system for interaction between analysts and users in resolving incidents. It was designed to concentrate on supporting requests generated by alerts and alarms sent by the PRTG. This resource is a real bonus for IT departments, which allows professionals to interact not only with each other, but also with users.
Immediately after detecting errors, alerts are sent to the control panel. In addition, an incident report message is delivered to the specified email address. If the situation is resolved without outside intervention, another email is sent notifying you that the situation has been resolved. This can happen in the case, for example, of a temporary unavailability of an Internet connection, excessive consumption of CPU resources on a server, etc.
But more often than not, a notification requires the intervention of an operator or a help desk analyst to solve the problem immediately or after a short period of time. The PRTG automatically generates claims, for example, based on Auto-Discovery notifications of discontinuance or the need to approve a remote probe.
In addition, the system administrator can create requests in our own support service for triggered alarms or other tasks. Thus, the decision of the situation that has arisen is assigned to a specific person (possessing the relevant competencies). Then the performer receives an e-mail, enters the PRTG under his account and sees on the screen all the tasks that were assigned to him. Application initiators assign one of five levels of priority to their assignments so that the responsible officer plans his work schedule.
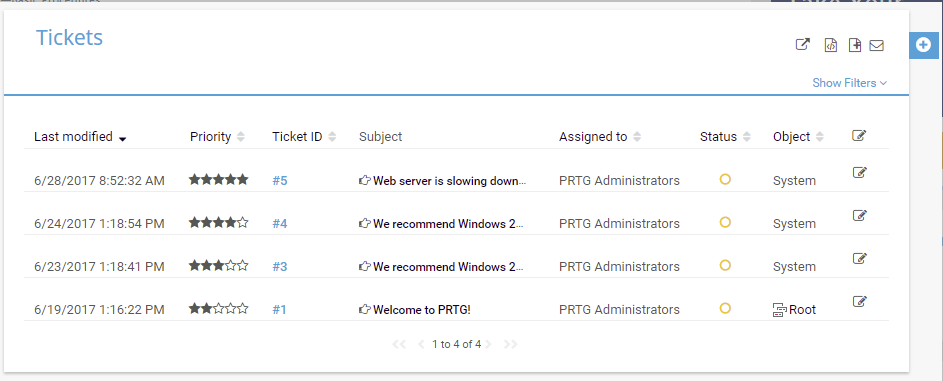
Image 12: PRTG screen - ticket system
This function has long been present in PRTG, but the program contains new elements for predicting and analyzing problems. This is an alert for unusual behavior. For example, take the recently received notice below. The network worked perfectly, there was not a single sensor signaling an error. However, one of the servers issued the message "Access to this address (PING) is extremely high for this time of day." Do you understand how important this is? This address was just an external DNS that used the Internet access router, which was characterized by a large delay on Sundays. It was necessary to immediately change this DNS to another, otherwise, on Monday, hundreds of people would start using this network, and access to the Internet could be at risk. The presence of this function gives tremendous opportunities, and it is very convenient.
The screen below shows this case of unusual activity. Notice the orange color of the alert and the code “U”, which means “Unusual” (Unusual). In fact, this alert was generated at the weekend when the PING 132ms is indeed high. This was the beginning of the study, during which the replication process that was taking place between the servers was discovered, which caused this behavior.
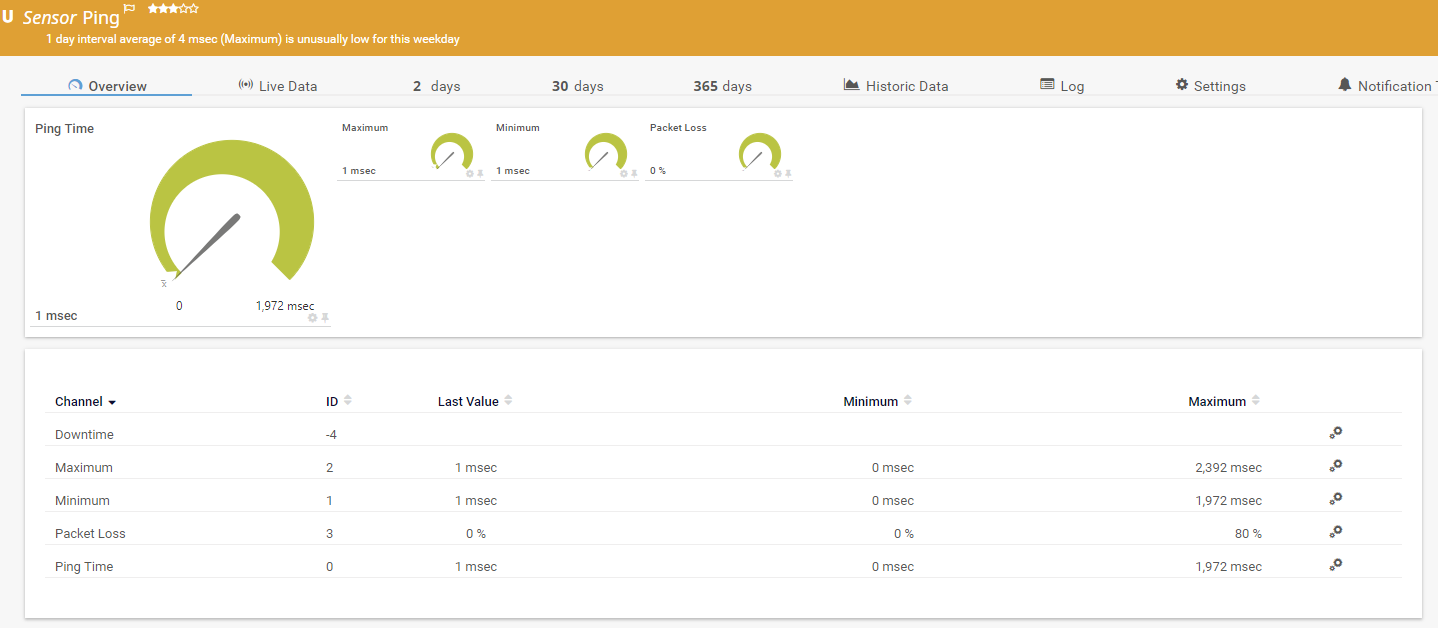
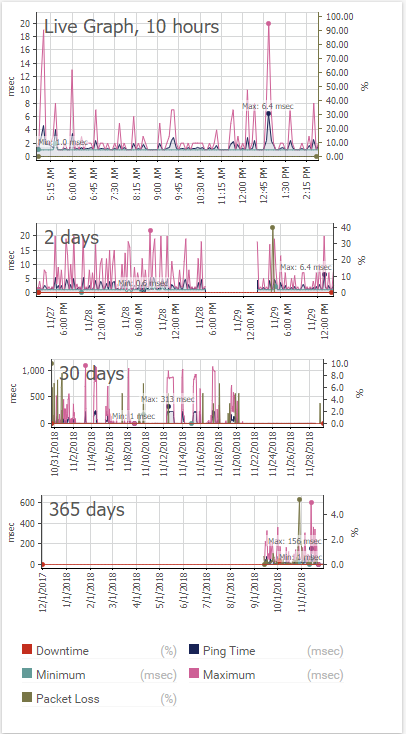
Image 13-14: PRTG screen in the web interface - event rating
Sensors generate very large amounts of data, their organization and management is handled by PRTG. Information is needed to keep managers abreast of events that may affect business processes, downtime, weaknesses, etc. PRTG also has important tools for analyzing historical data. This is a module that presents some very interesting off-the-shelf reports, such as:
In addition to such models, which can be selected using several filtering conditions, analysis period, etc., there is a tool for generating reports. With it, the administrator can create a report with important information for themselves, containing numeric or graphical data.
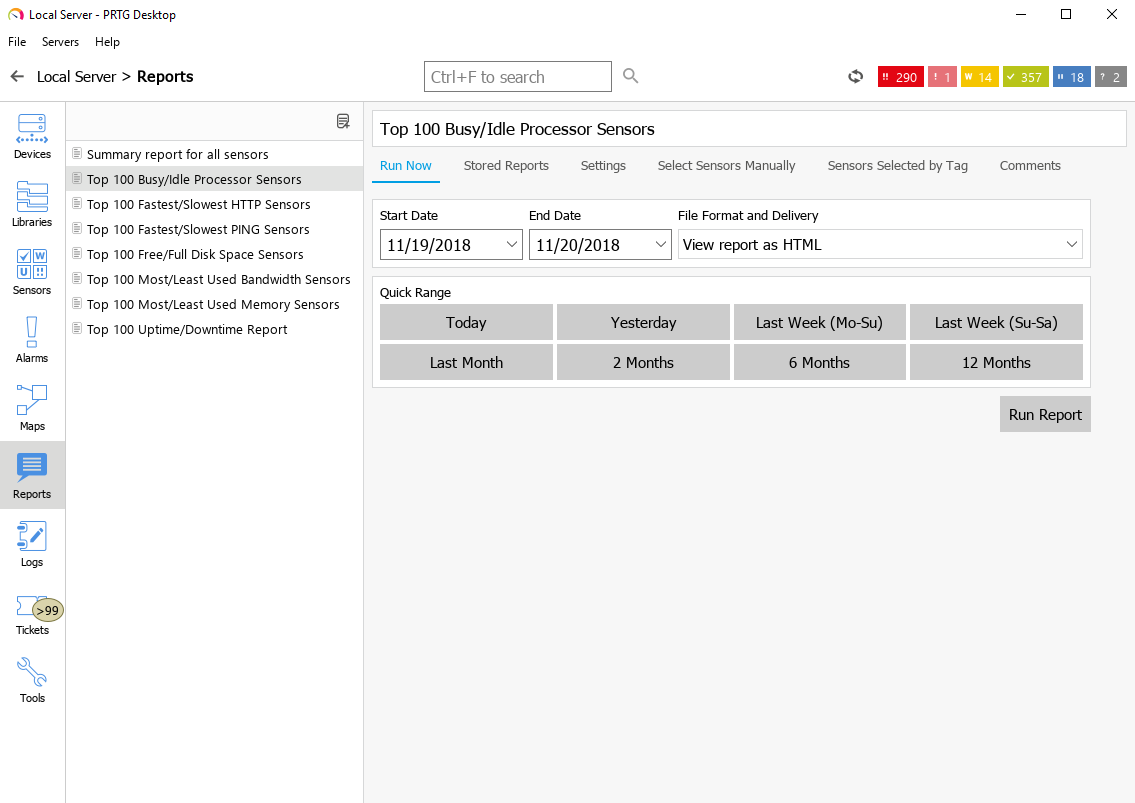
Image 15: PRTG Standard Reports
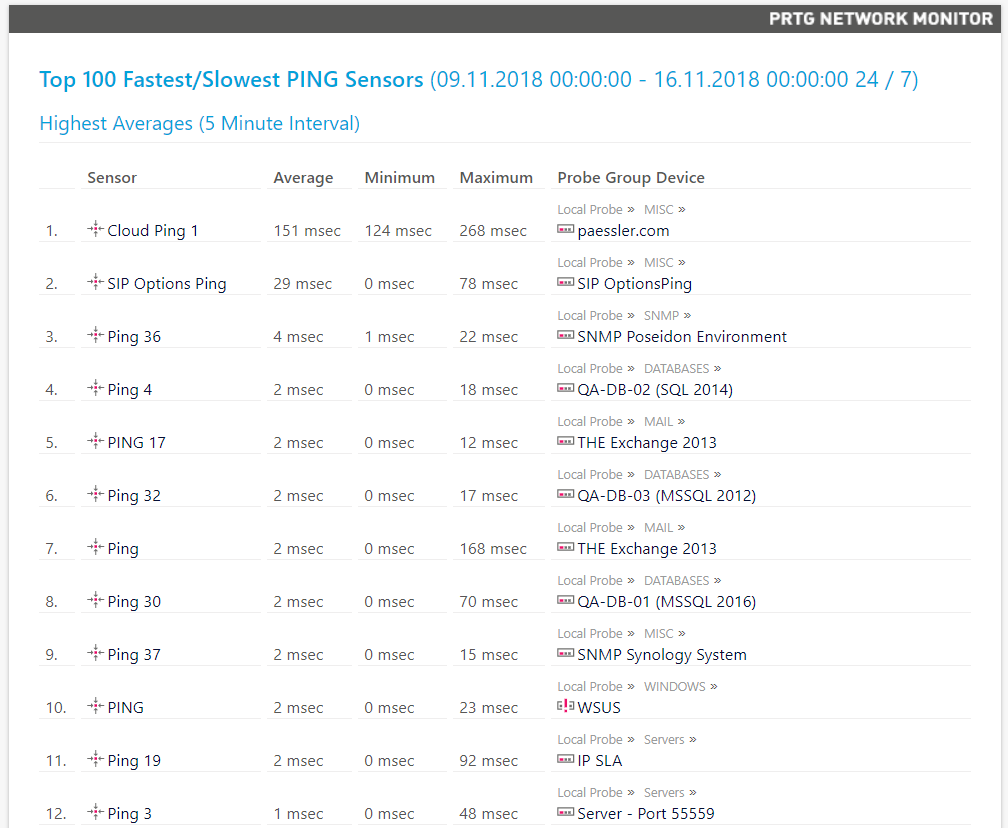
Image 16: Example PRTG report for devices with the longest and shortest PING response times
During the evaluation of the PRTG program, the idea was born of comparing it with a product that is similar to it in functionality. Zabbix solution has some support in the market, so it was decided to make a comparison with it. Zabbix has zealous fans mainly because it is open source software and has “zero cost”. This factor is pretty serious bait. But can this alone be a decisive advantage over PRTG?
Installing PRTG. PRTG includes a program running on the Windows platform (version 7 or higher), and the installation package that performs the monitoring function is downloaded from the Paessler website. If there are too many monitoring sensors, it is recommended to allocate one machine exclusively for PRTG. In all tests performed, where up to 1000 sensors were used, a Windows Server was involved, which even had the form of an Active Directory (despite the fact that this is not entirely correct). Paessler strongly condemns the practice of installing PRTG in AD, because this server can be restarted in case of a PRTG update. We made this mistake in our test, and therefore we emphasize that this should not be done!
Installing Zabbix. The site has links to download the installation modules on the Linux system. They require Apache, PHP and MySQL databases. There are instructions on Apache installations, on how to create a database in MySQL, and how to set up PHP. The instructions are not very complicated, but they require care and attention at every stage. Alternatively, you can download a virtual machine image, as we did, because it immediately contains preconfigured Linux, PHP, Apache, and MySQL. However, this requires a virtualization environment, which can be, for example, VMware, KVM, Hyper-V, Virtual Box, Azure, etc. However, using a virtual machine in production is not recommended, it is advisable only to conduct an assessment. In order to fully utilize the program in production, all procedures for installing Linux, PHP, MySQL and Apache must be run on the company's equipment.
Evaluation. The initial deployment of PRTG is much simpler, since it consists only in installing the program on a Windows PC. This is a task that is completed in just a few minutes. This installation option can be freely used in a production environment, unlike the Zabbix tool. It is difficult to install, and you can only use a virtual machine for evaluation.
PRTG interface. Simple and understandable, in recent years has been improved and modernized. A web version, a Windows client and a mobile application are provided. Functional elements are conveniently located in intuitive places. The procedure for adding new monitoring objects and sensors is also understandable and quick. Visualization of network information, alarms, alerts, alerts, etc. presented on the information panel quite intelligibly, clearly and in a form convenient for interpretation. It also has a reporting module with the most frequently used functions, which allows you to create new reports in accordance with the needs of the company.
Zabbix interface. It seemed quite confusing, with complex terminology. There you must enter the hosts, not the device, as is done in PRTG. There is no program for the PC, but there is a mobile application. It is assumed that the Zabbix interface, as in the PRTG, should be an information panel, but it does not contain enough useful information, and it is not organized in a didactic way. The program provides all the same functions of organizing an information panel as in PRTG, but they must be configured manually.
Perform Auto Discovery function in PRTG. This option is provided with the installed product. It allows you to "comb" the network, detect existing devices and display them in the system. The function of conducting a detailed analysis involves a large number of sensors or is implemented by adding the most common sensors. In both cases, to simplify or improve monitoring, sensors can be removed or added later.
Perform Auto Discovery function in Zabbix. At the time of product installation, the ability to view network status, detect devices and display them in the system is missing. When the program is fully active, the discovery process can be started, however, in a very complicated and very technological way using various protocol-based options (mainly SNMP).
To simplify or improve monitoring, sensors can be removed or added later. There are also several models that can be simplified, but their number is much smaller.
Adding new sensors to PRTG. Each interface element is displayed on the sensor network, to which sensors can be added manually or using an automatic detection process. This helps the system to quickly detect or limit the types of sensors that need to be highlighted. For example, you can specify a search based on the information that such a device is a virtualization server and limit only searches for sensors related to the use of VMware memory, Hyper-V, etc. In addition, this operation has a very simple assistant.
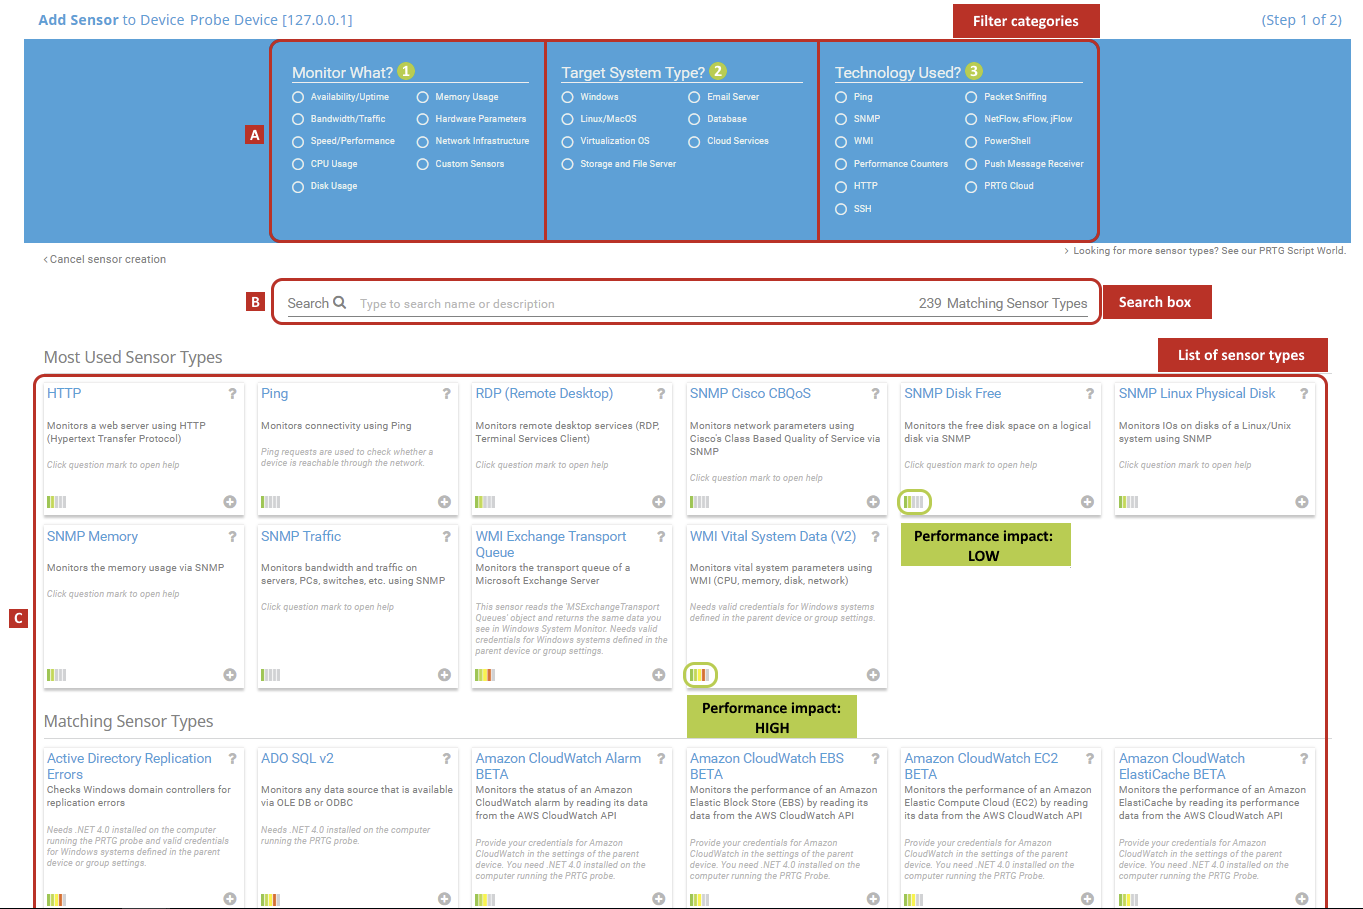
Image 17: Example of adding a sensor to PRTG
Adding new sensors to Zabbix. It is not easy, but rather universal. Not just because it involves defining many of the parameters of SNMP, version 1, version 2, version 3, protocols, clear authentication (PRTG allows you to inherit credentials from the parent device), NMP interface, JMX definitions, IPMI, etc. that on the one hand, they can open up (in theory) ample opportunities, but on the other hand, they are not so easy to use. Alternatively, you can use the agent installed on each device (explained below).

Image 18: An example of the procedure for adding a sensor in Zabbix
There is a fundamental difference between Zabbix and PRTG. Zabbix adheres to the concept of multi-agent or agentless monitoring, while PRTG uses standard network protocols, such as SNMP, Stream, Ping, FTP, packet analysis, etc. Zabbix requires the installation of an agent on each monitored device.
This is not always possible, and in such cases the program also supports some basic protocols, for example, SNMP or TCP. Using remote probes, PRTG offers additional search engines that can be used for load distribution. PRTG is also best suited for monitoring locally distributed networks (subnets, VLANs, etc.) or network segments separated by firewalls (usually remote).
Remote monitoring in PRTG. There is the concept of remote probes that perform the function of monitoring a network other than the one in which the PRTG is installed. Their installation is very simple: on a Windows PC, you must release the correct TCP port in the firewall and the IP on which the remote probe is installed. Thus, these and other devices on your network are visible to the PRTG, as if they were from the network itself. The remote probe periodically (very often) collects all monitoring data from all monitored devices and applications on the network, uses standard protocols, and sends the monitoring data to a basic server using SSL encryption. This is a fairly reliable solution!
Remote monitoring in Zabbix. There is a concept of “agents” that, in fact, play the same role as PRTG probes that exist for Windows and for some Linux distributions, such as Ubuntu, FreeBSD, OpenBSD, AIX, etc. The installation of agents is quite simple, however, difficulties with the allocation of sensors on remote devices are the same as the difficulties with the allocation of sensors on local devices. Remote monitoring requires an established network connection. Without network access, remote locations will not be available for monitoring.
PRTG support. There are discussion groups, e-mail support, forums, frequently asked questions (FAQs), a knowledge base, and for those who have purchased a product, you can access the questionnaire for 12, 24 or 36 months (when you open the application), which provides priority email support. The maintenance plan must be updated for updates and support. Even without extending the maintenance contract, you can still use the software, but without priority support or product updates.
Zabbix support. There are discussion groups, forums and the possibility of attracting support, which is divided into levels: bronze, silver, gold, platinum and corporate. Prices are not presented on the site, price offers depend on each specific case. Thus, the product is free, but support is paid, and because of the complexity of the product, it will be necessary.
Zabbix PRTG – , , , , , Wi-Fi .., . Zabbix , , PRTG. PRTG Zabbix. , , . , . Zabbix , PRTG. , , , . , PRTG . . Zabbix 5- , Zabbix.
, – , . PRTG 2012, 2014, 2016 2018 , .
- , . , , , . , , . PRTG .
. , , , , .
Paessler PRTG. 30 . Paessler , 500, 1000, 2500 5000 . .
30- - ( ). , . , , , , 500 1000 ( ).
PRTG . , , , . . , .
PRTG 2018 , , , , -, . , , , , , . , , , .
PRTG , 30 ( ).
: Flavio Xandó. A source
Paessler PRTG .
Paessler PRTG Softline ( Paessler ) , Natalya.Boldyreva@softline.com.
The concept of PRTG and its characteristics are not new. However, Paessler has been working hard year after year, with the result that important changes in the form, interface and functionality of its products are realized. In this regard, it is necessary to conduct a new assessment. This time the environment was analyzed, which consisted of the following locations, equipment and functionality:
')
- 8 remote locations
- 16 physical servers
- 30 virtual servers
- 18 internet channels
- 45 Wi-Fi access points
- 31 network printer
- 9 dual internet routers
- 25 switching devices
- more than 500 users in all placements
Focus: Sensors!
It seems that it is enough to understand when something is going well or badly; nevertheless, it is necessary to comply with the basic requirements. There must be an observation point, a variable that can be measured, and a specific standard, a reference value, is also needed. In PRTG, we call these observation points sensors.
It is easy to list the elements of the IT environment that need to be monitored for analysis, diagnostics, preventive procedures, adjustments, etc. There are a variety of sensors in PRTG that go beyond the obvious and allow monitoring of complex scenarios. In each new version of this tool, new types of sensors are presented to the monitoring world as peripheral functions, which greatly facilitates the work.
Image 1: Monitored Environment Overview
With each new version of PRTG, new monitoring capabilities are being introduced, they are increasingly being improved and specialized. There are many interesting features, such as monitoring hardware, software environments, networks, data traffic, etc. Commercially, a product license is granted based on the number of sensors required. For this reason, it is important to conduct a thorough assessment of the actual need for control points, since if more sensors are used, it will be necessary to purchase a license to support them. This is not a problem, since at any time you can purchase more sensors by paying only the difference in cost between the current and the required licenses.
However, too many sensors deployed in the IT environment and visible in the PRTG panel can clog the console and make it difficult to determine what needs to be analyzed first. A balance is needed between quantity, quality, and the ability to evaluate information, and the PRTG helps in this task.
It does not make sense to give in this text all the sensors existing in PRTG, since there are a lot of them. But there are several among them that are considered simple and usually serve as the starting point of any deployment. These include sensors: presence (response to the PING command), CPU utilization level, free disk space, operating time, number of printed pages, etc. But there are also highly specialized sensors that monitor specific applications, such as SQL Server, Microsoft Exchange, Oracle, Web server, etc.
Image 2: Microsoft SQL Sensor
In the latest versions of PRTG, this type of specialized monitoring is widely used, serving not only Windows servers, but also Linux, virtualization environments, etc. In the case of Windows servers, sensors can be deployed that monitor the performance of specific services that are critical to the operation. If any of these sensors fail or stop working, you can take immediate action. In addition, PRTG allows you to configure re-activation of the service in case of its interruption. Thus, the program not only warns about stopping the service with an indication of a failure that needs to be fixed, but also takes appropriate corrective measures. The main function of PRTG is, of course, monitoring, but for this type of sensor this option is also provided.
In the figure below you can see some critical services, such as DNS, DHCP, Firewall, Update, etc., that were selected for monitoring on one of the servers.
Image 3: Example of monitoring Microsoft Windows Server services
A real-life example of a complex problem solved with PRTG
The function of monitoring and restarting services has already helped to solve problems. For example, difficulties with the NETLOGON service, which prevented access to shared folders. During the new testing, this happened again, the DHCP service on one of the servers arbitrarily stopped. This prohibited access to the network by new computers when they were connected. The service re-activation function after detecting the stop helped not only smooth out this problem, but also finally solve it.
The network was an access point in the outlet with poor contact. This periodically made him reconnect. This access point, even when it was configured with its own DHCP turned off, was raised during the “boot” with DHCP enabled and then connected. The Windows DHCP server turned off when it detected another DHCP on the network (access point). During a search in the PRTG and Windows log, a conflict was found between the two DHCP services that were turned off. After determining the IP address, the access point was found. But this was not immediately clear, since DHCP was turned off. After updating the firmware of this access point, the problem was resolved. In fact, during a shutdown, it itself went through a post-boot with DHCP enabled and then hung up, but sometimes this led to the shutdown of the same Windows service. Windows would have had an unmanaged DHCP service until today if it hadn't been possible to install it in the logs using PRTG.
Image 4: DHCP Manager on Windows
Detailed description of the test environment
To install the PRTG software, the company’s headquarters was chosen - a facility with a more complex infrastructure, which has several remote locations. This allowed to work first in the local network, and then remotely.
From previous deployments, the PRTG Auto-Discovery feature (automatic detection) was already familiar. It is very practical because it allows you to "scour" the network, detect devices and, depending on the policy chosen, select simple or complex sensors. Using the "simple sensors" mode, hundreds of devices were discovered and unnecessary ones were deleted, including user computers.
On servers that did not receive the expected level of information, Auto-Discovery was restarted with the ability to select more sensors and get more analysis points. On the other hand, some servers have activated 20, 30, or even more sensors.
Auto-Discovery can be performed for the entire network, usually during initial deployment. However, it may be used later to supplement the sensors on a device that has little information, by introducing dozens more new sensors.
Image 5: Adding Sensors with Auto Detection
In such a situation, it is important that the PRTG administrator be present, who can review the sensors and leave only those that matter most to him. Minor can be selected and immediately removed. As a rule, first you want to create sensors for everything, but it is useless and can even interfere.
Let's draw an analogy with the medical intensive care unit. Is there any advantage of keeping the patient's hair informed? Or, in the case of the server, is it necessary to report how many times the virtual memory paging file has been used? If an extraordinary event occurs for which a large analysis is required, the PRTG immediately allows you to select additional sensors and immediately disconnect after use. It is wiser to continuously monitor what is directly related to your environment.
The use of Auto-Discovery in early versions of PRTG was more difficult, since both devices and sensors in large quantities were placed on the device panel in a not very structured way. However, from 2016, devices are automatically added to a group called Network Discovery (network discovery) and subgroups with very didactic names, such as “Servers”, “Network”, “Virtual Systems”, “Printers”, etc. Thus, it is much easier to make the necessary adjustments, the choice of devices and sensors that must be removed or left.
Monitoring branches or offices using remote probes
The test environment included several branches and small remote offices. How can you monitor these environments? Like space and underwater probes, equipment sent to remote locations for analyzing information, the concept of probes to meet this kind of need is also present in the PRTG.
The concept of remote probes is very well applied to remote locations, branches, offices, to which a VPN connection or dedicated channels (for example, MPLS) with the headquarters, where the PRTG core is installed, do not necessarily exist. Access to the PRTG server is also provided via the Internet. This is a very lightweight application installed on small local servers or even on ordinary workstations.
Image 6: Remote probes in PRTG
If the remote environment uses a large number of sensors on many devices, probe processing will be more intensive and may require a dedicated computer. Security when accessing the probe is guaranteed by strict security measures that allow you to avoid unauthorized access. During installation, a password is generated to connect to the central PRTG, the access IP address must be previously registered / authorized and, in addition, the probe must be approved in the PRTG console. An important reminder: at the central point, in the firewall, TCP port 23560 must be opened, and traffic must be redirected from this port to the server running PRTG (the core server).
Image 7: PRTG Administration Tool for remote probes
After the probes are installed and approved, the PRTG administrator can request the Auto-Discovery function on a remote network to discover devices, allocate sensors, or obtain permission to install sensors manually, including at the central location of the PRTG core installation. Thus, remote offices receive as much attention as the central point. Simple and effective!
It is important to note how PRTG handles version updates related to remote probes. When the PRTG kernel is updated, they receive this information and proceed to automatic updating. This ensures communication with the probes, and after updating the new sensor functions (or sensors) will be available in remote locations.
Web interface, PC and mobile applications
The natural interface of the PRTG is a web console. This allows the administrator to connect to the program from any computer from anywhere in the world and perform all the tasks of monitoring, creating new sensors, implementing remote probes, etc.
With each new version there is an update and modernization of the web interface - it is becoming more and more clear and didactic.
Image 8: PRTG web interface
The expression "didactic interface" is applicable, since it immediately attracts attention with images in the form of donut charts, clearly shows the number of sensors used, how many of them are green (OK), yellow (warning) and red (error). The second graph, also in the form of a ring, presents the number of warnings and errors. In our example, 73 warnings and 15 errors were detected, i.e. non-standard defective devices or sensors.
Image 9: PRTG web interface - device tree, including remote probes
The web interface contains all the functionality of PRTG, they are also available in the application called PRTG Desktop.
Image 10: PRTG Desktop Client
There is an important distinction between PRTG Desktop and the web interface. Despite the fact that they display the same information, PRTG Desktop has the ability to launch a screen with critical alerts when booting. Paessler replaces the Enterprise Console with a new PRTG Desktop program. This is a beta version that you can use and evaluate at .
There is also a similar version of the application for mobile devices. With it, the administrator can receive notifications about the health of their infrastructure, wherever he is. Even without a computer, it can access PRTG (or PRTG Desktop). There are versions of the application for iOS and Android. The simplified interface displays devices, remote probes, and locations. It uses the same symbols, colors and visual templates to make it easier to evaluate the device or location. The element to which the alarm relates can be opened, and each touch of the screen opens up more and more details until you understand the essence of the problem. You can view applications and temporarily suspend the alarm (for example, for a printer that is sent for maintenance for 3 days, the sensor may be suspended to not generate an alarm during this time).
PRTG provides the ability to deliver instant notifications to the application. Usually, the sensor is updated every “x” seconds, and you can also configure it so that when a certain situation occurs, an immediate notification of the administrator, user or the whole group will come.
Image 11: Smartphone PRTG screen - sensor evaluation without problems
Internal ticket system for event management
In addition to everything PRTG includes a very useful resource - a system for interaction between analysts and users in resolving incidents. It was designed to concentrate on supporting requests generated by alerts and alarms sent by the PRTG. This resource is a real bonus for IT departments, which allows professionals to interact not only with each other, but also with users.
Immediately after detecting errors, alerts are sent to the control panel. In addition, an incident report message is delivered to the specified email address. If the situation is resolved without outside intervention, another email is sent notifying you that the situation has been resolved. This can happen in the case, for example, of a temporary unavailability of an Internet connection, excessive consumption of CPU resources on a server, etc.
But more often than not, a notification requires the intervention of an operator or a help desk analyst to solve the problem immediately or after a short period of time. The PRTG automatically generates claims, for example, based on Auto-Discovery notifications of discontinuance or the need to approve a remote probe.
In addition, the system administrator can create requests in our own support service for triggered alarms or other tasks. Thus, the decision of the situation that has arisen is assigned to a specific person (possessing the relevant competencies). Then the performer receives an e-mail, enters the PRTG under his account and sees on the screen all the tasks that were assigned to him. Application initiators assign one of five levels of priority to their assignments so that the responsible officer plans his work schedule.
Image 12: PRTG screen - ticket system
Predictive alerts for alleged problems
This function has long been present in PRTG, but the program contains new elements for predicting and analyzing problems. This is an alert for unusual behavior. For example, take the recently received notice below. The network worked perfectly, there was not a single sensor signaling an error. However, one of the servers issued the message "Access to this address (PING) is extremely high for this time of day." Do you understand how important this is? This address was just an external DNS that used the Internet access router, which was characterized by a large delay on Sundays. It was necessary to immediately change this DNS to another, otherwise, on Monday, hundreds of people would start using this network, and access to the Internet could be at risk. The presence of this function gives tremendous opportunities, and it is very convenient.
The screen below shows this case of unusual activity. Notice the orange color of the alert and the code “U”, which means “Unusual” (Unusual). In fact, this alert was generated at the weekend when the PING 132ms is indeed high. This was the beginning of the study, during which the replication process that was taking place between the servers was discovered, which caused this behavior.
Image 13-14: PRTG screen in the web interface - event rating
Reports
Sensors generate very large amounts of data, their organization and management is handled by PRTG. Information is needed to keep managers abreast of events that may affect business processes, downtime, weaknesses, etc. PRTG also has important tools for analyzing historical data. This is a module that presents some very interesting off-the-shelf reports, such as:
- General report for all sensors
- Top 100 uptime / downtime
- Sensors with the longest and shortest PING response times
- Devices with the highest and lowest network bandwidth usage
- Other types of reports
In addition to such models, which can be selected using several filtering conditions, analysis period, etc., there is a tool for generating reports. With it, the administrator can create a report with important information for themselves, containing numeric or graphical data.
Image 15: PRTG Standard Reports
Image 16: Example PRTG report for devices with the longest and shortest PING response times
Comparative analysis with Zabbix system (market alternative)
During the evaluation of the PRTG program, the idea was born of comparing it with a product that is similar to it in functionality. Zabbix solution has some support in the market, so it was decided to make a comparison with it. Zabbix has zealous fans mainly because it is open source software and has “zero cost”. This factor is pretty serious bait. But can this alone be a decisive advantage over PRTG?
Installing PRTG. PRTG includes a program running on the Windows platform (version 7 or higher), and the installation package that performs the monitoring function is downloaded from the Paessler website. If there are too many monitoring sensors, it is recommended to allocate one machine exclusively for PRTG. In all tests performed, where up to 1000 sensors were used, a Windows Server was involved, which even had the form of an Active Directory (despite the fact that this is not entirely correct). Paessler strongly condemns the practice of installing PRTG in AD, because this server can be restarted in case of a PRTG update. We made this mistake in our test, and therefore we emphasize that this should not be done!
Installing Zabbix. The site has links to download the installation modules on the Linux system. They require Apache, PHP and MySQL databases. There are instructions on Apache installations, on how to create a database in MySQL, and how to set up PHP. The instructions are not very complicated, but they require care and attention at every stage. Alternatively, you can download a virtual machine image, as we did, because it immediately contains preconfigured Linux, PHP, Apache, and MySQL. However, this requires a virtualization environment, which can be, for example, VMware, KVM, Hyper-V, Virtual Box, Azure, etc. However, using a virtual machine in production is not recommended, it is advisable only to conduct an assessment. In order to fully utilize the program in production, all procedures for installing Linux, PHP, MySQL and Apache must be run on the company's equipment.
Evaluation. The initial deployment of PRTG is much simpler, since it consists only in installing the program on a Windows PC. This is a task that is completed in just a few minutes. This installation option can be freely used in a production environment, unlike the Zabbix tool. It is difficult to install, and you can only use a virtual machine for evaluation.
PRTG interface. Simple and understandable, in recent years has been improved and modernized. A web version, a Windows client and a mobile application are provided. Functional elements are conveniently located in intuitive places. The procedure for adding new monitoring objects and sensors is also understandable and quick. Visualization of network information, alarms, alerts, alerts, etc. presented on the information panel quite intelligibly, clearly and in a form convenient for interpretation. It also has a reporting module with the most frequently used functions, which allows you to create new reports in accordance with the needs of the company.
Zabbix interface. It seemed quite confusing, with complex terminology. There you must enter the hosts, not the device, as is done in PRTG. There is no program for the PC, but there is a mobile application. It is assumed that the Zabbix interface, as in the PRTG, should be an information panel, but it does not contain enough useful information, and it is not organized in a didactic way. The program provides all the same functions of organizing an information panel as in PRTG, but they must be configured manually.
Perform Auto Discovery function in PRTG. This option is provided with the installed product. It allows you to "comb" the network, detect existing devices and display them in the system. The function of conducting a detailed analysis involves a large number of sensors or is implemented by adding the most common sensors. In both cases, to simplify or improve monitoring, sensors can be removed or added later.
Perform Auto Discovery function in Zabbix. At the time of product installation, the ability to view network status, detect devices and display them in the system is missing. When the program is fully active, the discovery process can be started, however, in a very complicated and very technological way using various protocol-based options (mainly SNMP).
To simplify or improve monitoring, sensors can be removed or added later. There are also several models that can be simplified, but their number is much smaller.
Adding new sensors to PRTG. Each interface element is displayed on the sensor network, to which sensors can be added manually or using an automatic detection process. This helps the system to quickly detect or limit the types of sensors that need to be highlighted. For example, you can specify a search based on the information that such a device is a virtualization server and limit only searches for sensors related to the use of VMware memory, Hyper-V, etc. In addition, this operation has a very simple assistant.
Image 17: Example of adding a sensor to PRTG
Adding new sensors to Zabbix. It is not easy, but rather universal. Not just because it involves defining many of the parameters of SNMP, version 1, version 2, version 3, protocols, clear authentication (PRTG allows you to inherit credentials from the parent device), NMP interface, JMX definitions, IPMI, etc. that on the one hand, they can open up (in theory) ample opportunities, but on the other hand, they are not so easy to use. Alternatively, you can use the agent installed on each device (explained below).
Image 18: An example of the procedure for adding a sensor in Zabbix
PRTG and Zabbix use different concepts to activate monitoring.
There is a fundamental difference between Zabbix and PRTG. Zabbix adheres to the concept of multi-agent or agentless monitoring, while PRTG uses standard network protocols, such as SNMP, Stream, Ping, FTP, packet analysis, etc. Zabbix requires the installation of an agent on each monitored device.
This is not always possible, and in such cases the program also supports some basic protocols, for example, SNMP or TCP. Using remote probes, PRTG offers additional search engines that can be used for load distribution. PRTG is also best suited for monitoring locally distributed networks (subnets, VLANs, etc.) or network segments separated by firewalls (usually remote).
Remote monitoring in PRTG. There is the concept of remote probes that perform the function of monitoring a network other than the one in which the PRTG is installed. Their installation is very simple: on a Windows PC, you must release the correct TCP port in the firewall and the IP on which the remote probe is installed. Thus, these and other devices on your network are visible to the PRTG, as if they were from the network itself. The remote probe periodically (very often) collects all monitoring data from all monitored devices and applications on the network, uses standard protocols, and sends the monitoring data to a basic server using SSL encryption. This is a fairly reliable solution!
Remote monitoring in Zabbix. There is a concept of “agents” that, in fact, play the same role as PRTG probes that exist for Windows and for some Linux distributions, such as Ubuntu, FreeBSD, OpenBSD, AIX, etc. The installation of agents is quite simple, however, difficulties with the allocation of sensors on remote devices are the same as the difficulties with the allocation of sensors on local devices. Remote monitoring requires an established network connection. Without network access, remote locations will not be available for monitoring.
PRTG support. There are discussion groups, e-mail support, forums, frequently asked questions (FAQs), a knowledge base, and for those who have purchased a product, you can access the questionnaire for 12, 24 or 36 months (when you open the application), which provides priority email support. The maintenance plan must be updated for updates and support. Even without extending the maintenance contract, you can still use the software, but without priority support or product updates.
Zabbix support. There are discussion groups, forums and the possibility of attracting support, which is divided into levels: bronze, silver, gold, platinum and corporate. Prices are not presented on the site, price offers depend on each specific case. Thus, the product is free, but support is paid, and because of the complexity of the product, it will be necessary.
Zabbix PRTG – , , , , , Wi-Fi .., . Zabbix , , PRTG. PRTG Zabbix. , , . , . Zabbix , PRTG. , , , . , PRTG . . Zabbix 5- , Zabbix.
| Parameter | PRTG | ZABBIX |
|---|---|---|
| Installation | Windows ( , ). | , Linux Hypervisor. |
| , . - . | , . , . | |
| Auto Discovery ( ) | . Auto Discovery . | . , , SNPM. |
| , , . -, /. | , . . , , . | |
| PRTG - , , . | Zabbix , . , , , . | |
| PRTG - , , . , , , .. PRTG, , , , SSL. | , . , PRTG. | |
| Support | (FAQs), , . , . | (FAQs), , : , , , . |
| Price | 100 . 500, 1000, 2500, 5000 . Paessler , . | , , . Zabbix , . |
Conclusion
, – , . PRTG 2012, 2014, 2016 2018 , .
- , . , , , . , , . PRTG .
. , , , , .
Paessler PRTG. 30 . Paessler , 500, 1000, 2500 5000 . .
30- - ( ). , . , , , , 500 1000 ( ).
PRTG . , , , . . , .
PRTG 2018 , , , , -, . , , , , , . , , , .
PRTG , 30 ( ).
: Flavio Xandó. A source
Paessler PRTG .
Paessler PRTG Softline ( Paessler ) , Natalya.Boldyreva@softline.com.
Source: https://habr.com/ru/post/433414/
All Articles