We write trading robots using the StockSharp graphic framework. Part 2
We continue to talk about creating trading robots using the StockSharp platform. The first article dealt with the creation of the project and the drawing of the main elements of the trading system. In the final material of the cycle, we will deal directly with the implementation of a trading strategy.
Creating a dashboard portfolio
By analogy with the toolbar, create a log panel. To do this, add another UserControl to the XAML folder. Give it the name PortfolioGridControl. Add a PortfolioGrid element to it.
')
<UserControl x:Class="ShellNew.XAML.PortfolioGridControl" xmlns="http://schemas.microsoft.com/winfx/2006/xaml/presentation" xmlns:x="http://schemas.microsoft.com/winfx/2006/xaml" xmlns:mc="http://schemas.openxmlformats.org/markup-compatibility/2006" xmlns:d="http://schemas.microsoft.com/expression/blend/2008" xmlns:xaml="http://schemas.stocksharp.com/xaml" mc:Ignorable="d" d:DesignHeight="450" d:DesignWidth="800"> <xaml:PortfolioGrid x:Name="PortfolioGrid" /> </UserControl> In the PortfolioGridControl designer, we need to subscribe to the events of the appearance of a new portfolio and the event of the emergence of a new position at the Connector.
public PortfolioGridControl() { InitializeComponent(); MainWindow.Instance.Connector.NewPortfolio += PortfolioGrid.Portfolios.Add; MainWindow.Instance.Connector.NewPosition += PortfolioGrid.Positions.Add; } Thus, when creating a new portfolio, it will appear in the portfolios panel, and when a new position appears in the portfolios panel, it will be updated.
Add the PortfolioGridControl panel created to the central part of the MainWindow:
<dxlc:LayoutGroup HorizontalAlignment="Stretch" View="Tabs"> <!-- --> <dxlc:LayoutGroup Header="Securities"> <myxaml:SecurityGridControl x:Name="SecurityPanel" /> </dxlc:LayoutGroup> <dxlc:LayoutGroup Header="Portfolios"> <myxaml:PortfolioGridControl x:Name="PortfolioGridControl" /> </dxlc:LayoutGroup> </dxlc:LayoutGroup> Run to check:
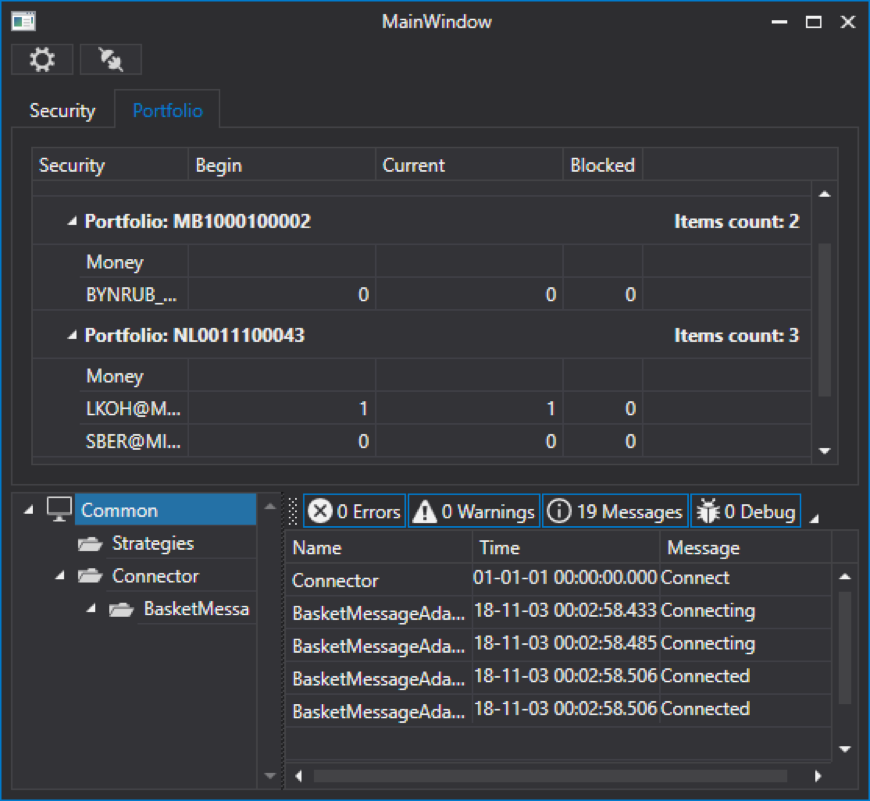
We have a tab with portfolios.
Creation of orders panel
The order pane in S # .API has the ability to place bids, withdraw bids and re-register. By analogy with the toolbar, create an order panel, add another UserControl to the XAML folder. Give it the name OrderGridControl. Add an OrderGrid element to it:
<UserControl x:Class="ShellNew.XAML.OrderGridControl" xmlns="http://schemas.microsoft.com/winfx/2006/xaml/presentation" xmlns:x="http://schemas.microsoft.com/winfx/2006/xaml" xmlns:mc="http://schemas.openxmlformats.org/markup-compatibility/2006" xmlns:d="http://schemas.microsoft.com/expression/blend/2008" xmlns:xaml="http://schemas.stocksharp.com/xaml" mc:Ignorable="d" d:DesignHeight="450" d:DesignWidth="800"> <xaml:OrderGrid x:Name="OrderGrid" /> </UserControl> OrderGrid has an OrderRegistering order registration event, an OrderReRegistering order re-registration event and an OrderCanceling order event.
Create their handlers:
<UserControl x:Class="ShellNew.XAML.OrderGridControl" xmlns="http://schemas.microsoft.com/winfx/2006/xaml/presentation" xmlns:x="http://schemas.microsoft.com/winfx/2006/xaml" xmlns:mc="http://schemas.openxmlformats.org/markup-compatibility/2006" xmlns:d="http://schemas.microsoft.com/expression/blend/2008" xmlns:xaml="http://schemas.stocksharp.com/xaml" mc:Ignorable="d" d:DesignHeight="450" d:DesignWidth="800"> <xaml:OrderGrid x:Name="OrderGrid" OrderRegistering="OrderGrid_OnOrderRegistering" OrderReRegistering="OrderGrid_OnOrderReRegistering" OrderCanceling="OrderGrid_OnOrderCanceling" /> </UserControl> In the event registration event handler, we create an OrderWindow window in which you need to specify data sources for instruments, portfolios, and market data. In our case, this will all be Connector.
After that, we call the OrderWindow method ShowModal. If the OK button was pressed in this window, then we register the request via the RegisterOrder method:
private void OrderGrid_OnOrderRegistering() { var newOrder = new OrderWindow { Title = "Order registering", Order = new Order(), SecurityProvider = MainWindow.Instance.Connector, MarketDataProvider = MainWindow.Instance.Connector, Portfolios = new PortfolioDataSource(MainWindow.Instance.Connector), }; if (newOrder.ShowModal(this)) MainWindow.Instance.Connector.RegisterOrder(newOrder.Order); } In the handler of the re-registration event, we do everything in the same way. Only in this case, the Order object arrives at the event — this is the application that needs to be reregistered. Therefore, in OrderWindow, we specify
Order = order.ReRegisterClone(newVolume: order.Balance) to fill in the fields of the OrderWindow window.After that, we call the OrderWindow method ShowModal. If the OK button was pressed in this window, we will re-register the application through the ReRegisterClone method. In it, we pass the old application, which must be canceled, and a new one, which must be submitted.
private void OrderGrid_OnOrderReRegistering(Order order) { var window = new OrderWindow { Title = "Order re-registering", SecurityProvider = MainWindow.Instance.Connector, MarketDataProvider = MainWindow.Instance.Connector, Portfolios = new PortfolioDataSource(MainWindow.Instance.Connector), Order = order.ReRegisterClone(newVolume: order.Balance) }; if (window.ShowModal(this)) MainWindow.Instance.Connector.ReRegisterOrder(order, window.Order); } In the event handler for the cancellation of an order, it is enough to call the CancelOrder method and pass an order to it, which must be canceled:
private void OrderGrid_OnOrderCanceling(Order order) { MainWindow.Instance.Connector.CancelOrder(order); } In order for bids to be displayed in the OrderGrid, it is necessary in the OrderGridControl constructor to subscribe to the events of the appearance of a new bid and to the registration error event, and then transfer these events to the OrderGrid:
public OrderGridControl() { InitializeComponent(); MainWindow.Instance.Connector.NewOrder += OrderGrid.Orders.Add; MainWindow.Instance.Connector.OrderRegisterFailed += OrderGrid.AddRegistrationFail; } Add the created OrderGridControl panel to the central part of the MainWindow:
<dxlc:LayoutGroup HorizontalAlignment="Stretch" View="Tabs"> <!-- --> <dxlc:LayoutGroup Header="Securities"> <myxaml:SecurityGridControl x:Name="SecurityPanel" /> </dxlc:LayoutGroup> <dxlc:LayoutGroup Header="Portfolios"> <myxaml:PortfolioGridControl x:Name="PortfolioGridControl" /> </dxlc:LayoutGroup> <dxlc:LayoutGroup Header="Orders"> <myxaml:OrderGridControl x:Name="OrderGridControl" /> </dxlc:LayoutGroup> </dxlc:LayoutGroup> Run to check:

Creating a panel of your own transactions
By analogy with the toolbar, create a panel of your own transactions. Add another UserControl to the XAML folder. Give it the name MyTradeGridControl. Add the MyTradeGrid element to it:
<UserControl x:Class="ShellNew.XAML.MyTradeGridControl" xmlns="http://schemas.microsoft.com/winfx/2006/xaml/presentation" xmlns:x="http://schemas.microsoft.com/winfx/2006/xaml" xmlns:mc="http://schemas.openxmlformats.org/markup-compatibility/2006" xmlns:d="http://schemas.microsoft.com/expression/blend/2008" xmlns:xaml="http://schemas.stocksharp.com/xaml" mc:Ignorable="d" d:DesignHeight="450" d:DesignWidth="800"> <xaml:MyTradeGrid x:Name="MyTradeGrid" /> </UserControl> In the MyTradeGridControl constructor, we need to subscribe to events of the appearance of a new own transaction and transfer it to MyTradeGrid:
public MyTradeGridControl() { InitializeComponent(); MainWindow.Instance.Connector.NewMyTrade += MyTradeGrid.Trades.Add; } Add the created OrderGridControl panel to the central part of the MainWindow:
<dxlc:LayoutGroup HorizontalAlignment="Stretch" View="Tabs"> <!-- --> <dxlc:LayoutGroup Header="Securities"> <myxaml:SecurityGridControl x:Name="SecurityPanel" /> </dxlc:LayoutGroup> <dxlc:LayoutGroup Header="Portfolios"> <myxaml:PortfolioGridControl x:Name="PortfolioGridControl" /> </dxlc:LayoutGroup> <dxlc:LayoutGroup Header="Orders"> <myxaml:OrderGridControl x:Name="OrderGridControl" /> </dxlc:LayoutGroup> <dxlc:LayoutGroup Header="MyTrades"> <myxaml:MyTradeGridControl x:Name="MyTradeGridControl" /> </dxlc:LayoutGroup> </dxlc:LayoutGroup> Run to check:

Creating a dashboard with a strategy
We will create a strategy panel in the same way as all previous panels. Add another UserControl to the XAML folder. Give it the name StrategyControl. Using LayoutControl, we split the screen form into two parts. On the left side there will be a tab with a candle chart and a tab with strategy statistics:
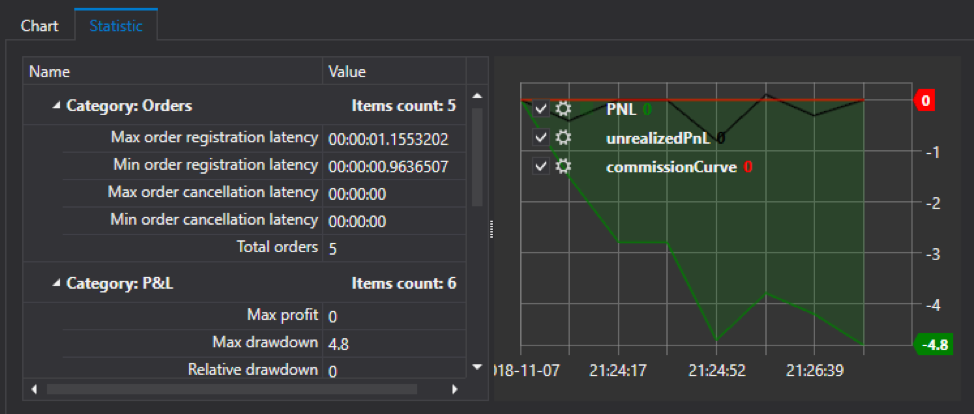
<dxlc:LayoutGroup Orientation="Vertical"> <dxlc:LayoutGroup View="Tabs" Name="StatistisAndChartLayoutGroup"> <dxlc:LayoutGroup Header="Chart"> <xaml:Chart x:Name="Chart" /> </dxlc:LayoutGroup> <dxlc:LayoutGroup Header="Statistic"> <dxlc:LayoutItem VerticalAlignment="Stretch" dxlc:LayoutControl.AllowHorizontalSizing="True" > <xaml:StatisticParameterGrid x:Name="StatisticParameterGrid" MaxHeight="2000"/> </dxlc:LayoutItem> <dxlc:LayoutItem VerticalAlignment="Stretch" > <xaml:EquityCurveChart x:Name="EquityCurveChart" /> </dxlc:LayoutItem> </dxlc:LayoutGroup> </dxlc:LayoutGroup> </dxlc:LayoutGroup> Here, StatisticParameterGrid is used to display strategy statistics, and EquityCurveChart is used to display profit and loss graphs. For StatisticParameterGrid, you need to set some MaxHeight value, otherwise the application will not start.
In the right part, the properties of the strategy will be set in the PropertyGridEx. And also will be located the start and stop buttons of the strategy:
<dxlc:LayoutGroup View="Group" dxlc:LayoutControl.AllowHorizontalSizing="True" dxlc:DockLayoutControl.Dock="Right" Orientation="Vertical"> <dxlc:LayoutItem VerticalAlignment="Stretch"> <xaml:PropertyGridEx x:Name="PropertyGridEx" /> </dxlc:LayoutItem> <dxlc:LayoutItem VerticalAlignment="Stretch" Height="20"> <dx:SimpleButton x:Name="StartStrategyButton" Content="Start strategy" ToolTip="Start strategy" Click="StartStrategyButton_Click" /> </dxlc:LayoutItem> <dxlc:LayoutItem VerticalAlignment="Stretch" Height="20"> <dx:SimpleButton x:Name="StopStrategyButton" Content="Stop strategy" ToolTip="Stop strategy" Click="StopStrategyButton_Click" /> </dxlc:LayoutItem> </dxlc:LayoutGroup> Full code:
<UserControl x:Class="ShellNew.XAML.StrategyControl" xmlns="http://schemas.microsoft.com/winfx/2006/xaml/presentation" xmlns:x="http://schemas.microsoft.com/winfx/2006/xaml" xmlns:mc="http://schemas.openxmlformats.org/markup-compatibility/2006" xmlns:d="http://schemas.microsoft.com/expression/blend/2008" xmlns:dxlc="http://schemas.devexpress.com/winfx/2008/xaml/layoutcontrol" xmlns:xaml="http://schemas.stocksharp.com/xaml" xmlns:dx="http://schemas.devexpress.com/winfx/2008/xaml/core" mc:Ignorable="d"> <dxlc:LayoutControl> <dxlc:LayoutGroup Orientation="Vertical"> <dxlc:LayoutGroup View="Tabs" Name="StatistisAndChartLayoutGroup"> <dxlc:LayoutGroup Header="Chart"> <xaml:Chart x:Name="Chart" /> </dxlc:LayoutGroup> <dxlc:LayoutGroup Header="Statistic"> <dxlc:LayoutItem VerticalAlignment="Stretch" dxlc:LayoutControl.AllowHorizontalSizing="True" > <xaml:StatisticParameterGrid x:Name="StatisticParameterGrid" MaxHeight="2000"/> </dxlc:LayoutItem> <dxlc:LayoutItem VerticalAlignment="Stretch" > <xaml:EquityCurveChart x:Name="EquityCurveChart" /> </dxlc:LayoutItem> </dxlc:LayoutGroup> </dxlc:LayoutGroup> </dxlc:LayoutGroup> <dxlc:LayoutGroup View="Group" dxlc:LayoutControl.AllowHorizontalSizing="True" dxlc:DockLayoutControl.Dock="Right" Orientation="Vertical"> <dxlc:LayoutItem VerticalAlignment="Stretch"> <xaml:PropertyGridEx x:Name="PropertyGridEx" /> </dxlc:LayoutItem> <dxlc:LayoutItem VerticalAlignment="Stretch" Height="20"> <dx:SimpleButton x:Name="StartStrategyButton" Content="Start strategy" ToolTip="Start strategy" Click="StartStrategyButton_Click" /> </dxlc:LayoutItem> <dxlc:LayoutItem VerticalAlignment="Stretch" Height="20"> <dx:SimpleButton x:Name="StopStrategyButton" Content="Stop strategy" ToolTip="Stop strategy" Click="StopStrategyButton_Click" /> </dxlc:LayoutItem> </dxlc:LayoutGroup> </dxlc:LayoutControl> </UserControl> In the StrategyControl constructor, we set the Connector as the data source for the PropertyGridEx, in almost every control we performed the following actions:
public StrategyControl() { InitializeComponent(); PropertyGridEx.SecurityProvider = MainWindow.Instance.Connector; PropertyGridEx.Portfolios = new PortfolioDataSource(MainWindow.Instance.Connector); } We need to somehow transfer the strategy to our control. To do this, we create a BindStraregy method in StrategyControl that will accept the strategy, save a reference to it in a local variable, and also set a strategy in the PropertyGridEx and StatisticParameterGrid.
Using the SetChart method into the strategy, we betray the chart of the Chart candles, after which the Chart strategy can be obtained using the GetChart method. We also set the Connector for the strategy.
private Strategy _strategy; public void BindStraregy(Strategy strategy) { _strategy = strategy; PropertyGridEx.SelectedObject = strategy; StatisticParameterGrid.Parameters. AddRange(_strategy.StatisticManager.Parameters); _strategy.SetChart(Chart); _strategy.Connector = MainWindow.Instance.Connector; } When working with the profit and loss schedule, it is necessary to take into account that we will start and stop the strategy, perhaps several times; the poem must be cleared with each launch of the strategy. For this, we will create a ResetEquityCurveChart method in which we will first clear EquityCurveChart. After that we need to create graphic elements for EquityCurveChart, they can specify the name, color and line type.
After that we subscribe to the PnL change event of the strategy and in the handler of this event we draw a new value on the EquityCurveChart profit / loss graph:
private void ResetEquityCurveChart() { EquityCurveChart.Clear(); var pnl = EquityCurveChart. CreateCurve("PNL", Colors.Green, ChartIndicatorDrawStyles.Area); var unrealizedPnL = EquityCurveChart. CreateCurve("unrealizedPnL", Colors.Black, ChartIndicatorDrawStyles.Line); var commissionCurve = EquityCurveChart .CreateCurve("commissionCurve", Colors.Red, ChartIndicatorDrawStyles.Line); _strategy.PnLChanged += () => { var data = new ChartDrawData(); data.Group(_strategy.CurrentTime) .Add(pnl, _strategy.PnL) .Add(unrealizedPnL, _strategy.PnLManager.UnrealizedPnL ?? 0) .Add(commissionCurve, _strategy.Commission ?? 0); EquityCurveChart.Draw(data); }; } In the event handler for pressing the Start button, we will call this method. And also we will reset the state of the strategy and run it:
private void StartStrategyButton_Click(object sender, RoutedEventArgs e) { ResetEquityCurveChart(); _strategy.Reset(); _strategy.Start(); } In the event handler, pressing the Stop button will stop the strategy.
private void StopStrategyButton_Click (object sender, RoutedEventArgs e):
{ _strategy.Stop(); } In the central part of the MainWindow, add the created StrategyControl panel:
<dxlc:LayoutGroup HorizontalAlignment="Stretch" View="Tabs"> <!-- --> <dxlc:LayoutGroup Header="Securities"> <myxaml:SecurityGridControl x:Name="SecurityPanel" /> </dxlc:LayoutGroup> <dxlc:LayoutGroup Header="Portfolios"> <myxaml:PortfolioGridControl x:Name="PortfolioGridControl" /> </dxlc:LayoutGroup> <dxlc:LayoutGroup Header="Orders"> <myxaml:OrderGridControl x:Name="OrderGridControl" /> </dxlc:LayoutGroup> <dxlc:LayoutGroup Header="MyTrades"> <myxaml:MyTradeGridControl x:Name="MyTradeGridControl" /> </dxlc:LayoutGroup> <dxlc:LayoutGroup Header="MarketDepth"> <myxaml:MarketDepthControl x:Name="MarketDepthControl" /> </dxlc:LayoutGroup> <dxlc:LayoutGroup Header="SimpleStrategyControl"> <myxaml:StrategyControl x:Name="SimpleStrategyControl" /> </dxlc:LayoutGroup> </dxlc:LayoutGroup> Creating a strategy
For example, consider creating a simple strategy with candles. She will buy if the candle is growing (green) and sell if the candle is decreasing (red).
Let's create another folder in the project - we will keep all our strategies in it. In this folder, create a new class, let's call it SimpleStrategy. All S # strategies must inherit from the base Strategy class.
public class SimpleStrategy : Strategy {} Since our strategy uses candles, we will create a public property CandleSeries and in the constructor of our strategy we will give it a default value.
public class SimpleStrategy : Strategy { public CandleSeries Series { get; set; } public SimpleStrategy() { Series = new CandleSeries(typeof(TimeFrameCandle), new Security(), TimeSpan.FromSeconds(15)) { BuildCandlesMode = MarketDataBuildModes.Build }; } } Here we indicated that candles in CandleSeries will be TimeFrameCandle, with an interval of 15 seconds (TimeSpan.FromSeconds (15)). For CandleSeries, you can specify the BuildCandlesMode candlestick creation mode. We indicated that candles will be built (MarketDataBuildModes.Build). By default, they will be built from ticks, but other data types can be specified.
Since we made the CandleSeries a public property, the CandleSeries can be additionally configured from the PropertyGridEx described in the previous paragraph. All strategies have methods that can be overridden, we need to override the OnStarted method. It is called before launching the strategy and allows you to pre-set its starting state.
protected override void OnStarted() { _connector = (Connector)Connector; Series.Security = Security; _connector .WhenCandlesFinished(Series) .Do(ProcessCandle) .Apply(this); _connector.SubscribeCandles(Series); base.OnStarted(); } Here we set the tool for CandleSeries, which is specified in the PropertyGridEx. Then create a rule processing the finished candle. In the rule we specify the method that will process each completed candle - in our case it is the ProcessCandle method. It will be described later. After everything is set, we subscribe to the appearance of candles on the CandleSeries in the connector via the SubscribeCandles method. In our case, the ProcessCandle method contains the main logic of the strategy:
private void ProcessCandle(Candle candle) { if (!IsRealTime(candle)) return; if (candle.OpenPrice < candle.ClosePrice && Position <= 0) { RegisterOrder(this.BuyAtMarket(Volume + Math.Abs(Position))); } else if (candle.OpenPrice > candle.ClosePrice && Position >= 0) { RegisterOrder(this.SellAtMarket(Volume + Math.Abs(Position))); } } First of all, we need to determine whether the candle is being built in real time or is historical. If the candle is historical, then we ignore it. Not all strategies require this, for example, strategies based on glasses do not require this as the glasses always go real time. There is no universal way to determine whether a candle is “real-time” or historical, and in each strategy this problem will have to be solved independently depending on the requirements. In this case, we will simply compare the time the candle closes with the time in the connector and if it does not exceed a certain lag, then the candle will have real-time status.
private bool IsRealTime(Candle candle) { return (Connector.CurrentTime - candle.CloseTime).TotalSeconds < 10; } Next, we look at what kind of candle it is and what the current position of the strategy is. If the candle is growing, then with a position equal to 0 we will open the position with a market bid for the volume specified by us in PropertyGridEx. If the candle is growing and the position is less than 0, then we “turn over” the position:
if (candle.OpenPrice < candle.ClosePrice && Position <= 0) { RegisterOrder(this.BuyAtMarket(Volume + Math.Abs(Position))); } The opposite actions are done for a diminishing candle:
else if (candle.OpenPrice > candle.ClosePrice && Position >= 0) { RegisterOrder(this.SellAtMarket(Volume + Math.Abs(Position))); } At the moment our strategy is ready to go. It must be passed to SimpleStrategyControl, which we created in the previous paragraph using the BindStraregy method. We do this in the MainWindow constructor immediately after the initialization of the MainWindow components.
SimpleStrategyControl.BindStraregy(new SimpleStrategy()); Run to check:

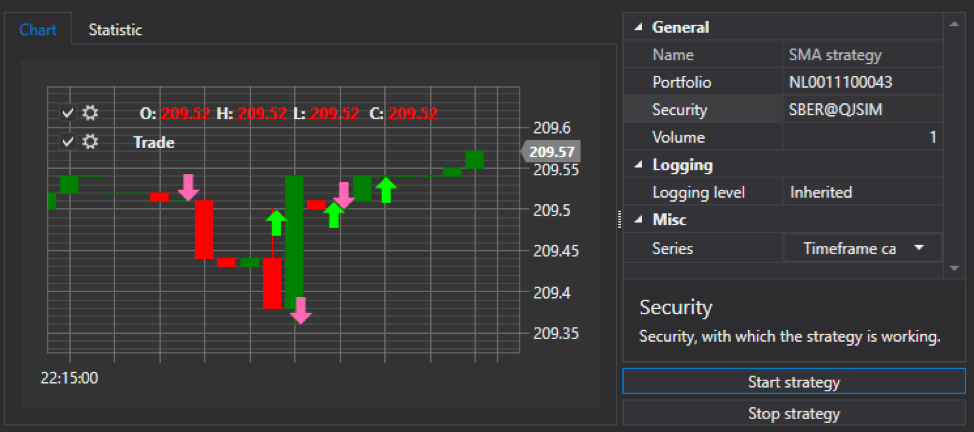
The strategy works, transactions are made, but so far there are no candles and deals on the chart.
Adding candles and deals to the chart from the strategy
In the paragraph about the strategy panel with the help of the SetChart method in the strategy, we betrayed the chart of candles Chart. In the OnStarted strategy method, we check whether the Graph is installed on the strategy and if it is installed, then we initialize the chart and also subscribe to the events of the emergence of a new own transaction and a change in the candle.
protected override void OnStarted() { _connector = (Connector)Connector; if (this.GetChart() is Chart chart) { InitChart(chart); NewMyTrade += DrawMyTrade; _connector.CandleSeriesProcessing += CandleSeriesProcessing; } Series.Security = Security; _connector .WhenCandlesFinished(Series) .Do(ProcessCandle) .Apply(this); _connector.SubscribeCandles(Series); base.OnStarted(); } InitChart chart initialization method:
private ChartCandleElement _chartCandleElement; private ChartTradeElement _tradesElem; private Chart _chart; private void InitChart(Chart chart) { _chart = chart; _chart.GuiSync(() => { _chart.ClearAreas(); var candlesArea = new ChartArea(); _chart.AddArea(candlesArea); _chartCandleElement = new ChartCandleElement(); _chart.AddElement(candlesArea, _chartCandleElement); _tradesElem = new ChartTradeElement { FullTitle = "Trade" }; _chart.AddElement(candlesArea, _tradesElem); }); } Here we store the reference to Chart in a local variable. Clear the schedule. We also create and transfer to the chart the chart elements for candles and deals. Construction _chart.GuiSync (() => {...}); needed in order for the initialization of the schedule to be executed in the main thread.
Candle drawing method on CandleSeriesProcessing chart:
private void CandleSeriesProcessing(CandleSeries candleSeries, Candle candle) { var data = new ChartDrawData(); data.Group(candle.OpenTime) .Add(_chartCandleElement, candle); _chart.Draw(data); } Here we get a candle from the event of the CandleSeriesProcessing connector, create a ChartDrawData to display it on the chart. Specify the time data.Group (candle.OpenTime), indicate that the candle should be added to the candlestick element of the graph .Add (_chartCandleElement, candle) ;. And we indicate that the graphics need to draw new data.
Similar actions are performed for transactions:
public void DrawMyTrade(MyTrade myTrade) { var data = new ChartDrawData(); data.Group(myTrade.Trade.Time) .Add(_tradesElem, myTrade); _chart.Draw(data); } Run to check:
Brief conclusion
To create a sophisticated and professional looking application, you don’t need to spend a lot of time. Within a few hours we created a full-fledged application with the ability to configure, display direct trading and algorithmic trading.
Do not be afraid to try and create your own trading programs. We hope this article will help you get started in this matter.
The author : Ivan Zalutsky
Source: https://habr.com/ru/post/433078/
All Articles