Vector product views, or another application of the Word2Vec model

Every day, one and a half million people are looking for a variety of products on Ozon, and for each of them the service should pick up similar ones (if the vacuum cleaner is still needed more powerfully) or accompanying ones (if batteries need a dinosaur to sing). When there are too many types of goods, the Word2Vec model helps to solve the problem. We understand how it works and how to create vector representations for arbitrary objects.
Motivation
To build and train a model, we use the standard machine learning technique of embedding, when each object turns into a vector of fixed length, and close objects correspond to close vectors. Almost all known models require that the input data be of a fixed length, and a set of vectors is an easy way to bring them to this form.
One of the first embedding methods is word2vec. We adapted this method for our task, we use goods as words, and user sessions as sentences. If you understand everything, feel free to browse to the results.
Next, I will talk about the architecture of the model and how it works. Since we are dealing with goods, you need to learn how to build such descriptions of them, which, on the one hand, contain enough information, and on the other, are understandable for the machine learning algorithm.

On the site, each product has a card. It consists of the name, text description, characteristics and photos. We also have data on the interaction of users with the product: views, adding to the cart or favorites are stored in logs.
There are two fundamentally different ways to build a vector description of the goods:
- use content - convolutional neural networks for extracting features from photos, recurrent networks or a bag of words for analyzing textual descriptions;
- use of data on user interactions with the product: what products and how often they look / add to the basket with the data.
We will focus on the second method.
Data for Prod2Vec model
First, let's figure out what data we use. We have at our disposal all user clicks on the site, they can be divided into user sessions - click sequences with intervals of not more than 30 minutes between adjacent clicks. To train the model, we use data from about 100 million user sessions, in each of which we are only interested in viewing and adding products to the basket.
Example of a real user session:
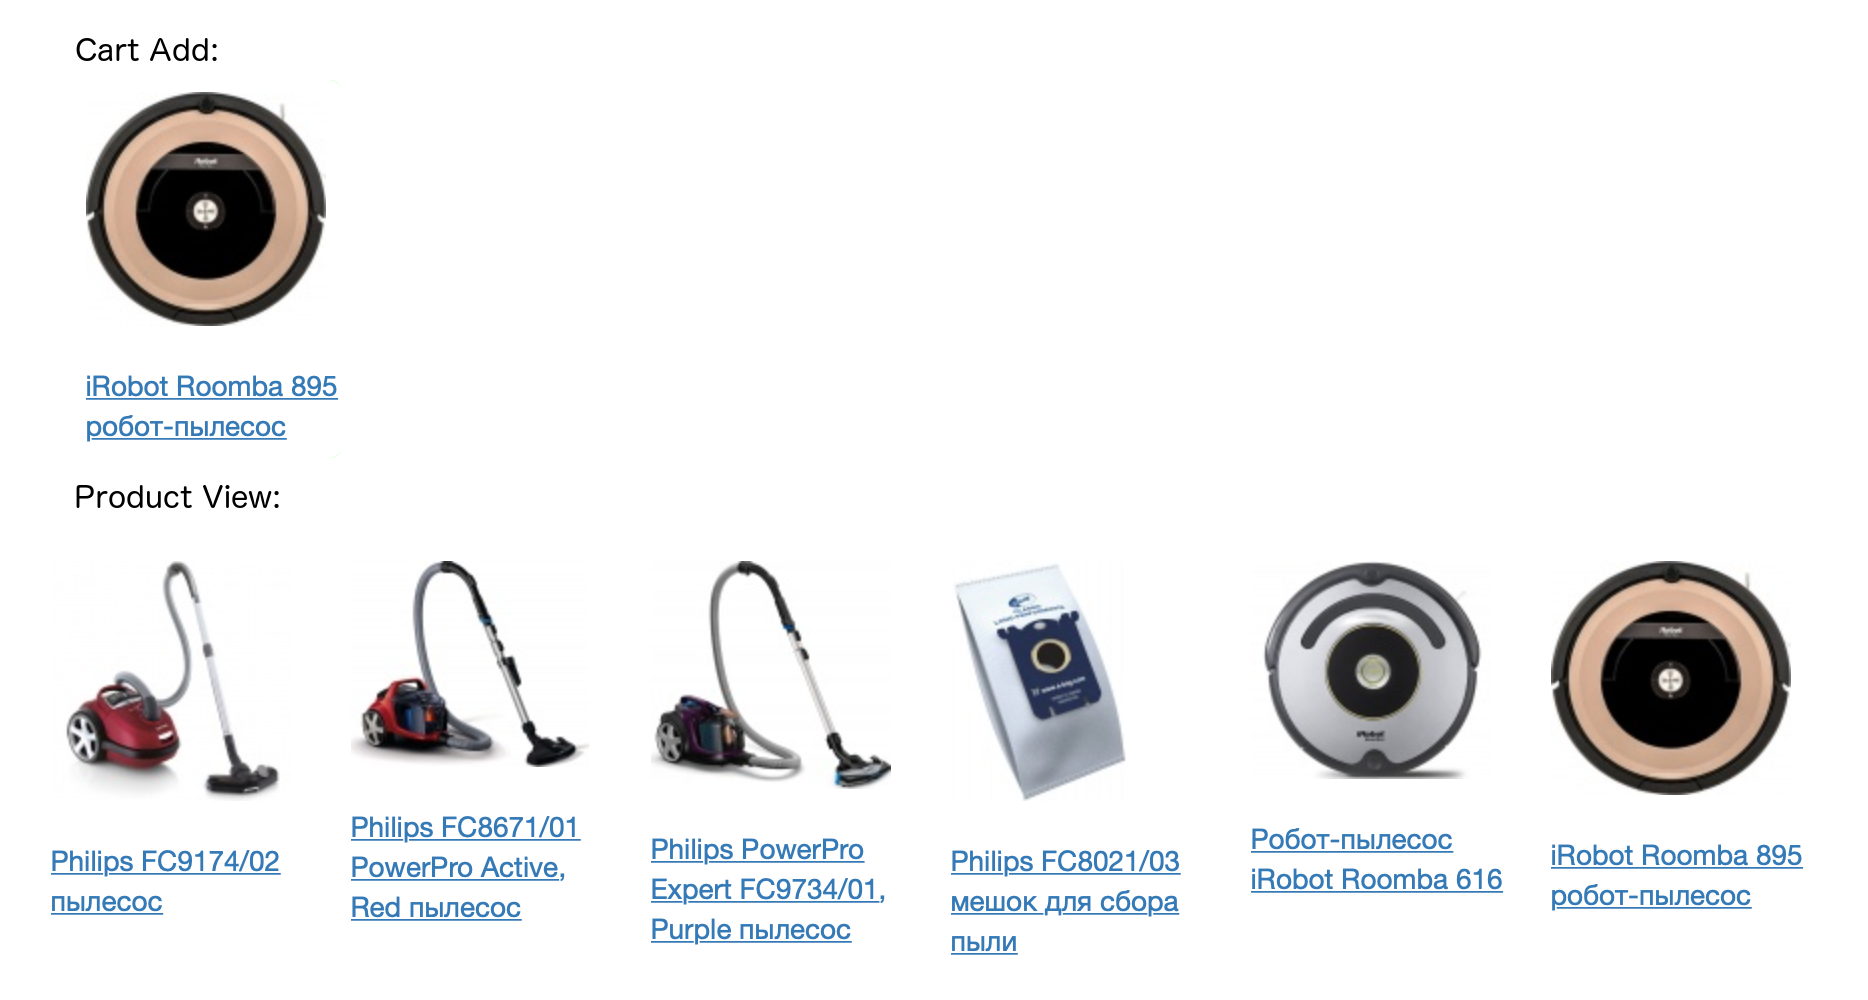
Each product in the session corresponds to its context - all products that the user has added to the basket in this session, as well as products that are viewed with it. The prod2vec model is built on the basis of the assumption that similar products often have similar contexts.
For example:
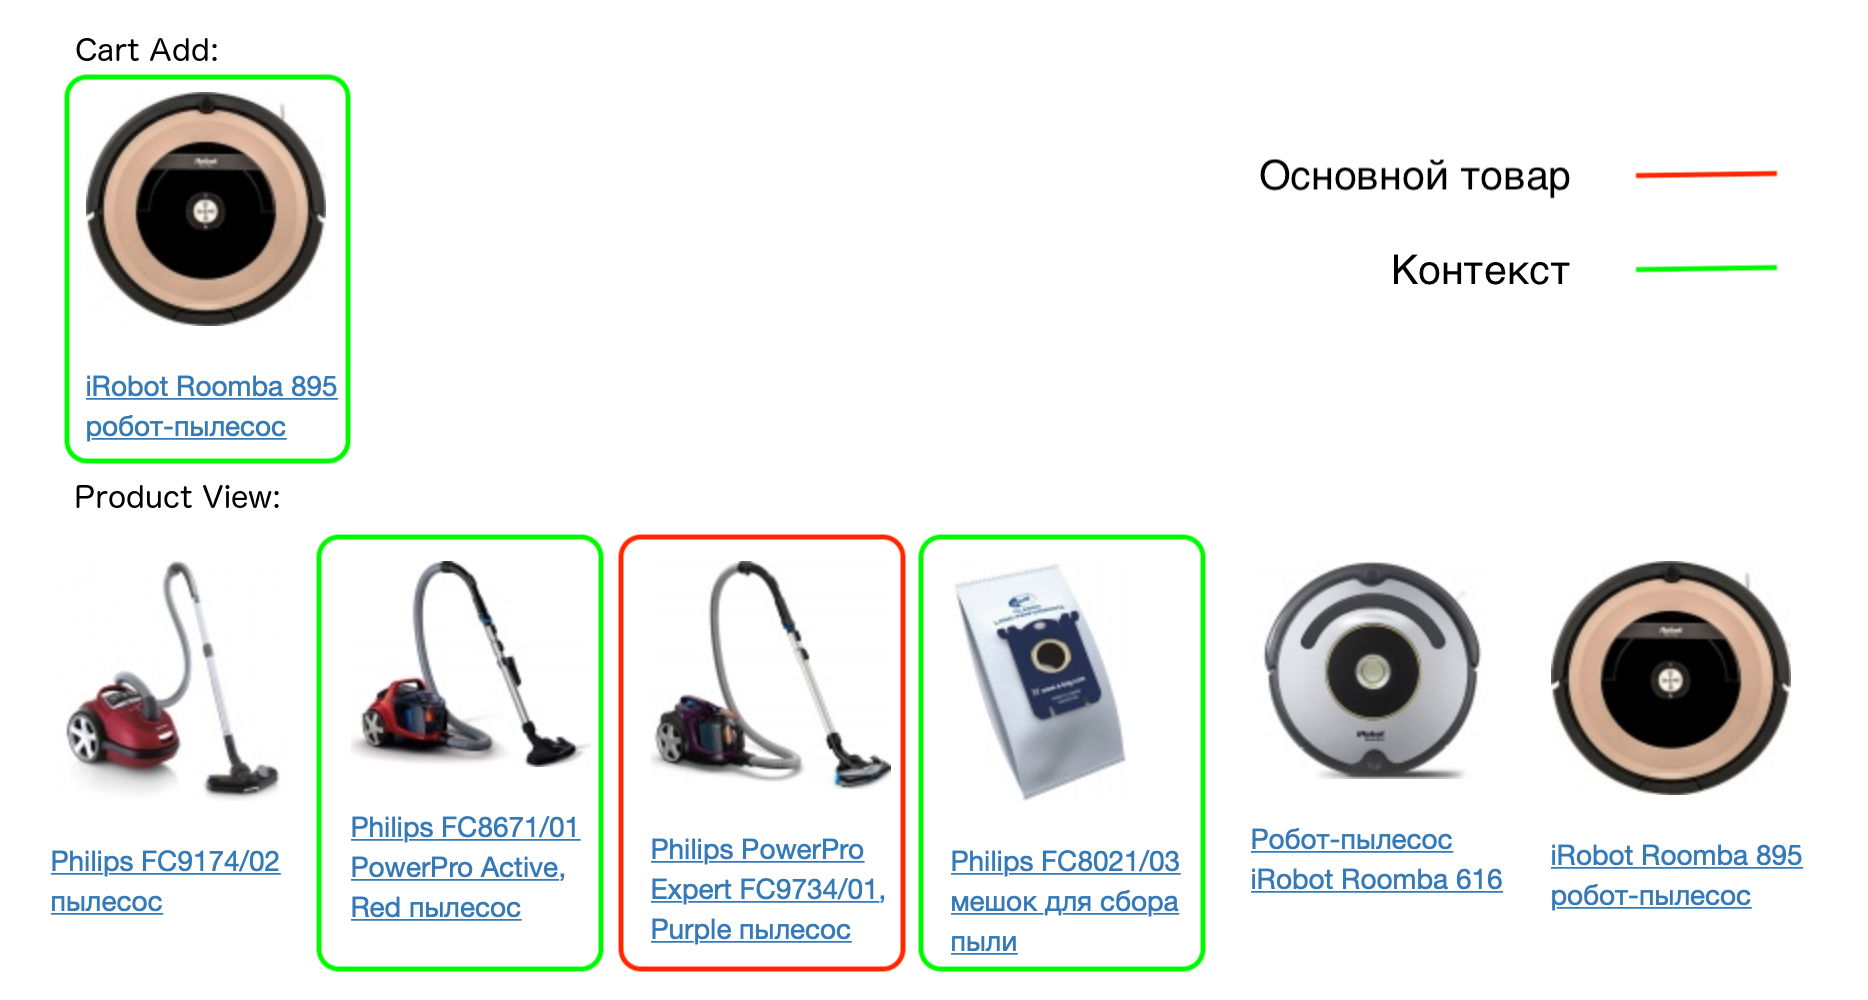
Thus, if the assumption is true, then, for example, cases for the same phone model will have similar contexts (the same phone). We will test this hypothesis by building product vectors.
Prod2Vec model
When we introduced the concept of the product and its context, we describe the model itself. This is a neural network with two fully connected layers. The number of inputs of the first layer is equal to the number of products for which we want to build vectors. Each item at the entrance will be encoded with a vector of zeros with a single unit - the place of this product in the dictionary.
The number of neurons at the output of the first layer is equal to the dimension of the vectors that we want to end up with, for example, 64. At the output of the last layer, there is again a number of neurons equal to the number of goods.

We will train the model to predict the context, knowing the product. This architecture is called Skip-gram (its alternative is CBOW, where we predict the product from its context). During the training, the goods are given at the entrance, the goods are expected at the exit from its context (a vector of zeros with a unit in the appropriate place).
In essence, this is a multi-class classification, and cross entropy loss can be used to train the model. For one pair of the word - the word from the context, it is written as follows:
Where - network prediction for a product from the context, - the total number of goods - network prediction for goods .
After learning the model, we can discard the second layer - it is not needed to get vectors. The matrix of weights of the first layer (the size of the number of products x 64) while this is a dictionary of vectors of goods. Each product corresponds to one row of a matrix of length 64 — this is the vector corresponding to the product, which can be used in other algorithms.
But this procedure does not work for a large number of goods. And we have them, we recall, half a million.
Why Prod2Vec does not work
- The loss function contains many exponential take operations — this is long and unstable computationally.
- As a result, gradients are considered for all weights of the network - and there may be tens of millions of them.
To solve these problems, the negative sampling method is suitable, using which we teach the network not only to predict the context for a product, but also teach not to predict products that are not exactly in the context. To do this, we need to generate negative examples - for each product to select those that do not need to be predicted for it. And here the presence of a huge amount of goods helps us. When choosing a random pair for a product, we have a very small probability that it will be a product out of context.
As a result, for each product in the context, we randomly generate 5-10 products that are not in the context. At the same time, goods are not sampled by a uniform distribution, but in proportion to their frequency of occurrence.
The loss function is now similar to the one used in binary classification. For one pair of the word - the word from the context, it looks like this:
In this notation denotes the column of the weights matrix of the second layer, corresponding to the product from the context, - the same for a randomly selected item, - row of the matrix of weights of the first layer, corresponding to the main product (this is the vector that we build for it). Function .
The difference from the previous version is that we do not need to update all network weights at each iteration, we need to update only those that correspond to a small number of products (the first product is the one for which we predict, the others are either the product from its context or randomly selected ). At the same time, we got rid of a huge number of exhibitors taking at each iteration.
Another technique that in turn improves the quality of the model obtained is subsampling. In this case, we intentionally take less frequent items for training in order to get the best result for rare items.
results
Similar products
So, we learned to get vectors for products, now we need to check the adequacy and applicability of our model.
The following picture shows the product and its closest neighbors for the cosine proximity.
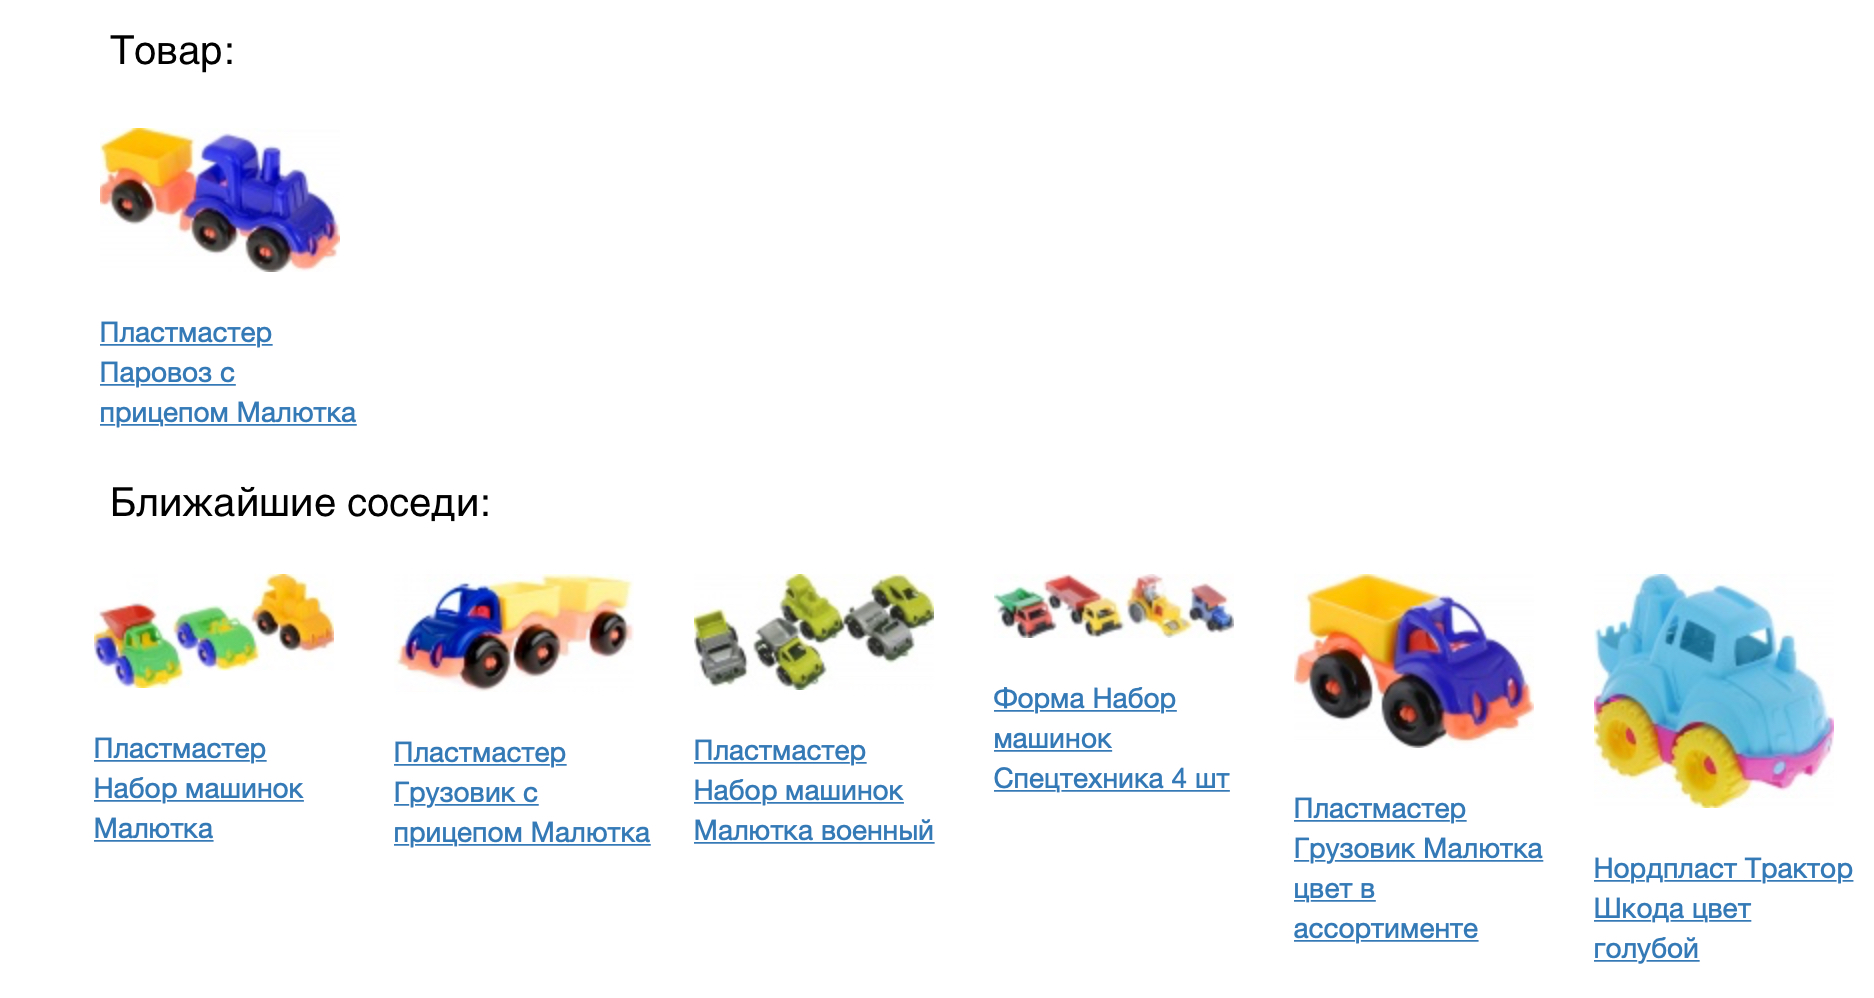
The result looks good, but you need to check out numerically how good our model is. To do this, we applied it to the task of product recommendations. For each product, we recommended coming in the constructed vector space. We compared the prod2vec model with a much simpler, based on the statistics of joint views and additions to the basket. For each product in the session was taken a list of 7 recommendations to it. Combining all the recommended products in the session was compared with what the person actually added to the basket. Using prod2vec, in more than 40% of the sessions we recommended at least one product, which was later added to the cart. For comparison, a simpler algorithm shows a quality of 34%.
The resulting vector description allows not only to search for the goods coming (which can be done by a simpler model, albeit with worse quality). We can consider what interesting side effects can be shown using our model.
Vector arithmetic
To illustrate that vectors carry real meaning about goods, we can try to apply vector arithmetic to them. As in the textbook example about word2vec (king - man + woman = queen), we can, for example, wonder what product is at about the same distance from the printer as the dust collector is from the vacuum cleaner. Common sense suggests that it should be some kind of consumables, namely the cartridge. Our model is able to catch such patterns:

')
Product space visualization
To better understand the results, we can visualize the vector space of products on a plane, reducing the dimension to two (in this example, we used t-SNE).
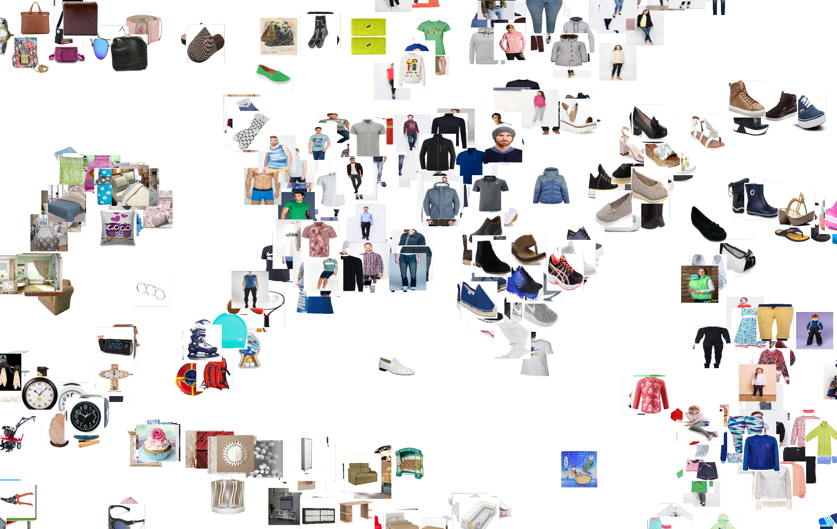
It can be clearly seen that related products form clusters. For example, clusters with textiles for the bedroom, men's and women's clothing, and shoes are clearly visible. Once again, we note that this model is based only on the history of user interaction with products; we did not use the similarity of images or text descriptions when teaching.
From the illustration of the space you can also see how with the help of the model you can select accessories for the goods. To do this, you need to take goods from the nearest cluster, for example, to recommend sporting goods for T-shirts, and hats for warm sweaters.
Plans
Now we are introducing the prod2vec model in production to calculate product recommendations. Also, the resulting vectors can be used as signs for other machine learning algorithms that our team deals with (prediction of demand for products, ranking in search and catalogs, personal recommendations).
In the future, we plan to implement the obtained embeddings on the site in real-time. For all viewed products in the session will be closest, which will instantly be reflected in the personalized issue. We also plan to integrate image analysis and similarities in the vector description into our model, which will greatly improve the quality of the vectors obtained.
If you know how to do it better (or redo it), come to visit (and even better work).
References:
- Mikolov, Tomas, et al. "Distributed representations of words and phrases and their compositionality." Advances in neural information processing systems. 2013
- Grbovic, Mihajlo, et al. "E-commerce in your inbox: Product recommendations at scale." Proceedings of the 21st ACM SIGKDD International Conference on Knowledge Discovery and Data Mining. ACM, 2015.
- Grbovic, Mihajlo, and Haibin Cheng. "Real-time Personalization using Embeddings for the Search Ranking at Airbnb." Proceedings of the 24th ACM SIGKDD International Conference on Knowledge Discovery & Data Mining. ACM, 2018.
Source: https://habr.com/ru/post/432760/
All Articles