Kubernetes tips & tricks: on node allocation and web application loads

In continuation of our articles with practical instructions on how to make life easier in daily work with Kubernetes, we tell about two stories from the world of operation: the allocation of individual nodes for specific tasks and configurations of php-fpm (or another application server) under heavy loads. As before, the solutions described here do not claim to be ideal, but are offered as a starting point for your specific cases and a ground for reflection. Questions and improvements in the comments are welcome!
1. Selection of individual nodes for specific tasks
We are raising the Kubernetes cluster on virtual servers, clouds or bare metal servers. If you install all system software and client applications on the same nodes, it is likely to get problems:
')
- the client application suddenly starts to "leak" from memory, although its limits are greatly overestimated;
- complex one-time requests to loghouse, Prometheus or Ingress * result in an OOM, resulting in a client application that suffers;
- a memory leak due to a bug in the system software kills the client application, although the components may not be logically connected to each other.
* Among other things, it was relevant for the old versions of Ingress, when due to the large number of websocket connections and constant reloads of nginx, “hung up nginx processes” appeared, which numbered in thousands and consumed a huge amount of resources.
The real case is with the installation of Prometheus with a huge number of metrics, in which when viewing "heavy" dashboard, where a large number of application containers are presented, each of which draws graphics, memory consumption quickly grew to ~ 15 GB. As a result, OOM killer could “come” on the host system and start killing other services, which in turn led to “incomprehensible behavior of applications in the cluster”. And because of the high CPU load by the client application, it is easy to get an unstable processing time for Ingress requests ...
The solution was quickly asked for by itself: you need to allocate individual machines for different tasks. We have identified 3 main types of groups by task:
- Fronts , where we put only Ingress'y, to be sure that no other services can affect the processing time of requests;
- System nodes , on which we deploy VPNs , loghouse , Prometheus , Dashboard, CoreDNS, etc .;
- Nodes for applications - in fact, where the client applications roll out. They can also be allocated to environments or functionality: dev, prod, perf, ...
Decision
How do we implement it? Very simple: two native mechanisms Kubernetes. The first is nodeSelector to select the desired node where the application should go, which is based on the labels installed on each node.
Let's say we have a
kube-system-1 node. We add an additional label to it: $ kubectl label node kube-system-1 node-role/monitoring= ... and in
Deployment , which should roll out to this node, we write: nodeSelector: node-role/monitoring: "" The second mechanism is taints and tolerations . With it, we explicitly indicate that only containers with tolerance to this taint can be launched on these machines.
For example, there is a
kube-frontend-1 machine, into which we will roll out only Ingress. Add taint to this node: $ kubectl taint node kube-frontend-1 node-role/frontend="":NoExecute ... and at
Deployment we create toleration: tolerations: - effect: NoExecute key: node-role/frontend In the case of kops, under the same needs, you can create separate instance groups:
$ kops create ig --name cluster_name IG_NAME ... and you’ll get something like the following instance group config in kops:
apiVersion: kops/v1alpha2 kind: InstanceGroup metadata: creationTimestamp: 2017-12-07T09:24:49Z labels: dedicated: monitoring kops.k8s.io/cluster: k-dev.k8s name: monitoring spec: image: kope.io/k8s-1.8-debian-jessie-amd64-hvm-ebs-2018-01-14 machineType: m4.4xlarge maxSize: 2 minSize: 2 nodeLabels: dedicated: monitoring role: Node subnets: - eu-central-1c taints: - dedicated=monitoring:NoSchedule Thus, an additional label and taint will be automatically added to the nodes from this instance group.
2. Setting up php-fpm under heavy loads
There is a wide variety of servers that are used to run web applications: php-fpm, gunicorn, and the like. Their use in Kubernetes means that there are several things that you should always think about:
- It takes approximately to understand how many workers we are ready to allocate in php-fpm in each container. For example, we can allocate 10 workers to process incoming requests, allocate less resources to the pod and scale using the number of pods - this is good practice. Another example is to allocate 500 workers for each pod and have 2-3 such pods in production ... but this is a pretty bad idea.
- Liveness / readiness tests are required to check the correctness of each pod's operation and in case the pod gets stuck due to network problems or access to the database (there could be any option and reason for this). In such situations it is necessary to re-create the problem pod.
- It is important to explicitly prescribe request and limit resources for each container so that the application does not “run down” and does not start to harm all services on this server.
Solutions
Unfortunately, there is no silver bullet that helps to immediately understand how many resources (CPU, RAM) the application may need. A possible option is to watch the consumption of resources and each time select the optimal values. In order to avoid unjustified OOM kill'ov and throttling CPU, which strongly affect the service, you can offer:
- add correct liveness / readiness samples so that we can say for sure that this container is working correctly. Most likely it will be a service page that checks the availability of all infrastructure elements (necessary for the application to work in the pod) and returns a 200 OK response code;
- correctly select the number of workers who will process requests, and distribute them correctly.
For example, we have 10 pods, which consist of two containers: nginx (for uploading statics and proxying requests to the backend) and php-fpm (the backend itself, which handles dynamic pages). Php-fpm pool is configured for a static number of workers (10). Thus, per unit of time we can process 100 active requests to backends. Let each request be processed by PHP in 1 second.
What happens if in one particular pod, in which 10 requests are now actively being processed, another 1 request will arrive? PHP will not be able to process it and Ingress will send it to try again in the next pod if this is a GET request. If there was a POST request, it will return an error.
And if we take into account that during the processing of all 10 requests we will receive a check from a kubelet (liveness test), it will end with an error and Kubernetes will start to think that something is wrong with this container and will kill it. In this case, all requests that were being processed at the moment will fail (!) And at the time of the container restart it will fall out of balance, which will entail an increase in requests for all other backends.
Visually
Suppose we have 2 pods that have 10 php-fpm workers configured. Here is a graph that displays information during an “idle” time, i.e. when the only person requesting php-fpm is the php-fpm exporter (we have one active worker per each):
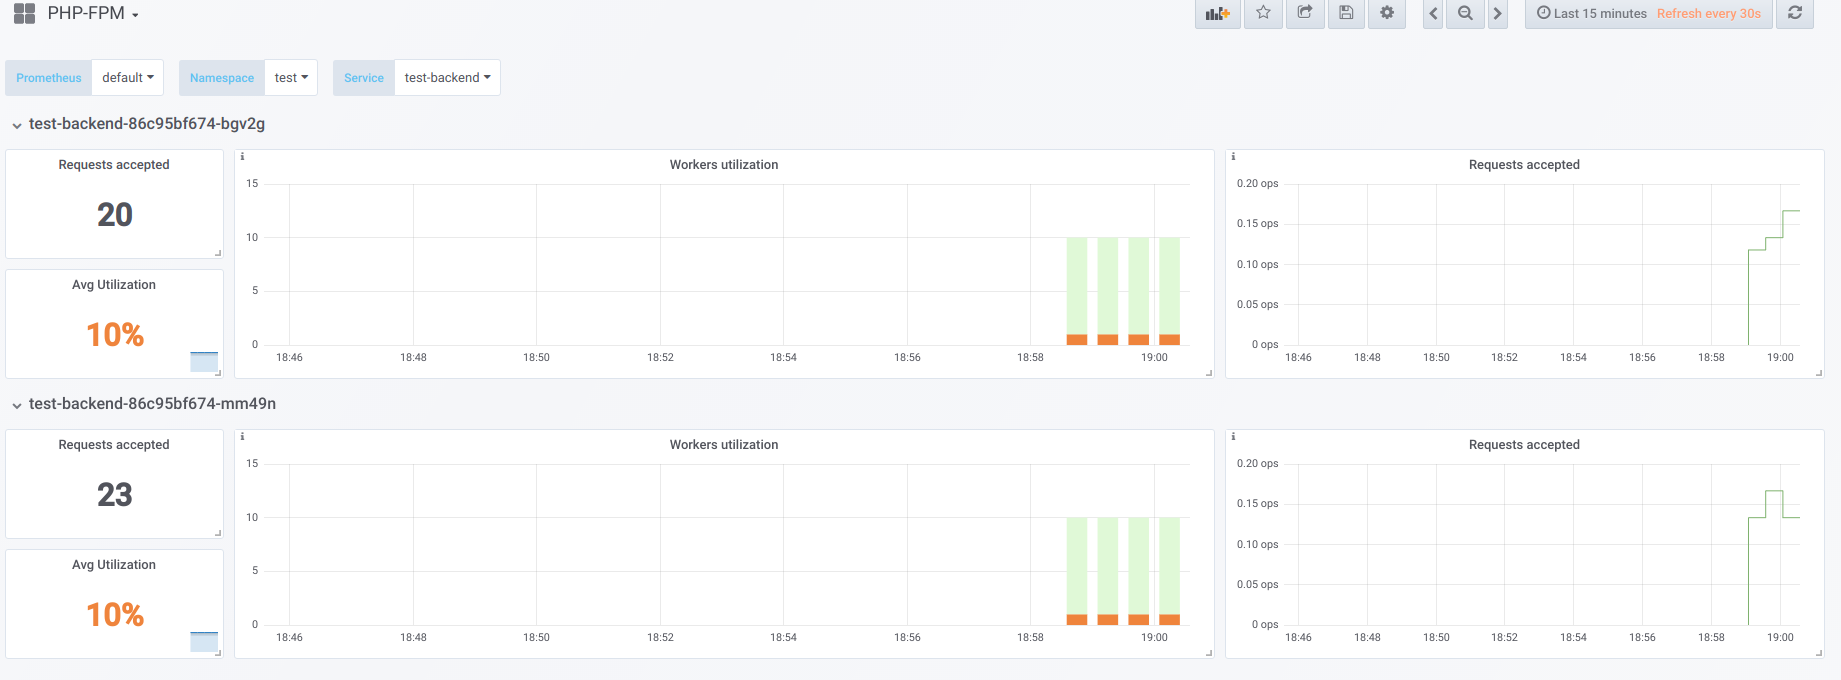
Now run the boot with concurrency 19:
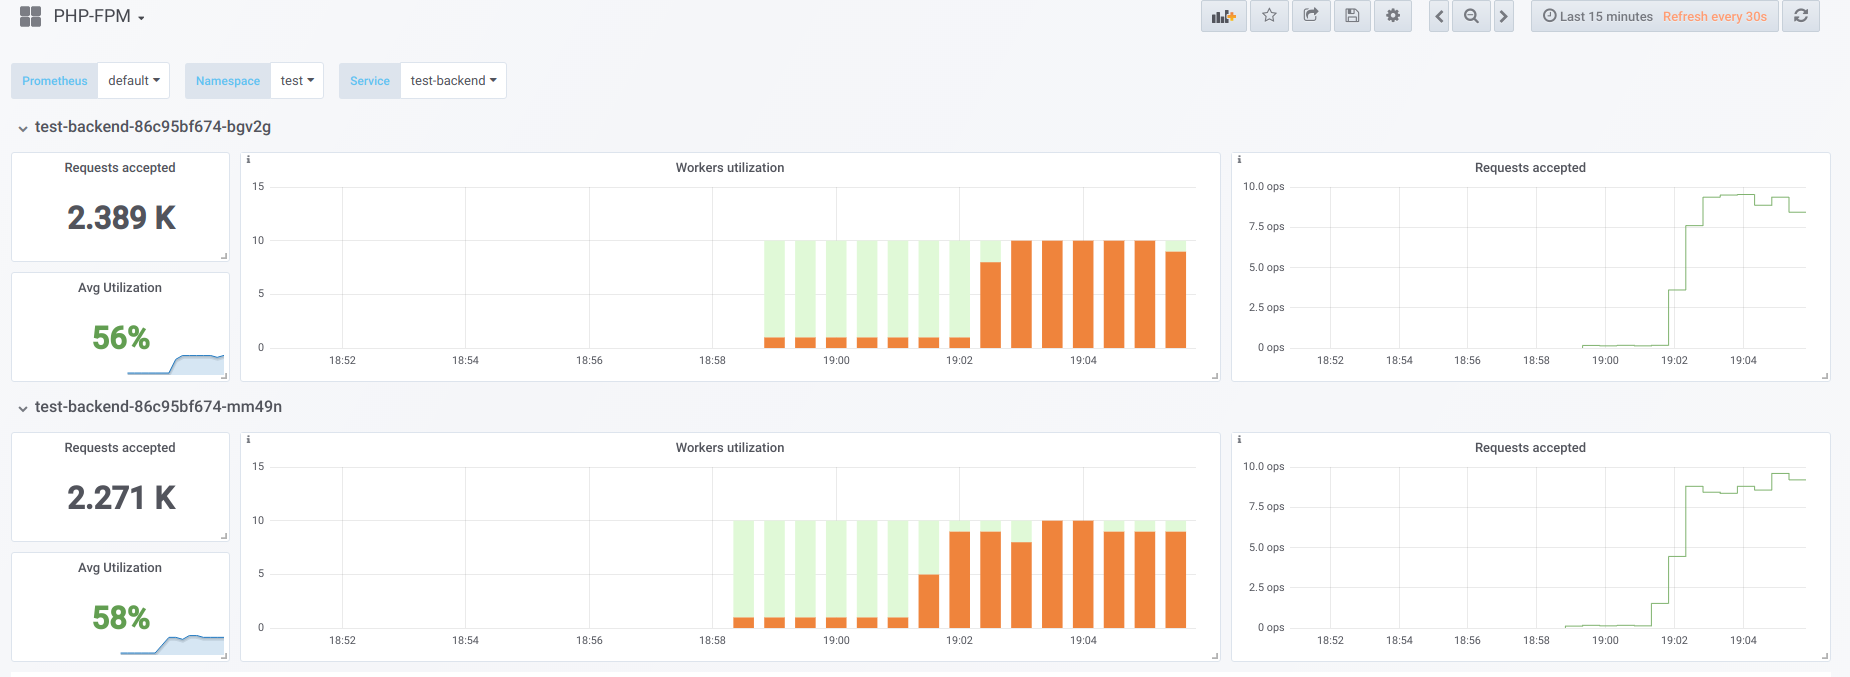
Now let's try to make concurrency higher than we can handle (20) ... let's say 23. Then all php-fpm workers are busy processing client requests:

Workers cease to be enough to handle liveness tests, so we see the following picture in Kubernetes dashboard (or
describe pod ):
Now, when one of the pods reboots, an avalanche effect happens : requests begin to fall on the second pod, which is also unable to process them, which is why we get a large number of errors from customers. After the pools of all containers overflow, raising the service is problematic - this is possible only by a sharp increase in the number of pods or workers.
First option
In the container with PHP, you can configure 2 fpm pools: one for processing client requests, and the other for checking the survivability of the container. Then on the nginx container you will need to make a similar configuration:
upstream backend { server 127.0.0.1:9000 max_fails=0; } upstream backend-status { server 127.0.0.1:9001 max_fails=0; } All that remains is to send a liveness test to upstream processing called
backend-status .Now that the liveness test is handled separately, errors will still occur for some clients, but at least there are no problems associated with restarting the pod and breaking the connections of the other clients. Thus, we will greatly reduce the number of errors, even if our backends do not cope with the current load.
This option is certainly better than nothing, but it’s also bad that something can happen to the main pool, which we don’t find out with liveness tests.
Second option
You can also use the not very popular module for nginx called nginx-limit-upstream . Then in PHP we will specify 11 workers, and in the container with nginx we will make a similar config:
limit_upstream_zone limit 32m; upstream backend { server 127.0.0.1:9000 max_fails=0; limit_upstream_conn limit=10 zone=limit backlog=10 timeout=5s; } upstream backend-status { server 127.0.0.1:9000 max_fails=0; } At the frontend level, nginx will limit the number of requests that will be sent to the backend (10). An interesting point is that a special deferred buffer is created (backlog): if the client receives the 11th request for nginx, and nginx sees that the php-fpm pool is busy, this request is placed in the backlog for 5 seconds. If during this time php-fpm is not released, then only then Ingress will enter the case, which will retry the request to another pod. This smoothes the picture, since we will always have 1 free PHP worker to handle the liveness sample - the avalanche effect can be avoided.
Other thoughts
For more versatile and beautiful solutions to this problem, it is worth looking in the direction of Envoy and its analogues.
In general, in order for Prometheus to have a clear employment of workers, which in turn will help to quickly find the problem (and notify about it), I highly recommend getting ready-made exporters to convert data from the software to the Prometheus format.
PS
Other K8s series tips & tricks:
Read also in our blog:
- " How to ensure high availability in Kubernetes ";
- “ Monitoring and Kubernetes ” (review and video of the report) ;
- " Our experience with Kubernetes in small projects " (video of the report, which includes an introduction to the technical device Kubernetes) .
Source: https://habr.com/ru/post/432748/
All Articles