"CMS" based on Google Spreadsheets for static sites
Increasingly, for a story about an event / product / service, companies are creating websites based on any constructors. Either on their own, or attracting designers and without the participation of the programmer. Modern designers allow you to build a cool, bright, effective site, but static. Any changes you need to make "pens in the editor" and republish the page. But what to do if the data changes very often or you want to add a little automation - this is where Google Tables and Charts Query Language can help (and the programmer is familiar).
A few years ago, I was approached by a friend who needed to add a price list on the site gathered at Tilda. And everything would be fine, there is a “table” block - fill in the data and publish, but there were two conditions:
- prices depended on the dollar and changed almost every day
- needed a general price and its parts on the pages of product groups
Accordingly, a lot of routine and high probability of discrepancies. It was necessary to automate.
')
And help came from Google Speadsheets. I think it makes no sense to describe the advantages: the usual editor, collaboration, formulas. All you need is to change the exchange rate once a day. There was only a question how to get data from the table on the site. And then the Google Charts API came in handy.
It allows using ajax request to get data in the form of jsonp.
The request must be sent to docs.google.com/a/google.com/spreadsheets/d/xxxxxx/gviz/tq?tq=yyyyyyy
Where:
xxxxxx - identifier from a public link to google table
yyyyyy - SQL query to retrieve data from the converted table (remember to convert all characters to HTML entities of the type: select% 20A% 2C% 20sum (B)% 20group% 20by% 20A).
One more note, SQL is quite familiar except trimmed (see the documentation ), but the FROM block is completely cut out of it. So you need to write something like “select A, B where C = 'f' and B <30 order by B”
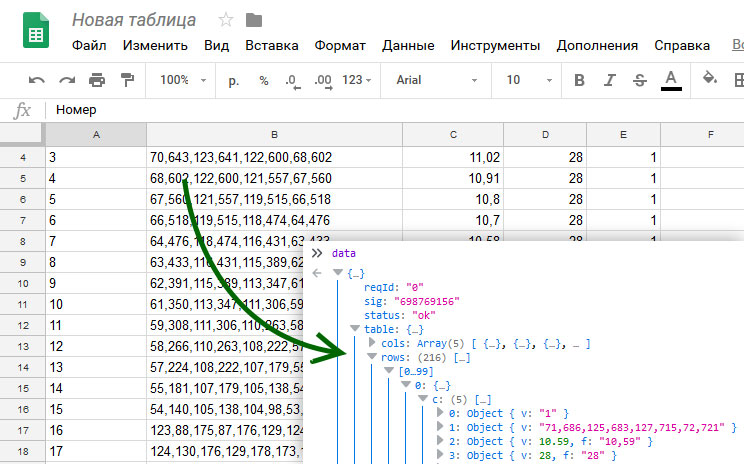
The script received in response will call the google.visualization.Query.setResponse (data) method.
The data object contains the following useful data:
{ status: "ok", // table: { cols: [ // 0: { id: "A", label: " ", type: "string" }, 1: { id: "B", label: " B", type: "number" }, ... ], rows: [ // 0: { c: [ // 0: { v: "" // } 1: { v: 3.1415, // "" f: "3,1415" // } ] } ] } } Well, then do what you want with the data: at least insert it into the table, at least generate svg (used to generate a map on the scheme of a country village noting free and sold), at least replace the placeholders in the text - the flight of fantasy is limitless.
Naturally, this method is not suitable for highly loaded systems, Google has a limit on the number of requests per day, but so far none of the automated sites have been able to figure it out.
And a little tip lastly. The table to which the requests are made should be shared by reference. And if you suddenly need fields hidden from common eyes, then for this there is a convenient feature in Google Tables. It is called IMPORTRANGE (key., Range) . The key is a link to any table to which you have access, and the range is a group of cells that need to be shown. Those. you make a closed table with a complete set of data and a public table into which you import only the necessary data ranges (you are still going to show them on the site).
Source: https://habr.com/ru/post/432740/
All Articles