Xcode and advanced debugging in LLDB: Part 1
Good afternoon, today I invite you to familiarize yourself with the translation of an article on debugging iOS applications using LLDB.
One of the most intriguing parts of the WWDC 2018 presentation, Xcode and advanced debugging in LLDB, was represented by Apple engineers. They gave some useful tips on how to use breakpoints in Xcode and low-level debugger (LLDB) to optimize the process of debugging bugs, where the developer does not catch them.
The article consists of three parts, we will go through the main theses that were said at WWDC. I created a demo project specifically to carefully understand how to use different types of breakpoints with LLDB to catch and debug bugs in your application.
Demo project
')
I created a project of sample tasks with which every iOS developer met one way or another. It is very important to understand how it works, before going into reading the article. Here are the main features of the demo project:
You can download the demo project from here if you prefer Objective-C.
If you prefer Swift, then from here .
Launch Xcode and go!
Bugs to fix!
So, you are familiar with the project and probably noticed the following errors:
An important rule: until the end of this article, you do not stop the compiler and do not restart the application after the very first run. You correct errors during program execution.
Command instructions
Let's get down to the first bug.
1. When dragging down the table, posts are not updated.
How to reproduce the error:
The standard approach for correcting such errors involves researching what happens inside the method selector responsible for the UIRefreshControl of our table. Go to the PostsTableViewController section of the pragma mark Refresh control support . From the setupRefreshControl function, we can conclude that the selector responsible for updating posts is the reloadNewPosts function. Let's add a breakpoint to the first line of this function and find out what exactly is going on here. Now scroll up to the top of the table and drag the screen to refresh.
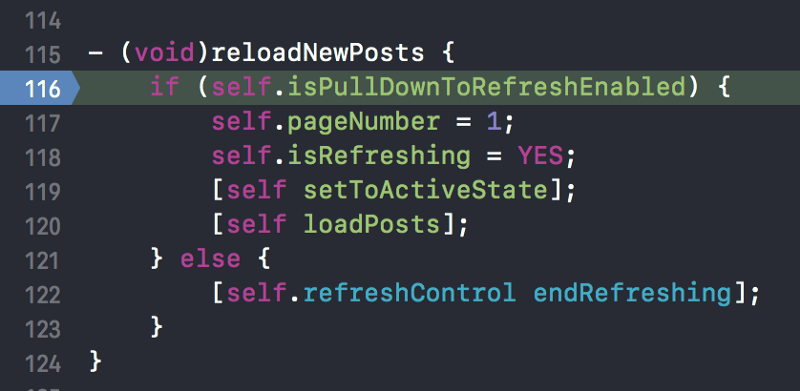
Objective c
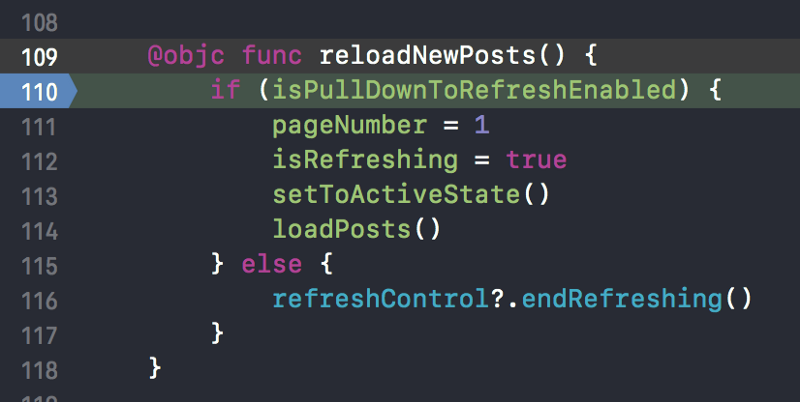
Swift
The debugger stopped at the breakpoint that you installed. For further study, click on the "block skip" button of the debugger.
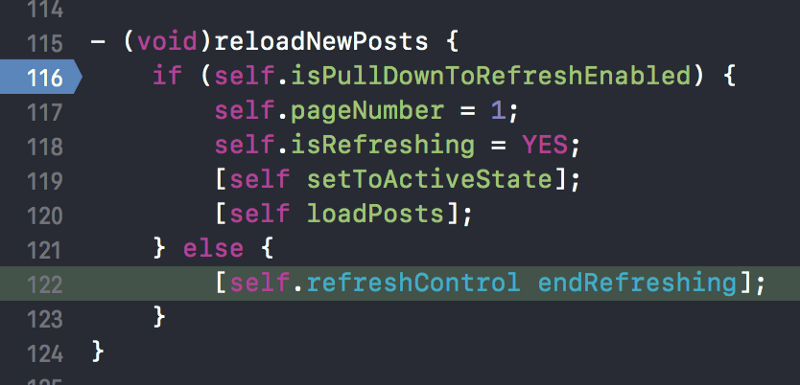
Objective c
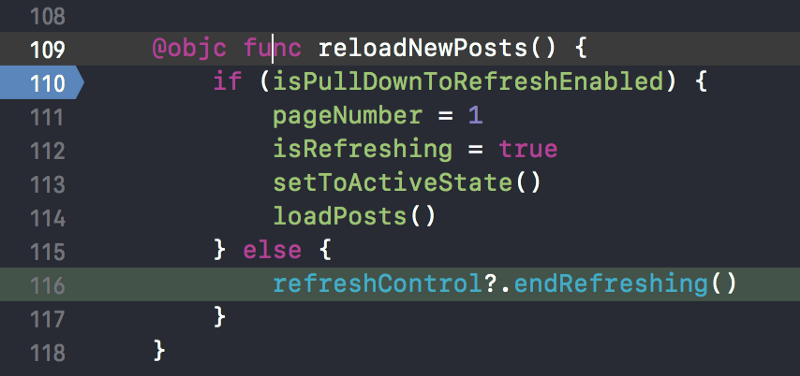
Swift
Now we have an understanding of what is going wrong!
The “if” condition is not executed (that is, the Boolean variable isPullDownToRefreshEnabled is set to NO) and, as a result, the code for updating posts is skipped.
The standard approach involves stopping the compiler, then you need to set isPullDownToRefreshEnabled as YES / true and this would solve the problem. But it would be much more convenient to first test our hypothesis before making any changes in the code and without having to stop the compiler. This is where the debugger instructions are very useful.
Double click on the set breakpoint or right-click on “Edit Breakpoint” and click on the “Add Action” button. Also select the type of action (Action) “Debugger Command”.

Now we need to set the isPullDownToRefreshEnabled property to YES / true. Add the following command to the debugger.
Objective c
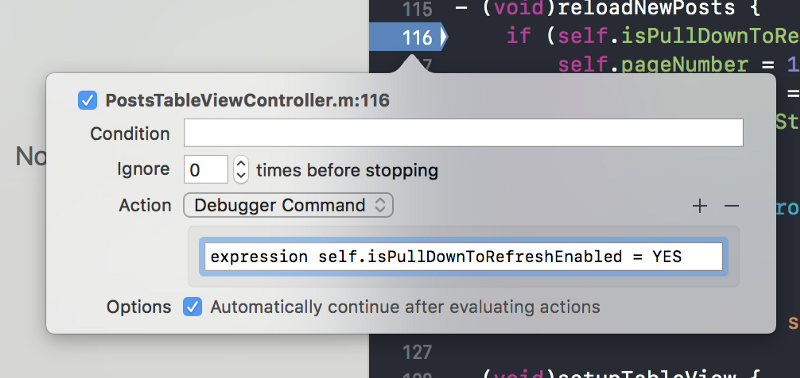
Swift
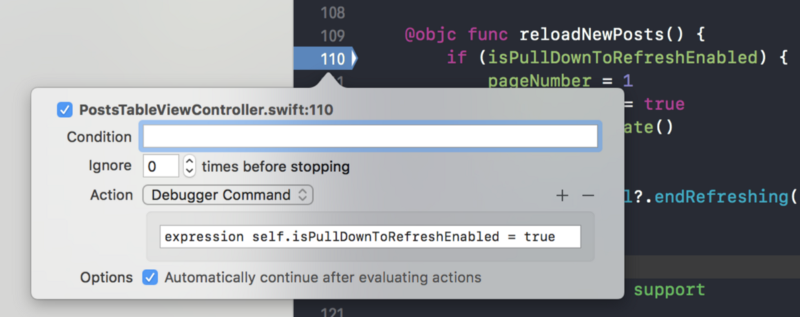
Next, check that the “Automatically continue after evaluating actions” checkbox is selected. He is responsible for ensuring that the debugger does not stop at breakpoint each time and automatically continues working with the command just added. Now scroll up to the top of the table and pull down to refresh.
Voila, the new posts were loaded and replaced the old ones and, accordingly, the post counter was updated.
We solved the first problem, get out your anti-bug weapon, we proceed to the second.
2. The user does not receive any notification (using the alert controller) that the HTTP request was not executed due to connection problems.
How to reproduce the error:
Go to the PostsTableViewController in the pragma mark Networking section. It has exactly one loadPosts function. It uses a shared network manager instance to execute a GET HTTP request, which returns an array of posts via a “success” completion handler or NSError via a “failure” completion handler.
We need to add code to the “unsuccessful” closure in order to output the alert controller. If you go to the pragma mark Support section, you will see that the presentNetworkFailureAlertController function already exists there, which is responsible for displaying the required alert controller. All we need is to call this function inside the “unsuccessful” closure in loadPosts .
The traditional way is to stop the simulator and add the necessary code. Let's go the other way!
Add breakpoint inside the “failed” circuit after the line
Objective c
Swift
Double click on the set breakpoint or right-click “Edit breakpoint” and click on the “Add action” button. Also select the type of action (Action) “Debugger Command”.
Add the following command to the debugger.
Objective c
Swift
Check that the “Automatically continue after evaluating actions” checkbox is selected.
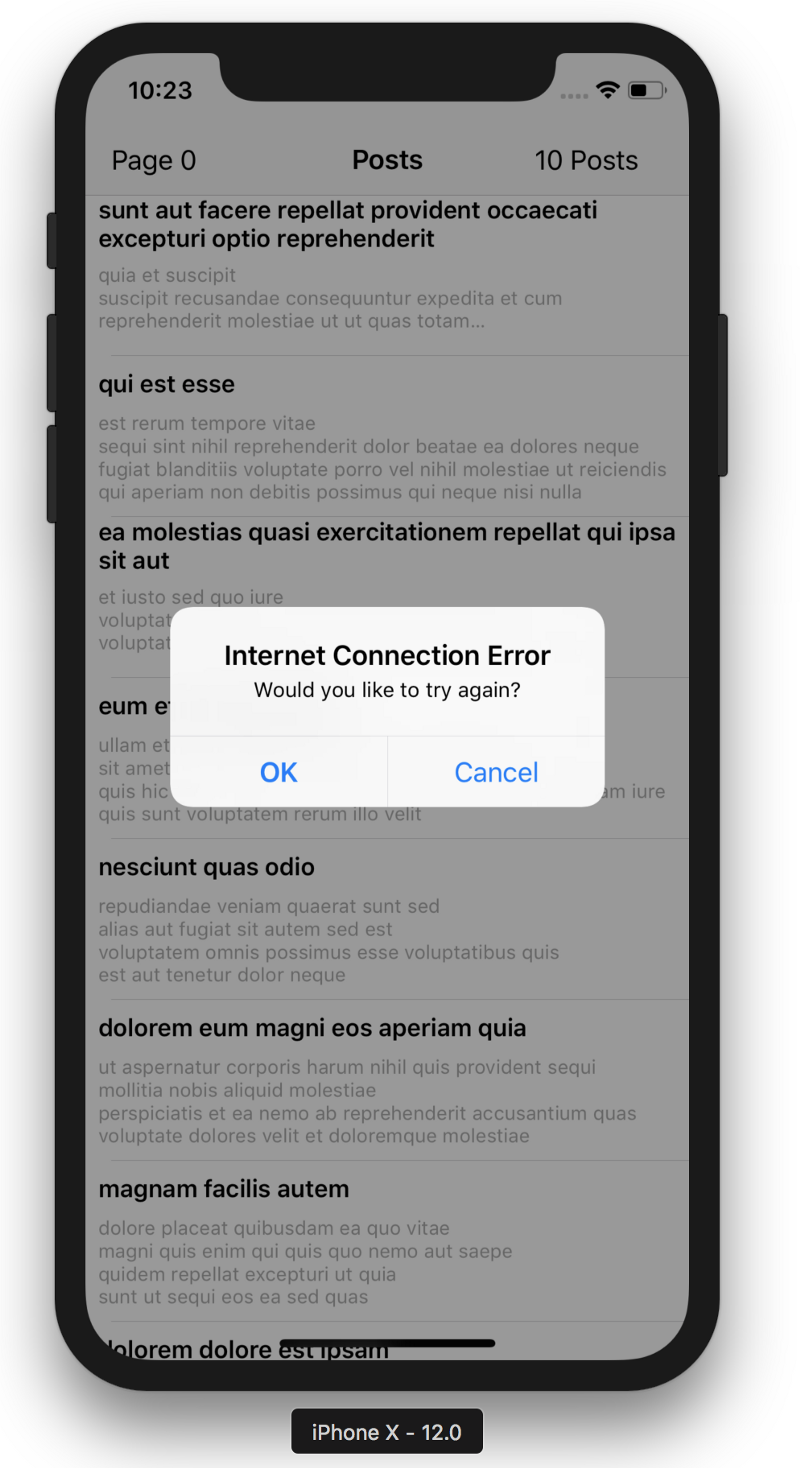
With the Internet turned off, flip up to the beginning of the table and pull down to update, or you can scroll down to the end of the table and try to upload new posts. Here is what you see:
What we have just done is called “ injecting ” the code with the help of the command added to the debugger to the specifically specified breakpoint.
Small total
Let's list again what we can do with the help of debugger commands added to breakpoint:
Both tasks were done during the execution of the program. We don’t really need to stop the compiler to fix errors and restart the application.
What next?
Further I offer you the second part of the article , where we will correct more errors and find out about another type of breakpoint - the watchpoint.
One of the most intriguing parts of the WWDC 2018 presentation, Xcode and advanced debugging in LLDB, was represented by Apple engineers. They gave some useful tips on how to use breakpoints in Xcode and low-level debugger (LLDB) to optimize the process of debugging bugs, where the developer does not catch them.
The article consists of three parts, we will go through the main theses that were said at WWDC. I created a demo project specifically to carefully understand how to use different types of breakpoints with LLDB to catch and debug bugs in your application.
Demo project
')
I created a project of sample tasks with which every iOS developer met one way or another. It is very important to understand how it works, before going into reading the article. Here are the main features of the demo project:
- When opening, we see a table view controller that loads a list of posts.
- When scrolling down the table view controller loads new posts.
- You can upload posts 7 times .
- You can refresh the list of posts by pulling down using the refresh controller (pull down to refresh).
- In the navigation bar at the top there are 2 labels (labels) that show how many posts have been loaded (right label) and how many times the user has already loaded the posts (left label).
You can download the demo project from here if you prefer Objective-C.
If you prefer Swift, then from here .
Launch Xcode and go!
Bugs to fix!
So, you are familiar with the project and probably noticed the following errors:
- When pulling the table down, the refresher does not update the posts.
- The user does not receive any notification (using the alert controller) that the HTTP request failed due to connection problems.
- You can upload posts more than 7 times.
- The left indicator (label) in the navigation bar, which is responsible for counting the number of downloads, does not work.
An important rule: until the end of this article, you do not stop the compiler and do not restart the application after the very first run. You correct errors during program execution.
Command instructions
Let's get down to the first bug.
1. When dragging down the table, posts are not updated.
How to reproduce the error:
- Run the application, the first 10 posts are already loaded.
- Scroll down to upload more posts.
- Scroll up to the top of the table and pull it down to refresh.
- New posts are not loaded and old ones do not disappear, and the post counter is not reset.
The standard approach for correcting such errors involves researching what happens inside the method selector responsible for the UIRefreshControl of our table. Go to the PostsTableViewController section of the pragma mark Refresh control support . From the setupRefreshControl function, we can conclude that the selector responsible for updating posts is the reloadNewPosts function. Let's add a breakpoint to the first line of this function and find out what exactly is going on here. Now scroll up to the top of the table and drag the screen to refresh.
Objective c
Swift
The debugger stopped at the breakpoint that you installed. For further study, click on the "block skip" button of the debugger.
Objective c
Swift
Now we have an understanding of what is going wrong!
The “if” condition is not executed (that is, the Boolean variable isPullDownToRefreshEnabled is set to NO) and, as a result, the code for updating posts is skipped.
The standard approach involves stopping the compiler, then you need to set isPullDownToRefreshEnabled as YES / true and this would solve the problem. But it would be much more convenient to first test our hypothesis before making any changes in the code and without having to stop the compiler. This is where the debugger instructions are very useful.
Double click on the set breakpoint or right-click on “Edit Breakpoint” and click on the “Add Action” button. Also select the type of action (Action) “Debugger Command”.
Now we need to set the isPullDownToRefreshEnabled property to YES / true. Add the following command to the debugger.
Objective c
expression self.isPullDownToRefreshEnabled = YES Swift
expression self.isPullDownToRefreshEnabled = true Next, check that the “Automatically continue after evaluating actions” checkbox is selected. He is responsible for ensuring that the debugger does not stop at breakpoint each time and automatically continues working with the command just added. Now scroll up to the top of the table and pull down to refresh.
Voila, the new posts were loaded and replaced the old ones and, accordingly, the post counter was updated.
We solved the first problem, get out your anti-bug weapon, we proceed to the second.
2. The user does not receive any notification (using the alert controller) that the HTTP request was not executed due to connection problems.
How to reproduce the error:
- Disconnect the Internet connection in your iPhone / simulator.
- Scroll up to the top of the table and pull down to refresh.
- New posts will not be uploaded due to an internet connection error.
- The user is not shown any error notification.
Go to the PostsTableViewController in the pragma mark Networking section. It has exactly one loadPosts function. It uses a shared network manager instance to execute a GET HTTP request, which returns an array of posts via a “success” completion handler or NSError via a “failure” completion handler.
We need to add code to the “unsuccessful” closure in order to output the alert controller. If you go to the pragma mark Support section, you will see that the presentNetworkFailureAlertController function already exists there, which is responsible for displaying the required alert controller. All we need is to call this function inside the “unsuccessful” closure in loadPosts .
The traditional way is to stop the simulator and add the necessary code. Let's go the other way!
Add breakpoint inside the “failed” circuit after the line
Objective c
[self updateUIForNetworkCallEnd]; Swift
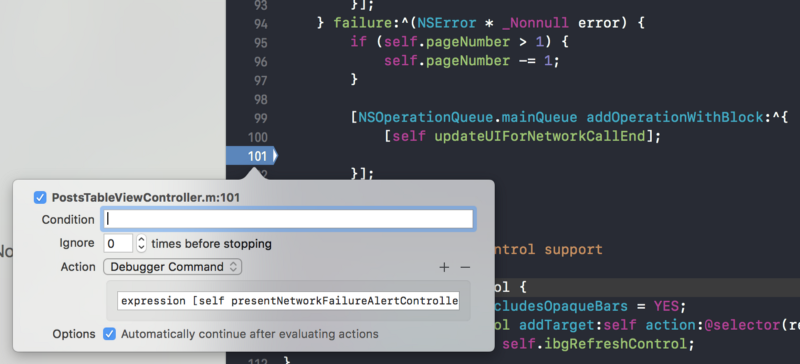
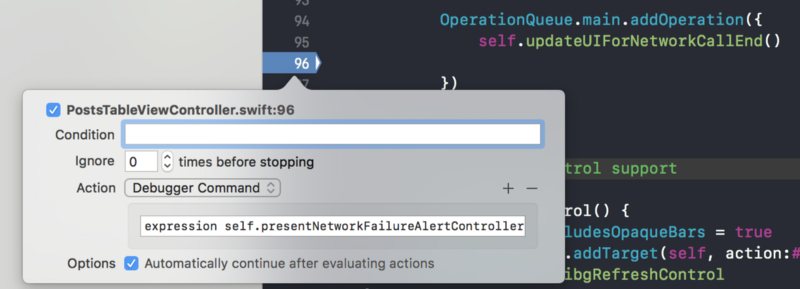
self.updateUIForNetworkCallEnd() Double click on the set breakpoint or right-click “Edit breakpoint” and click on the “Add action” button. Also select the type of action (Action) “Debugger Command”.
Add the following command to the debugger.
Objective c
expression [self presentNetworkFailureAlertController] Swift
expression self.presentNetworkFailureAlertController() Check that the “Automatically continue after evaluating actions” checkbox is selected.
With the Internet turned off, flip up to the beginning of the table and pull down to update, or you can scroll down to the end of the table and try to upload new posts. Here is what you see:
What we have just done is called “ injecting ” the code with the help of the command added to the debugger to the specifically specified breakpoint.
Small total
Let's list again what we can do with the help of debugger commands added to breakpoint:
- To operate with existing property value.
- Add a new line of code.
Both tasks were done during the execution of the program. We don’t really need to stop the compiler to fix errors and restart the application.
What next?
Further I offer you the second part of the article , where we will correct more errors and find out about another type of breakpoint - the watchpoint.
Source: https://habr.com/ru/post/431506/
All Articles