Slow software
From the translator: the problem of slow software has become one of the main topics of discussion at Habré and Hacker News in recent weeks. For example, see Nikita Prokopov ’s article “My Disappointment in Software” and 2432 comments to it.
 We spend a lot of time at the computer. We are waiting for each time you launch applications and download web pages. Everywhere icons with spinner or hourglass. The hardware is more powerful, but the software still seems slow. Why is that?
If you use a computer to do important work, then you deserve fast software. Too often, modern software does not meet these requirements. In the research lab of Ink & Switch, we studied the reasons for this situation, the software eventually became better. This article has published the results of our research.
What do users perceive as a “slow” program? All of us sometimes the software annoys delays and lags. But in order to better understand these problems, one should supplement the intuitive sensations with academic studies that strictly answer this question.
')
Perceived speed is closely related to the concept of latency. A comparison of the research of “what seems slow” with the measurement of the real delay in real applications makes it clear how bad everything is.
When discussing software performance, we often hear about bandwidth. For example, "this web server can perform 10,000 requests per second." But this is not how users perceive things. They care about how long their specific web request takes or how long it takes to open a document, or how quickly the application responds to mouse clicks. These interactions are associated with latency. Delay is a critical metric that we will explore in this article.
User Perception
Read more about the importance of latency in interactive systems here .
Other factors also affect the feel of software speed. For example, the frame rate and feedback during long tasks. But we believe that the delay is a fundamental metric, and with a very low delay, any software will feel extremely fast.
To begin, consider the human sensitivity to touch screen delays.
Researchers test this with tests that determine exactly what kind of delay users perceive. First, the subjects are offered an interface that has (say) a delay of 1 ms, and then (say) 70 ms, and is asked to perform operations like pressing a button. If an interface of 70 ms consistently shows a worse result than an interface of 1 ms, then 70 ms is called a "noticeable difference."
Minimal noticeable difference
For details on the minimum noticeable delay difference and the associated experimental installations, see, for example, this paper .
The minimum noticeable difference is the budget, after which the concrete operation will start to feel slow for the user.
For example, when dragging items on the screen, users perceive delays of only ~ 2 ms. The least noticeable delay depends on the user and the action taken, but it is always very low.
Perception of delay while dragging
A perception report of 2–16 ms when dragging with the stylus .
2−11 ms when dragging with your finger .
An average of 11 ms when dragging with your finger .
Similar results were obtained when drawing with the stylus on the tablet. Here, researchers suggested users notice a delay of 20 to 80 ms. In our own unofficial tests, a delay of about 80 ms is perceived as very noticeable, and it takes something much closer to 20 ms to make the stylus seem responsive during handwriting.
Perception delay stylus
Report on the perception of the delay 10−70 ms when writing with a stylus .
21–82 ms for various actions with the stylus .
The difference between low and high latency handwriting is obvious when comparing:
Left: iPad Pro and Notes application with a latency of about 15 ms. Right: Samsung S3 and OneNote application with a delay of about 70 ms. Video is slowed down 16 times.
Another typical operation on touch devices is clicking on buttons or links. Here, tests have determined that users notice a delay of approximately 70 ms at the turn (although for some individual users it is probably lower).
Perception of delayed tapping the screen
This study revealed an average minimum distinguishable delay of 69 ms.
Here is an example comparing two different delays:
Left: opening the settings tab on the iPhone 6s with a delay of about 90 ms. Right: switch settings on the Samsung S3 with a delay of about 330 ms. Video is slowed down 16 times.
How do modern applications meet these thresholds? If we talk about dragging with your finger, then no commercial system can consistently correspond to a delay of several milliseconds to satisfy all consumers.
Drag and Drop performance
As we will see below, even displays and equipment for data entry do not fit into the budget of 10 ms, not to mention several layers of software.
Thus, when using all current touchscreen operating systems, at least some of the users will feel that the object is lagging behind the finger while dragging.
When drawing with a stylus, a small number of systems approach an acceptably low level of latency. But most of them are much higher than these values, which is expected by users as a significant delay:
Below are the results of the Ink & Switch tests on the delay in drawing with a stylus on a tablet for various devices. Average delays, measured from contact with the screen before the beginning of the color change of the corresponding pixel, are rounded to the nearest 5 ms.
Although we have no data on delays on all devices, but we assume that they are comparable with the stylus drawing delays observed above.
Drawing delays versus pressing delays
We expect that these delays are comparable, because in both cases touch input is used, that is, the screen refresh cycle is activated. However, there are some differences, so the values are unlikely to be exactly the same.
Since here there is a delay of about 70 ms, most systems are able to respond well to depression. But it is also easy to find applications that work much worse than the theoretical capabilities of the system.
In general, sensory systems should have very low delays so that they feel responsive. Most devices and applications are not able to provide this level of performance, and, therefore, they all feel at different degrees slow for users.
There is some evidence that the increase in typing delays worsens users.
Effect of input delay
In this study, random delays were added to the keystrokes, which reduced input performance. However, it evaluated only one range of delays. In addition, the study authors suggest that experienced typesetters can adapt to increased latency.
However, we do not know about studies that specifically measure the least noticeable input delays. A touch delay on the touch screen (noticeable at about 70 ms) can be a useful guide, because it also measures the time between a discrete finger touch and a visual screen update.
Below are some informal measurements of the pass-through delay of the keyboard from the start of a keystroke to the appearance of a symbol on various machines. Sources: “Computer Delay: 1977−2017” , tests Ink & Switch.
Accurate measurements of the assessment of the effects of keyboard delays would be a great experiment for adventurous researchers. In any case, it seems likely that for many users the threshold value for a noticeable delay when entering from the keyboard is below 100 ms. Perhaps much lower.
The last type of input devices in our review. One experiment made it possible to determine that users perceive mouse delay from 34 to 137 ms with an average value of 65 ms.
Different mice have very different delay values. Some systems show values less than 10 ms by combining high-performance equipment with careful low-level programming ( an installation with a delay of about 8 ms is described here ). In addition, it is possible to go beyond 100 ms with a combination of mediocre hardware and applications that introduce additional delays, or buffers between the mouse and the display.
Application-level delays measure how long it takes to perform specific application actions, such as loading web pages. An example of such a delay is loading the NYTimes webpage, which takes about 3000 ms.
When does application activity seem fast? It is difficult to say for sure, because their actions are more complex and diverse than simple data entry. Probably, the answer also depends on user expectations (at present, people usually work with slower software). But we can calculate the approximate number.
Delay literature
See a review of the literature on the effect of latency on users of different applications. This is a good starting point for a deeper dive into the subject.
One of the reference values is a typical metric of 70 ms, as mentioned above, the least noticeable delay when the screen is pressed. If you notice a delay between clicking the link and displaying the click indicator, you should notice a similar delay between clicking and opening the web page.
Another reference value is the Google RAIL model for developers. Although the authors of this model do not substantiate their assertions, however, the model claims that the response within 100 ms “feels like an instant”, and the higher delay “[breaks] the link between action and reaction”.
You can unofficially check your own sensitivity in the terminal. Take your favorite command line programs and run them with the 'time' parameter, which measures the execution time. You will surely notice the difference between the responses in 15 ms (great!) And 500 ms (obviously slow).

As an end reference point, we take into account that the typical human response time to a visual stimulus is about 220 ms .
This value is significantly greater than the noticeable delay, because the reaction includes not only observation, but also subsequent action.
It is also necessary to take into account the conclusions of some researchers that a person is able to perceive an increase in delay at an unconscious, physiological level.
How do real applications match these landmarks? Some cope. For example, many Unix command line programs run faster than 100 ms.
But most of the Internet applications are out of range. Google search in about 1000 ms is much faster than most web applications, but it is still noticeably slower compared with the interaction of less than 100 ms on the command line. And it's easy to find examples of pages that load longer than 5000 ms even on a good mix.
In the case of mobile and desktop computers, there are some applications that consistently demonstrate a delay of less than 100 ms, such as the built-in calculator on iOS. But it is easy to find examples of applications that significantly exceed this threshold, even if they have all the data available (or should be) locally. Consider the Slack example.
The video below shows that switching between two small-sized channels in the same workspace on the iPad Pro takes about 220 ms, although there is no need for network calls, and the iPad Pro is possibly the highest-performing mobile device in the world (video is slowed down 8 times ):
It is difficult to make a general conclusion for all programs in such a wide area as delayed action. However, it seems obvious that some applications perform actions fairly quickly and seem instant to users (less than 100 ms), but many applications do not.
Thus, we have established that many programs are actually slow. Where does all this time go and what can we optimize? Consider this question, starting with the first component in the chain: input devices.
The first step in the pipeline that converts the physical input data into updates on the screen is the processing of the input data: converting a contact with a touch screen, keyboard, or mouse into a digital signal for the operating system. Here we look at how long this step takes.
Let's start with the keyboards. The table shows the measured delays from the start of a key press to a signal on a USB hub, rounded to 5 ms ( source ).
As you can see, these keyboards easily select tens of milliseconds from the budget at the very first step in the processing pipeline. This is from a total budget of 100 ms or less! Much more detail about this topic is covered in the article "Printing with pleasure . "
Mice likewise take tens of milliseconds from the budget. Although the most high-performance gaming mice have a delay of less than 10 ms. Data on the response to pressing differ, here too, individual instances show a result of less than 10 ms ( example ).
In mobile devices, it is more difficult to measure the fraction of the delay that is incurred on input devices, because they are tightly integrated with other hardware components. However, we can use some of the common patterns in input device equipment to evaluate their latency, as well as stand-alone devices.
One of the common patterns is the sampling rate. In many input devices, equipment “scans” or “samples” input at a periodic interval. For example, a typical consumer touchscreen operates at a frequency of 60 Hz, that is, it polls sensors approximately every 17 ms. This means that in the worst case, the delay of the input device will be at least 17 ms, and on average no more than 8 ms.
Other things being equal, a higher scanning frequency will reduce the input delay. For example, Apple's advanced touchscreens and styluses operate at frequencies above 60 Hz (information from the Apple documentation archive ).
A similar source of delay is USB polling. The USB protocol receives input from the keyboard, so the keyboard needs to wait for a USB poll to send information about the presses. Low-speed USB polling operates at 125 Hz, introducing the inevitable ~ 8 ms max. and ~ 4 ms of average delay. Later versions of USB scan with a frequency of 1000 Hz or more, minimizing the effect of delay.
There are many other potential sources of delay in input devices, for example, contact bounce (for more details, see the article “Scanning the Keyboard Matrix and Contact Bounce” on the software and hardware effects of bounce).
We will not consider all these nuances here, but we emphasize the main point: a) the input devices themselves can cause a considerable delay before any processing takes place in the software; b) this may be due to several discrete reasons, and the time delay is added up.
The hardware at the other end of the pipeline is displays and video cards.
One of the sources of delay here is the frame rate of the display. Since displays cannot be redrawn continuously, this leads to an inevitable delay, similar to the polling of input devices described above. If the screen is updated (say) every 20 ms, then it adds a 20 ms delay in the worst case and 10 ms on average.
Motion perception
Other factors influence our perception of objects moving on the screen. Blur Busters is a great resource on this topic. For example, see LCD Motion Artifacts 101 .
Most displays operate at 60 Hz, although professional devices and game displays operate at 120 Hz, 144 Hz and 240 Hz. Thus, only the frame rate of the display usually adds about 8 ms to the delay, although in displays with the highest frame rate it can be reduced to a few milliseconds.
Another contribution to the delay from displays is the time it takes to physically change the color of pixels after receiving new data. This time ranges from a few milliseconds in high-end gaming displays to double-digit values in less responsive LCD displays.
Display response time
This parameter is difficult to measure, but some illustrative data is available on the Notebook Check website. For example, see the example of slow and fast displays.
On modern high-end devices, the display is connected to a special graphics processor (GPU). GPUs create an array of pixels to display, for example, by composing 2D layers or rendering 3D virtual scenes. Graphic processors produce frames at a rate that depends on the GPU hardware, interaction with the application and the platform code, and sometimes from the logic of synchronization with the displays.
A related problem occurs when the application code is very slow and does not send instructions to the GPU fast enough to make full use of it. This can lead to the fact that the graphics processor will create unique frames at a lower speed than if it really had frequent instructions from the application. This is a common source of lags that we see in 2D applications that display less than 60 frames per second.
Lagi
Lags like 'jank' are difficult to describe in words, but they are easily recognizable. Nathan Gitter in the Designing Jank-Free Apps article defines them as "visual faults that are unexpected or distracting."
We discussed at least three parts of the pipeline where a delay occurs due to periodic activity: input scanning, GPU rendering cycles, and display refresh cycles. It is important to note that they can be combined in such a way that in fact all delays are added:
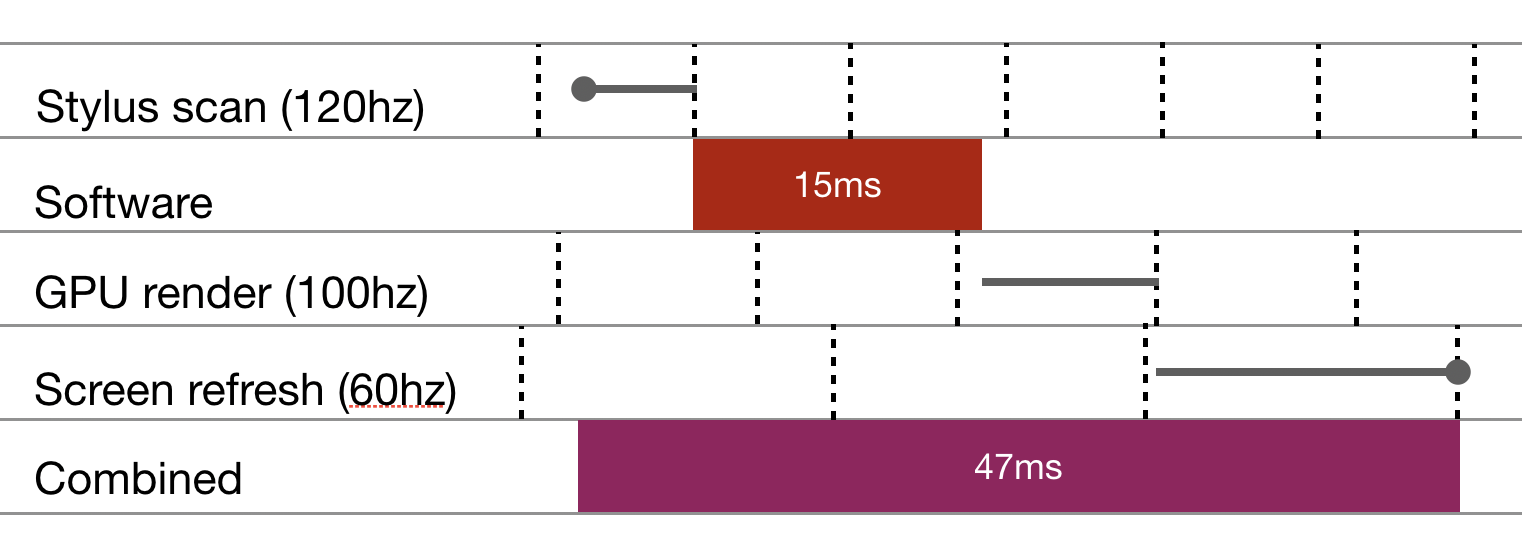
Waiting for several cycles. The hypothetical delay cascade shows how waiting for consecutive hardware cycles can accumulate latency. Dotted vertical lines indicate the cycles that the pipeline should expect.
To proceed to the next step in the pipeline, we must wait for the next cycle. And the cycles may not be aligned with each other. Inconsistent cycles and an unfavorable initial entry time can cause an additional delay of 10 milliseconds. This is a large amount compared to the latency budgets described above.
On the software side, execution time delays are inherent in operating systems and other code that is not directly related to the application. Consider two important examples: garbage collection and scheduling.
First comes the garbage collection (GC). GC is crucial in the two most widely used platforms in the world: the web (JavaScript) and Android (Java).
In some cases, garbage collection can lead to a large delay, especially regarding the requirements for low input delay. For JavaScript or Java environments, delays in garbage collection on the order of 10 ms are not surprising. But this is completely the entire budget for dragging and dropping objects on the touch screen!
Garbage collection can delay just one frame. But as is the case with lags due to frame loss, such jerks annoy users.
There are ways to reduce GC latency. They include moving as much of the GC work as possible beyond the limits of the main flow, as well as optimizing the GC operation only in small separate pauses. See, for example, the efforts of V8 to move as much garbage collection operations as possible beyond the limits of the main flow and the efforts of the Go developers to ensure that the maximum GC lags are significantly less than 1 ms.
There is another option to use a programming language that partially sacrifices the convenience of the GC, but has more predictable performance. Languages like Swift avoid arbitrary garbage collection using automatic reference counting .
Another potential source of overhead is scheduling in the operating system. Our application (and its OS dependencies) do not necessarily work all the time. Other programs can be scheduled for launch, and ours are forcibly suspended, albeit for a very short time. Each program asks for time, and the number of processor cores is limited.
A CPU load is associated with a dispatch issue. If your application meets its performance goals, but it requires almost 100% of computing resources, this may well annoy users. The battery consumption will increase, the device will heat up and, probably, will start to make noise with the fan. In other words, other things being equal, low CPU utilization is better for the user.
A typical source of delays in mobile interfaces is the design of the OS itself and applications. There are some important interactions that can be accomplished only by real expectation.
Android and iOS largely use “long press” to access the context menu. They require the user to wait hundreds of milliseconds to execute the command.
Delays are associated with this to eliminate ambiguities. For example, in mobile Safari there is a default delay of 350 ms between when the user clicks on the link and when the browser starts loading a new page. This is necessary to determine the difference between clicking on a link and double-tapping (zoom). For details on this particular delay, see here . There's also information about the latest changes that allow application developers to get around this problem.
A common source of latency for users on the Internet is malicious activities, such as activity trackers, that track user activity and download intrusive ads.
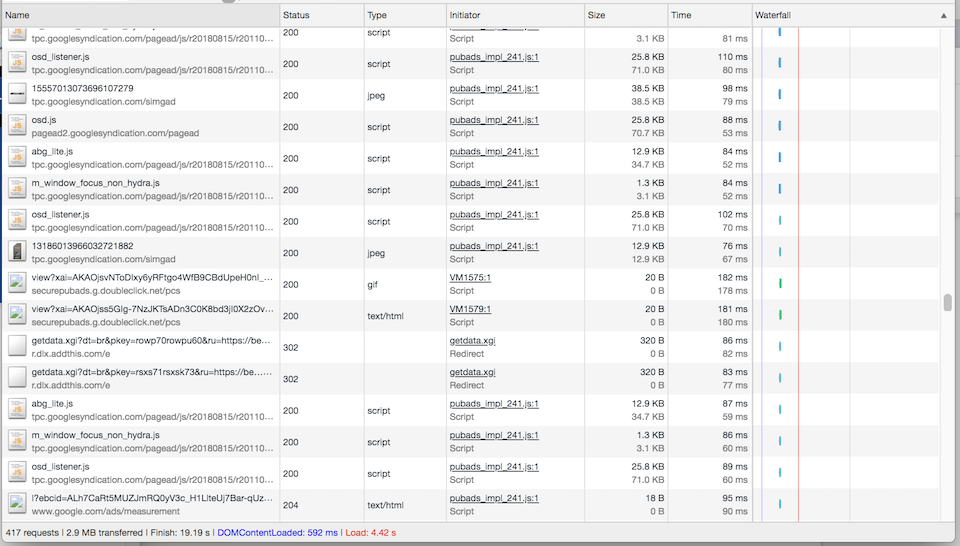
An article of 500 words on the Washington Post site requires about a hundred HTTP requests and loads approximately 4400 ms. Many requests are needed for trackers and ads. Shown a small part of them
There are many great articles about obesity on the web: see The Bullshit Web , “The Crisis of Obesity Websites” , Web bloat , etc.
We simply emphasize that the biggest source of delay on many sites is the loading of any nonsense against the desire of users.
The last source of the delay that we mention is perhaps the most obvious one: this is the application itself. If an application spends a lot of processor time processing input or performing an action, it will be slow.
Consider an example of what makes up the total delay:
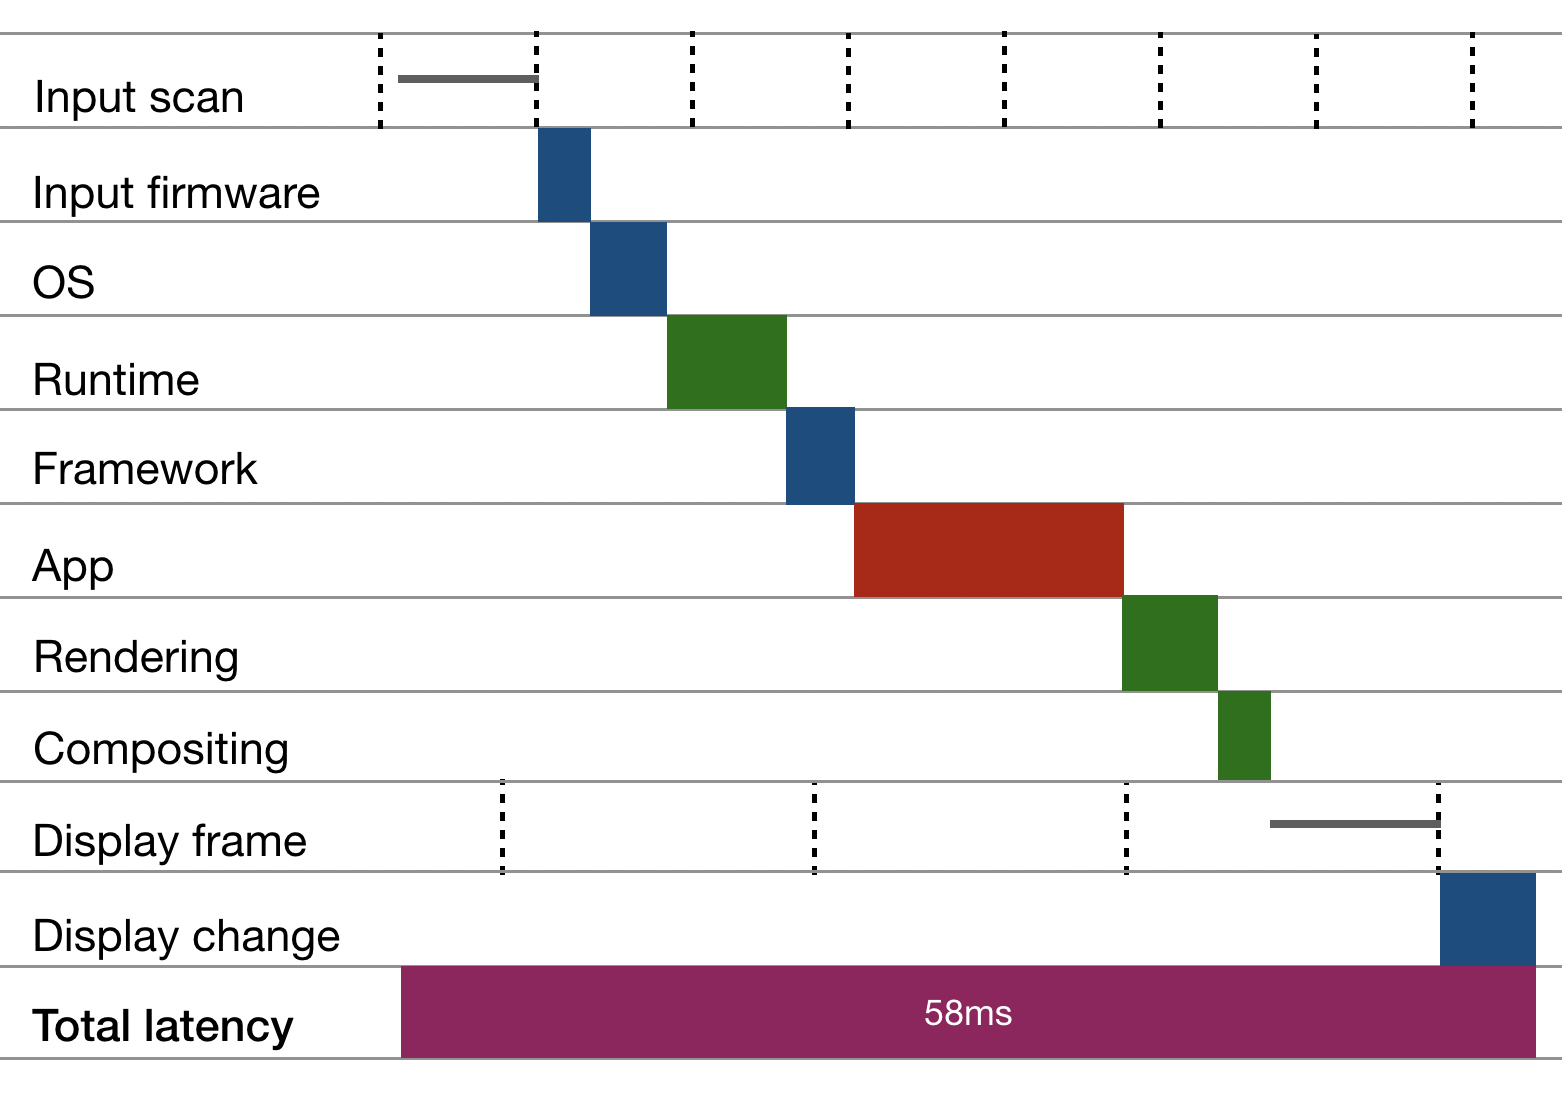
A hypothetical example of pass-through delay from input to display on screen. Dotted vertical lines indicate the cycles that the conveyor should expect.
The above example is hypothetical, but indicative. It demonstrates how many layers add latency, so the application can be quite slow, even if it runs at full frame rate.
For the response of the modern computer interface to the actions of the user meets a deep stack of technologies. Even a simple keystroke on the keyboard and the appearance of the corresponding character in the text input field is an operation that goes through a lengthy complex sequence of steps: from scanning the keyboard, through the OS processing layers and the framework, through rendering the video card and the display refresh rate.
There is a reason for such complexity, and yet we are sad that computer users who are trying to work productively, so often stay on hold, watching the hourglass icon and feeling that their devices simply do not keep up with them.
We believe that fast software empowers users and makes them more productive. , , , . , .
1. , , , . « » , Proceedings of the USENIX 2nd Symposium on Operating Systems Design and Implementation , 1996.
2. , , , , . « : » , Proceedings of the 32nd Annual ACM Conference on Human Factors in Computing Systems , 2014.
3. , , , , . « - » , Proceedings of the 25th Annual ACM Symposium on User Interface Software and Technology , 2012.
4. , , , . « ? -» , Proceedings of the 33rd Annual ACM Conference on Human Factors in Computing Systems , 2015.
5. , , , , . « ? » , Proceedings of Graphics Interface 2014 , 2014.
6. , , , . « 100 ? » , Engineering Psychology and Cognitive Ergonomics: Cognition and Design , 2017.
7. , . «40 » , Interacting with Computers , 2011.
8. -, , , , . « » , 38th International ACM SIGIR Conference on Research and Development in Information Retrieval , 2015.
We spend a lot of time at the computer. We are waiting for each time you launch applications and download web pages. Everywhere icons with spinner or hourglass. The hardware is more powerful, but the software still seems slow. Why is that?If you use a computer to do important work, then you deserve fast software. Too often, modern software does not meet these requirements. In the research lab of Ink & Switch, we studied the reasons for this situation, the software eventually became better. This article has published the results of our research.
Table of contents
Where exactly is the slowness
What do users perceive as a “slow” program? All of us sometimes the software annoys delays and lags. But in order to better understand these problems, one should supplement the intuitive sensations with academic studies that strictly answer this question.
')
Perceived speed is closely related to the concept of latency. A comparison of the research of “what seems slow” with the measurement of the real delay in real applications makes it clear how bad everything is.
Delay is not bandwidth
When discussing software performance, we often hear about bandwidth. For example, "this web server can perform 10,000 requests per second." But this is not how users perceive things. They care about how long their specific web request takes or how long it takes to open a document, or how quickly the application responds to mouse clicks. These interactions are associated with latency. Delay is a critical metric that we will explore in this article.
User Perception
Read more about the importance of latency in interactive systems here .
Other factors also affect the feel of software speed. For example, the frame rate and feedback during long tasks. But we believe that the delay is a fundamental metric, and with a very low delay, any software will feel extremely fast.
Touch interfaces
To begin, consider the human sensitivity to touch screen delays.
Researchers test this with tests that determine exactly what kind of delay users perceive. First, the subjects are offered an interface that has (say) a delay of 1 ms, and then (say) 70 ms, and is asked to perform operations like pressing a button. If an interface of 70 ms consistently shows a worse result than an interface of 1 ms, then 70 ms is called a "noticeable difference."
Minimal noticeable difference
For details on the minimum noticeable delay difference and the associated experimental installations, see, for example, this paper .
The minimum noticeable difference is the budget, after which the concrete operation will start to feel slow for the user.
For example, when dragging items on the screen, users perceive delays of only ~ 2 ms. The least noticeable delay depends on the user and the action taken, but it is always very low.
Perception of delay while dragging
A perception report of 2–16 ms when dragging with the stylus .
2−11 ms when dragging with your finger .
An average of 11 ms when dragging with your finger .
Similar results were obtained when drawing with the stylus on the tablet. Here, researchers suggested users notice a delay of 20 to 80 ms. In our own unofficial tests, a delay of about 80 ms is perceived as very noticeable, and it takes something much closer to 20 ms to make the stylus seem responsive during handwriting.
Perception delay stylus
Report on the perception of the delay 10−70 ms when writing with a stylus .
21–82 ms for various actions with the stylus .
The difference between low and high latency handwriting is obvious when comparing:
Left: iPad Pro and Notes application with a latency of about 15 ms. Right: Samsung S3 and OneNote application with a delay of about 70 ms. Video is slowed down 16 times.
Another typical operation on touch devices is clicking on buttons or links. Here, tests have determined that users notice a delay of approximately 70 ms at the turn (although for some individual users it is probably lower).
Perception of delayed tapping the screen
This study revealed an average minimum distinguishable delay of 69 ms.
Here is an example comparing two different delays:
Left: opening the settings tab on the iPhone 6s with a delay of about 90 ms. Right: switch settings on the Samsung S3 with a delay of about 330 ms. Video is slowed down 16 times.
How do modern applications meet these thresholds? If we talk about dragging with your finger, then no commercial system can consistently correspond to a delay of several milliseconds to satisfy all consumers.
Drag and Drop performance
As we will see below, even displays and equipment for data entry do not fit into the budget of 10 ms, not to mention several layers of software.
Thus, when using all current touchscreen operating systems, at least some of the users will feel that the object is lagging behind the finger while dragging.
When drawing with a stylus, a small number of systems approach an acceptably low level of latency. But most of them are much higher than these values, which is expected by users as a significant delay:
Below are the results of the Ink & Switch tests on the delay in drawing with a stylus on a tablet for various devices. Average delays, measured from contact with the screen before the beginning of the color change of the corresponding pixel, are rounded to the nearest 5 ms.
| Device | Program | Delay (ms) |
|---|---|---|
| iPad Pro | Notes | 20 |
| GoodNotes | thirty | |
| Flutter | 35 | |
| Surface pro | Onenote | 25 |
| Sketchpad | thirty | |
| Canvas | 60 | |
| Pixelbook | Squid | 40 |
| Canvas | 60 | |
| Samsung S3 | Squid | 60 |
| Flutter | 65 | |
| Canvas | 75 | |
| Liveboard | 80 |
Although we have no data on delays on all devices, but we assume that they are comparable with the stylus drawing delays observed above.
Drawing delays versus pressing delays
We expect that these delays are comparable, because in both cases touch input is used, that is, the screen refresh cycle is activated. However, there are some differences, so the values are unlikely to be exactly the same.
Since here there is a delay of about 70 ms, most systems are able to respond well to depression. But it is also easy to find applications that work much worse than the theoretical capabilities of the system.
In general, sensory systems should have very low delays so that they feel responsive. Most devices and applications are not able to provide this level of performance, and, therefore, they all feel at different degrees slow for users.
Keyboard
There is some evidence that the increase in typing delays worsens users.
Effect of input delay
In this study, random delays were added to the keystrokes, which reduced input performance. However, it evaluated only one range of delays. In addition, the study authors suggest that experienced typesetters can adapt to increased latency.
However, we do not know about studies that specifically measure the least noticeable input delays. A touch delay on the touch screen (noticeable at about 70 ms) can be a useful guide, because it also measures the time between a discrete finger touch and a visual screen update.
Below are some informal measurements of the pass-through delay of the keyboard from the start of a keystroke to the appearance of a symbol on various machines. Sources: “Computer Delay: 1977−2017” , tests Ink & Switch.
| Computer | Delay (ms) |
|---|---|
| Apple IIe | thirty |
| Commodore Pet 4016 | 60 |
| iMac g4 OS 9 | 70 |
| Macbook Pro 2014 | 100 |
| Custom Haswell-e 24Hz | 140 |
| Samsung S3 | 150 |
| Powerspec g405 Linux | 170 |
| Symbolics 3620 | 300 |
Accurate measurements of the assessment of the effects of keyboard delays would be a great experiment for adventurous researchers. In any case, it seems likely that for many users the threshold value for a noticeable delay when entering from the keyboard is below 100 ms. Perhaps much lower.
Mouse
The last type of input devices in our review. One experiment made it possible to determine that users perceive mouse delay from 34 to 137 ms with an average value of 65 ms.
Different mice have very different delay values. Some systems show values less than 10 ms by combining high-performance equipment with careful low-level programming ( an installation with a delay of about 8 ms is described here ). In addition, it is possible to go beyond 100 ms with a combination of mediocre hardware and applications that introduce additional delays, or buffers between the mouse and the display.
Applications
Application-level delays measure how long it takes to perform specific application actions, such as loading web pages. An example of such a delay is loading the NYTimes webpage, which takes about 3000 ms.
When does application activity seem fast? It is difficult to say for sure, because their actions are more complex and diverse than simple data entry. Probably, the answer also depends on user expectations (at present, people usually work with slower software). But we can calculate the approximate number.
Delay literature
See a review of the literature on the effect of latency on users of different applications. This is a good starting point for a deeper dive into the subject.
One of the reference values is a typical metric of 70 ms, as mentioned above, the least noticeable delay when the screen is pressed. If you notice a delay between clicking the link and displaying the click indicator, you should notice a similar delay between clicking and opening the web page.
Another reference value is the Google RAIL model for developers. Although the authors of this model do not substantiate their assertions, however, the model claims that the response within 100 ms “feels like an instant”, and the higher delay “[breaks] the link between action and reaction”.
You can unofficially check your own sensitivity in the terminal. Take your favorite command line programs and run them with the 'time' parameter, which measures the execution time. You will surely notice the difference between the responses in 15 ms (great!) And 500 ms (obviously slow).
As an end reference point, we take into account that the typical human response time to a visual stimulus is about 220 ms .
This value is significantly greater than the noticeable delay, because the reaction includes not only observation, but also subsequent action.
It is also necessary to take into account the conclusions of some researchers that a person is able to perceive an increase in delay at an unconscious, physiological level.
Real applications
How do real applications match these landmarks? Some cope. For example, many Unix command line programs run faster than 100 ms.
But most of the Internet applications are out of range. Google search in about 1000 ms is much faster than most web applications, but it is still noticeably slower compared with the interaction of less than 100 ms on the command line. And it's easy to find examples of pages that load longer than 5000 ms even on a good mix.
In the case of mobile and desktop computers, there are some applications that consistently demonstrate a delay of less than 100 ms, such as the built-in calculator on iOS. But it is easy to find examples of applications that significantly exceed this threshold, even if they have all the data available (or should be) locally. Consider the Slack example.
The video below shows that switching between two small-sized channels in the same workspace on the iPad Pro takes about 220 ms, although there is no need for network calls, and the iPad Pro is possibly the highest-performing mobile device in the world (video is slowed down 8 times ):
It is difficult to make a general conclusion for all programs in such a wide area as delayed action. However, it seems obvious that some applications perform actions fairly quickly and seem instant to users (less than 100 ms), but many applications do not.
Where does the slowdown come from
Thus, we have established that many programs are actually slow. Where does all this time go and what can we optimize? Consider this question, starting with the first component in the chain: input devices.
Input device
The first step in the pipeline that converts the physical input data into updates on the screen is the processing of the input data: converting a contact with a touch screen, keyboard, or mouse into a digital signal for the operating system. Here we look at how long this step takes.
Let's start with the keyboards. The table shows the measured delays from the start of a key press to a signal on a USB hub, rounded to 5 ms ( source ).
| Keyboard | Delay (ms) | |
|---|---|---|
| Apple magic | 15 | |
| Das 3 | 25 | |
| Kinesis freestyle2 | thirty | |
| Ergodox | 40 | |
| Kinesis advantage | 50 | |
| Logitech MK360 | 60 | |
As you can see, these keyboards easily select tens of milliseconds from the budget at the very first step in the processing pipeline. This is from a total budget of 100 ms or less! Much more detail about this topic is covered in the article "Printing with pleasure . "
Mice likewise take tens of milliseconds from the budget. Although the most high-performance gaming mice have a delay of less than 10 ms. Data on the response to pressing differ, here too, individual instances show a result of less than 10 ms ( example ).
In mobile devices, it is more difficult to measure the fraction of the delay that is incurred on input devices, because they are tightly integrated with other hardware components. However, we can use some of the common patterns in input device equipment to evaluate their latency, as well as stand-alone devices.
Sampling frequency
One of the common patterns is the sampling rate. In many input devices, equipment “scans” or “samples” input at a periodic interval. For example, a typical consumer touchscreen operates at a frequency of 60 Hz, that is, it polls sensors approximately every 17 ms. This means that in the worst case, the delay of the input device will be at least 17 ms, and on average no more than 8 ms.
Other things being equal, a higher scanning frequency will reduce the input delay. For example, Apple's advanced touchscreens and styluses operate at frequencies above 60 Hz (information from the Apple documentation archive ).
| Device | Touchscreen (Hz) | Stylus (Hz) |
|---|---|---|
| iPhone 6 | 60 | |
| iPhone 7 | 60 | |
| iPhone 8 | 60 | |
| iPhone X | 120 | |
| iPad Air 2 | 60 | |
| iPad Mini 4 | 60 | |
| iPad Pro | 120 | 240 |
A similar source of delay is USB polling. The USB protocol receives input from the keyboard, so the keyboard needs to wait for a USB poll to send information about the presses. Low-speed USB polling operates at 125 Hz, introducing the inevitable ~ 8 ms max. and ~ 4 ms of average delay. Later versions of USB scan with a frequency of 1000 Hz or more, minimizing the effect of delay.
There are many other potential sources of delay in input devices, for example, contact bounce (for more details, see the article “Scanning the Keyboard Matrix and Contact Bounce” on the software and hardware effects of bounce).
We will not consider all these nuances here, but we emphasize the main point: a) the input devices themselves can cause a considerable delay before any processing takes place in the software; b) this may be due to several discrete reasons, and the time delay is added up.
Displays and GPUs
The hardware at the other end of the pipeline is displays and video cards.
One of the sources of delay here is the frame rate of the display. Since displays cannot be redrawn continuously, this leads to an inevitable delay, similar to the polling of input devices described above. If the screen is updated (say) every 20 ms, then it adds a 20 ms delay in the worst case and 10 ms on average.
Motion perception
Other factors influence our perception of objects moving on the screen. Blur Busters is a great resource on this topic. For example, see LCD Motion Artifacts 101 .
Most displays operate at 60 Hz, although professional devices and game displays operate at 120 Hz, 144 Hz and 240 Hz. Thus, only the frame rate of the display usually adds about 8 ms to the delay, although in displays with the highest frame rate it can be reduced to a few milliseconds.
Another contribution to the delay from displays is the time it takes to physically change the color of pixels after receiving new data. This time ranges from a few milliseconds in high-end gaming displays to double-digit values in less responsive LCD displays.
Display response time
This parameter is difficult to measure, but some illustrative data is available on the Notebook Check website. For example, see the example of slow and fast displays.
On modern high-end devices, the display is connected to a special graphics processor (GPU). GPUs create an array of pixels to display, for example, by composing 2D layers or rendering 3D virtual scenes. Graphic processors produce frames at a rate that depends on the GPU hardware, interaction with the application and the platform code, and sometimes from the logic of synchronization with the displays.
A related problem occurs when the application code is very slow and does not send instructions to the GPU fast enough to make full use of it. This can lead to the fact that the graphics processor will create unique frames at a lower speed than if it really had frequent instructions from the application. This is a common source of lags that we see in 2D applications that display less than 60 frames per second.
Lagi
Lags like 'jank' are difficult to describe in words, but they are easily recognizable. Nathan Gitter in the Designing Jank-Free Apps article defines them as "visual faults that are unexpected or distracting."
Overlay cycles
We discussed at least three parts of the pipeline where a delay occurs due to periodic activity: input scanning, GPU rendering cycles, and display refresh cycles. It is important to note that they can be combined in such a way that in fact all delays are added:
Waiting for several cycles. The hypothetical delay cascade shows how waiting for consecutive hardware cycles can accumulate latency. Dotted vertical lines indicate the cycles that the pipeline should expect.
To proceed to the next step in the pipeline, we must wait for the next cycle. And the cycles may not be aligned with each other. Inconsistent cycles and an unfavorable initial entry time can cause an additional delay of 10 milliseconds. This is a large amount compared to the latency budgets described above.
Runtime overhead
On the software side, execution time delays are inherent in operating systems and other code that is not directly related to the application. Consider two important examples: garbage collection and scheduling.
First comes the garbage collection (GC). GC is crucial in the two most widely used platforms in the world: the web (JavaScript) and Android (Java).
In some cases, garbage collection can lead to a large delay, especially regarding the requirements for low input delay. For JavaScript or Java environments, delays in garbage collection on the order of 10 ms are not surprising. But this is completely the entire budget for dragging and dropping objects on the touch screen!
Garbage collection can delay just one frame. But as is the case with lags due to frame loss, such jerks annoy users.
There are ways to reduce GC latency. They include moving as much of the GC work as possible beyond the limits of the main flow, as well as optimizing the GC operation only in small separate pauses. See, for example, the efforts of V8 to move as much garbage collection operations as possible beyond the limits of the main flow and the efforts of the Go developers to ensure that the maximum GC lags are significantly less than 1 ms.
There is another option to use a programming language that partially sacrifices the convenience of the GC, but has more predictable performance. Languages like Swift avoid arbitrary garbage collection using automatic reference counting .
Another potential source of overhead is scheduling in the operating system. Our application (and its OS dependencies) do not necessarily work all the time. Other programs can be scheduled for launch, and ours are forcibly suspended, albeit for a very short time. Each program asks for time, and the number of processor cores is limited.
A CPU load is associated with a dispatch issue. If your application meets its performance goals, but it requires almost 100% of computing resources, this may well annoy users. The battery consumption will increase, the device will heat up and, probably, will start to make noise with the fan. In other words, other things being equal, low CPU utilization is better for the user.
Intentional delay
A typical source of delays in mobile interfaces is the design of the OS itself and applications. There are some important interactions that can be accomplished only by real expectation.
Android and iOS largely use “long press” to access the context menu. They require the user to wait hundreds of milliseconds to execute the command.
Delays are associated with this to eliminate ambiguities. For example, in mobile Safari there is a default delay of 350 ms between when the user clicks on the link and when the browser starts loading a new page. This is necessary to determine the difference between clicking on a link and double-tapping (zoom). For details on this particular delay, see here . There's also information about the latest changes that allow application developers to get around this problem.
Hostile agents
A common source of latency for users on the Internet is malicious activities, such as activity trackers, that track user activity and download intrusive ads.
An article of 500 words on the Washington Post site requires about a hundred HTTP requests and loads approximately 4400 ms. Many requests are needed for trackers and ads. Shown a small part of them
There are many great articles about obesity on the web: see The Bullshit Web , “The Crisis of Obesity Websites” , Web bloat , etc.
We simply emphasize that the biggest source of delay on many sites is the loading of any nonsense against the desire of users.
Application code
The last source of the delay that we mention is perhaps the most obvious one: this is the application itself. If an application spends a lot of processor time processing input or performing an action, it will be slow.
Putting it all together
Consider an example of what makes up the total delay:
A hypothetical example of pass-through delay from input to display on screen. Dotted vertical lines indicate the cycles that the conveyor should expect.
The above example is hypothetical, but indicative. It demonstrates how many layers add latency, so the application can be quite slow, even if it runs at full frame rate.
To fast software
For the response of the modern computer interface to the actions of the user meets a deep stack of technologies. Even a simple keystroke on the keyboard and the appearance of the corresponding character in the text input field is an operation that goes through a lengthy complex sequence of steps: from scanning the keyboard, through the OS processing layers and the framework, through rendering the video card and the display refresh rate.
There is a reason for such complexity, and yet we are sad that computer users who are trying to work productively, so often stay on hold, watching the hourglass icon and feeling that their devices simply do not keep up with them.
We believe that fast software empowers users and makes them more productive. , , , . , .
Literature
1. , , , . « » , Proceedings of the USENIX 2nd Symposium on Operating Systems Design and Implementation , 1996.
2. , , , , . « : » , Proceedings of the 32nd Annual ACM Conference on Human Factors in Computing Systems , 2014.
3. , , , , . « - » , Proceedings of the 25th Annual ACM Symposium on User Interface Software and Technology , 2012.
4. , , , . « ? -» , Proceedings of the 33rd Annual ACM Conference on Human Factors in Computing Systems , 2015.
5. , , , , . « ? » , Proceedings of Graphics Interface 2014 , 2014.
6. , , , . « 100 ? » , Engineering Psychology and Cognitive Ergonomics: Cognition and Design , 2017.
7. , . «40 » , Interacting with Computers , 2011.
8. -, , , , . « » , 38th International ACM SIGIR Conference on Research and Development in Information Retrieval , 2015.
Source: https://habr.com/ru/post/431282/
All Articles