Grafana as another tool for technical monitoring of the software products we create.
Another article in the Logicify Monitoring Tools series talks about Grafana. We use this software for visualizing and analyzing data from both internal and external projects. The article can be useful for technical directors, developers, DevOps, system administrators, project managers, as well as all interested parties.

What is Grafana?
Grafana is an open source platform for data visualization, monitoring and analysis. This tool, in combination with Graylog, is part of our two-way system for monitoring user behavior and system performance . Grafana allows users to create dashboards with panels, each of which displays specific indicators for a set period of time. Each dashboard is universal, so it can be customized for a particular project or taking into account any development and / or business needs.
Our Logicify team mainly uses Grafana in combination with Elasticsearch and InfluxDB, but this software supports many other data sources (Prometheus, MySQL, Postgres, etc.). For each data source, Grafana provides a custom query editor and special syntax.
Grafana Terms
- Panel - the basic element of the visualization of selected indicators. Grafana supports panels with graphs, single statuses, tables, click heat maps and free text, as well as integration with official and community-created plugins (for example, a world map or a clock) and applications that can also be visualized. You can customize the style and format of each panel; All panels can be dragged to a new location, rebuilt and resized.
- Dashboard - a set of separate panels, placed in a grid with a set of variables (for example, the name of the server, application and sensor). By changing variables, you can switch the data displayed on the dashboards (for example, data from two separate servers). All dashboards can be customized, as well as partitioned and fragmented the data presented in them according to the user's needs. A large community of code developers and users is involved in the Grafana project, so there is a large selection of ready-made dashboards for different types of data and sources.
- In dashboards, you can use annotations to display certain events on different panels. Annotations are added by custom queries to Elasticsearch; the annotation on the graph is displayed as a vertical red line. When you hover the cursor over the annotation, you can get a description of the event and tags, for example, to track the server's response with the error code 5xx or restart the system. This allows you to easily match the time, a specific event and its consequences in the application and explore the behavior of the system.
Advanced methods for using the Grafana tool with the Logicify command
Using Grafana in internal projects
For our internal project “Internet of Things” (office climate monitoring solution), we connected Grafana to InfluxDB , a time series database, in order to visualize changes in the microclimate parameters in the office and respond to them accordingly. A set of sensors measures temperature, humidity, atmospheric pressure and CO2 levels in each area of our office in Kherson; These parameters are collected and visualized as Grafana graphs on a large kitchen monitor and online.
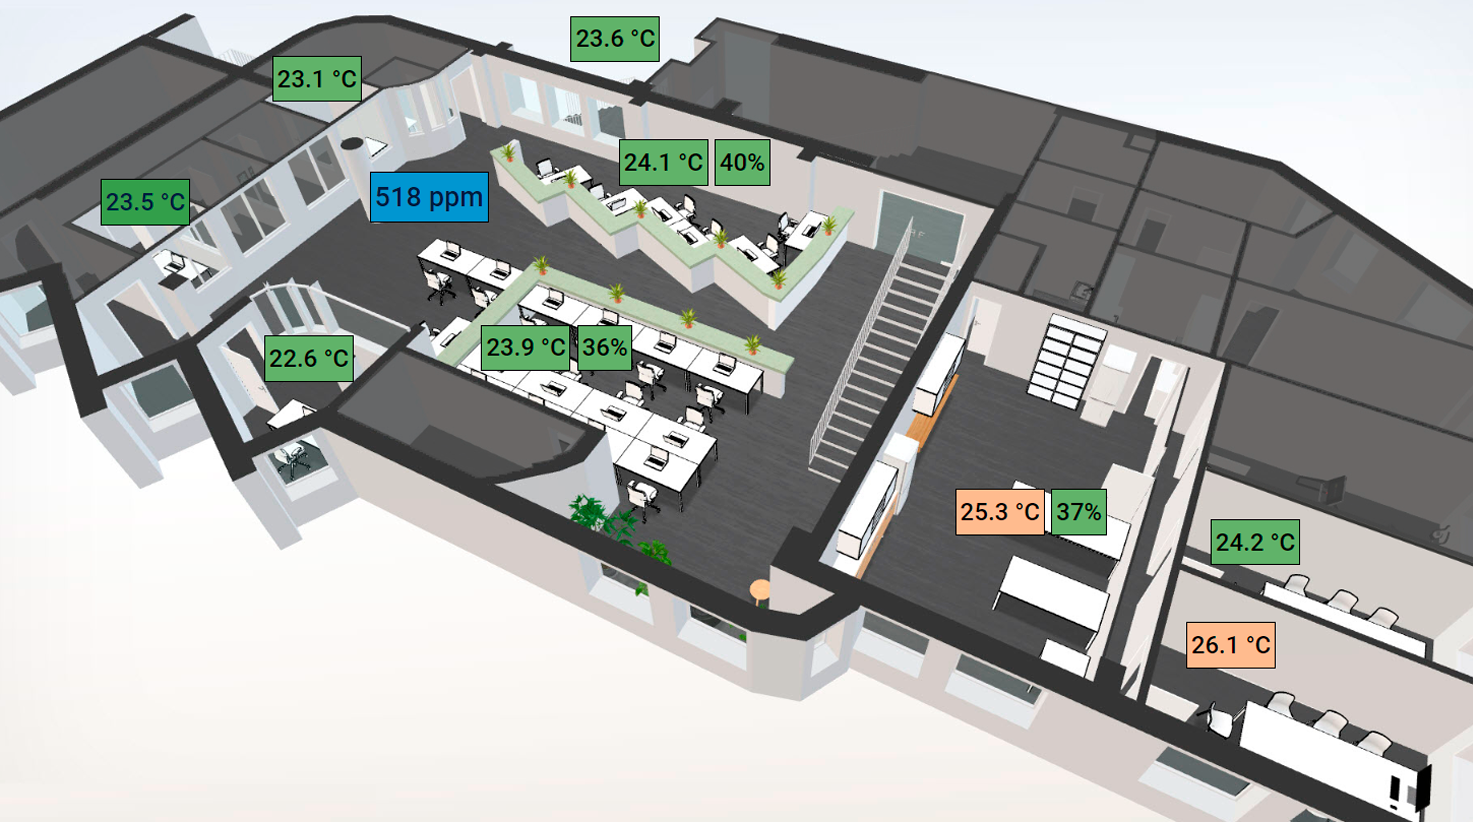
Dashboard Grafana with office areas Logicify
So we constantly monitor the air quality parameters, and our office manager responds to changes: opens windows, if the CO2 level is too high, turns the air conditioning and humidifiers on and off.
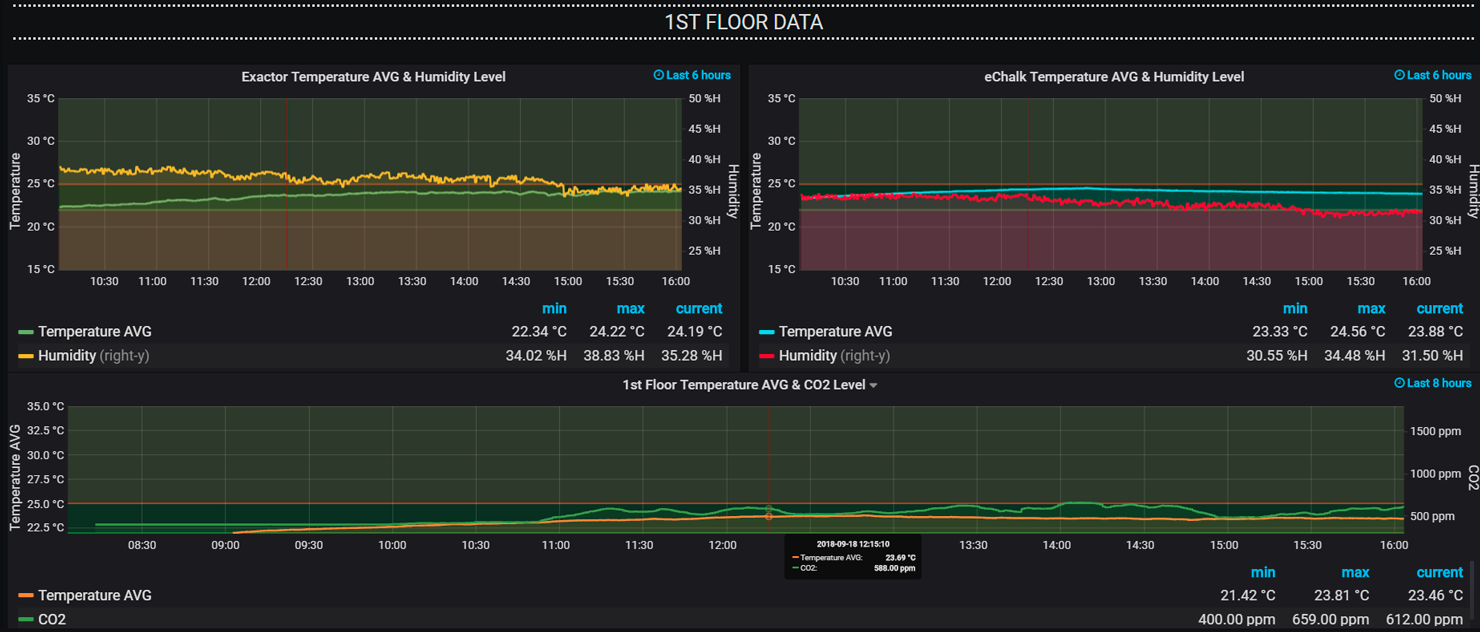
Dashboard Grafana with microclimate parameters in offices
Thanks to the graphs and annotations of time series displayed in Grafana, we analyzed trends in the microclimate in the offices during several months and seasons. We also used this tool to visualize some useful widgets and information (weather forecast, currency exchange rates, internal calendars) on a large kitchen monitor.
How to use Grafana in custom web applications
Grafana + graylog
We use the Graylog tool to store web application logs, manage them, and monitor their performance during both the design and operational phases. Grafana is a tool that converts logs stored in Graylog into visual forms for analytical and system monitoring. For one of our current projects, the Grafana tool can be called the user interface for downloading and monitoring the performance of web applications and client flow. Graylog and Grafana tools exist independently of each other, we did not create any special complex integration tools to connect them to each other. Because Graylog stores all the log data in Elasticsearch, one of the Grafana data sources, we simply use the specific Elasticsearch index where logs are stored to connect Grafana to Graylog.
What indicators can be visualized in Grafana for a web application
Plain text logs or error notifications are not “interesting” to Grafana, since its main purpose is to visualize data in the form of graphs, charts and tables. We wrote a custom module for Django to collect data that we would like to track for each request processed and the network / employee response. The data included not only the status of “success” / “failure”, but also a set of structured fields (both general and project related), such as:
- application version
- unique identifier for each request
- response time and status
- error code (if any)
- IP address from which the request was sent
- user information (e-mail, username for registered users, role, permissions)
- device, etc.
Django places custom structured analytic records in Graylog, which stores them in a separate thread. Although this data can be visualized using Graylog's built-in dashboards, it doesn’t look as good as Grafana dashboards. Therefore, we force Grafana to read this analytical data and visualize it. Thus, we monitor application performance and load data both in real time and in retrospect.

Grafana as a debugging tool
Grafana dashboards mainly help us debug applications. If the end client reports a problem, Grafana gives us the opportunity to distinguish errors on the client / server side from real errors or gaps in the application logic. We track all web requests initiated by the client (using an email address), application administrators and the application itself for a specified period of time and using the exception method, we find the cause.
We also debug and fix bugs if we notice an anomaly in the dashboards in the application load and performance graphs. The following example Grafana graphic shows the response time to web requests over a specific period of time. For each web request, we track the maximum, minimum and average response times. If we see a request that took too much time to process, we scale a certain part of the graph and investigate the problem.
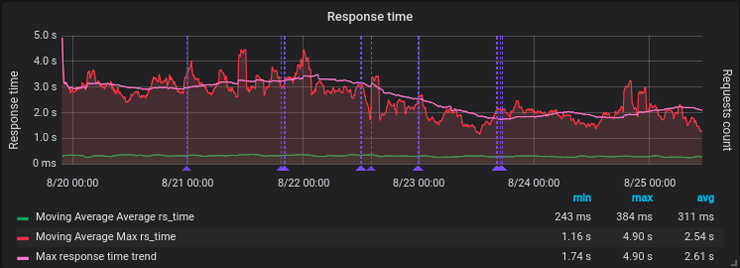
An example of a Grafana graphic that displays the response time to web requests.
Another graph shows the system load for a set period of time and is useful for tracking traffic. If we see an unusual surge of activity, for example, during off-hours or on weekends, we explore it. Such a spike can be caused, for example, by Google crawlers that index web site content or malicious bots scan our system for vulnerabilities. Again, each case is examined and reviewed accordingly.
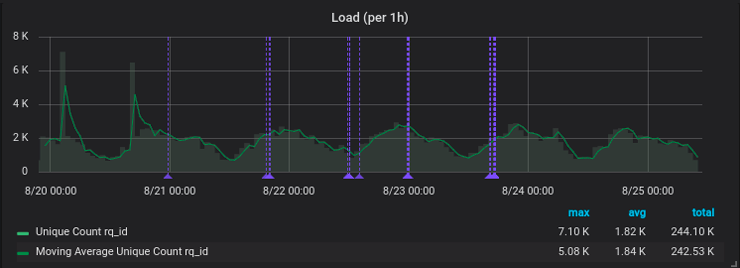
Sample Grafana graphics showing the download of the application
Grafana has a built-in notification mechanism (for example, via email or via Slack notifications) according to certain rules. We do not use this feature of the Grafana tool, since we have all the notifications configured in Graylog . However, some problems with system performance can be seen only after the program is run, for example, an unusually long response time to a web request. We will not receive Graylog notifications about this, but the anomaly will be clearly visible on the Grafana chart. So, both tools complement each other when we find out about a problem: at a high level, we check Grafana to understand what happened and why, and then dig deeper using Graylog, using a specific request identifier.
Unlike Graylog, used for both developed and used applications, Grafana applies only to used applications. The only exception when Grafana is used for an application that is still at the design stage is performance testing. We emulate the system boot using JMeter, then check the Grafana dashboards to see how it reacts.
Grafana as a business intelligence tool
In addition to the goals of performance tracking and debugging, Grafana dashboards are a powerful tool for making informed business decisions. When properly configured (preferably in tandem with the Google Analytics service), Grafana can visualize custom analytics of user behavior in the system in the form of pie charts, time histograms and other graphical elements. Based on them, parties interested in the product can make decisions about further scaling the application, adding or removing some features, and improving the customer interaction cycle.
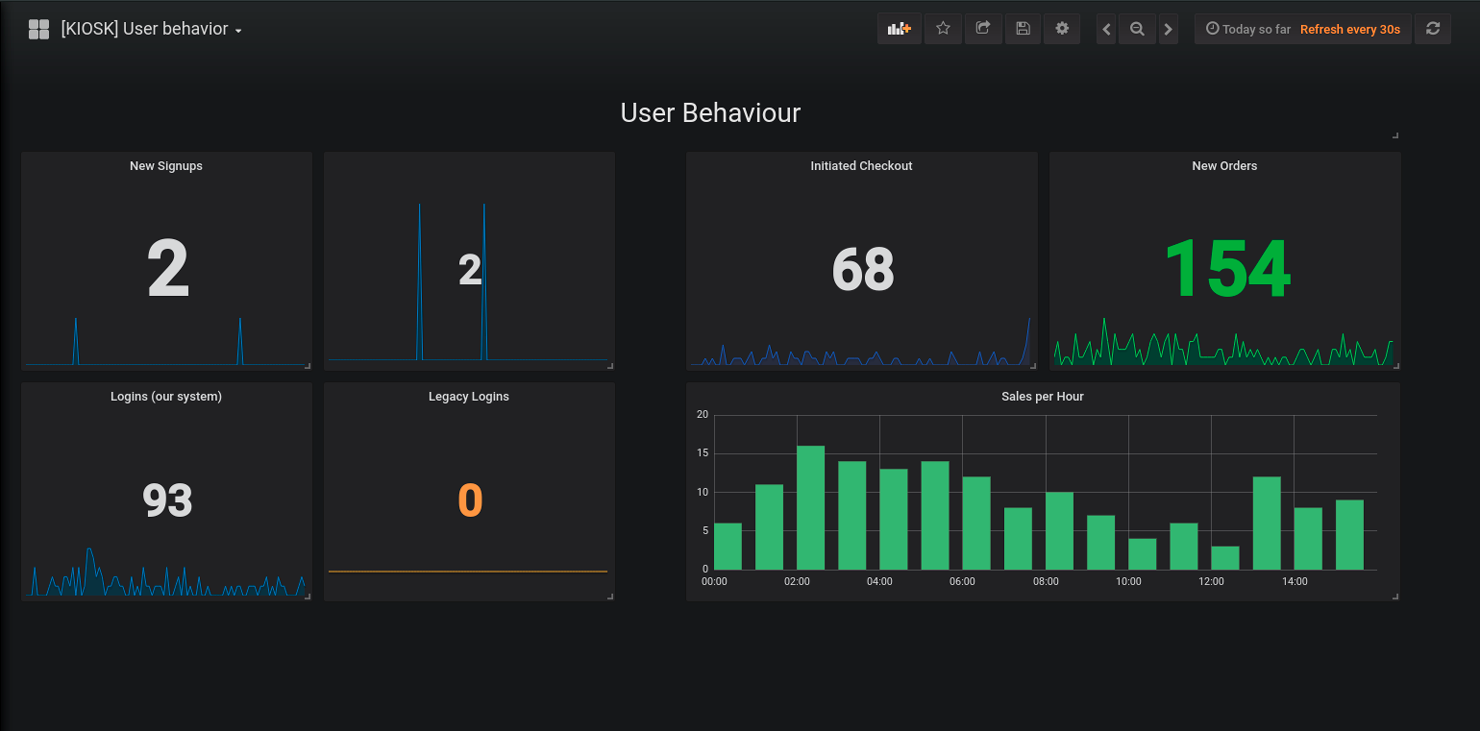
Grafana dashboard example that displays user behavior in an e-commerce application
Since the above dashboards are more business-oriented, developers use it for internal purposes, rather, as a provisioning tool, to track the flow of customers in an e-commerce application: registration, authorization, orders placed during a given period of time.
Here are 2 real projects where, with the help of Grafana, we managed to improve the usability of the web application.
- With the help of Grafana, we regularly monitor the status of periodic orders in the system and filter failed orders. These orders are based on a subscription, that is, they are generated in the system every month, and money is automatically withdrawn from customers' bank accounts. Sometimes payments do not go through (not enough money / financial institution refusal), and then system administrators check the situation and contact customers to re-generate the order manually. Thus, no order falls out of sight; Both customers and suppliers are satisfied.
- Using reports created using Grafana for an e-commerce application, we found that a large percentage of new customers leave the checkout page, although they already have products in their shopping carts. This conclusion was supported by Google Analytics reports, so the ordering procedure was analyzed step by step and improved: users can now place an order in 2 clicks. As a result, the ratio of visitors to customers increased - increased and the supplier's profit.
Grafana is an important component of the monitoring system of the Logicify team for both internal and external projects. This software has an open source code, plus a large and active developer community. But most of all we like the flexibility - it supports many data sources and makes it easy to customize dashboards and panels.
Related articles:
- Graylog as a tool for technical monitoring of the software we create.
- How to create a connected office solution using only a soldering iron and a bit of enthusiasm
- Apache JMeter: A Powerful Tool for Testing Performance and Load
- Logicify Team Office Dashboard
- Logicify two-way system for monitoring user behavior and system status
')
Source: https://habr.com/ru/post/431122/
All Articles