PHP performance: we plan, profile, optimize

Hi, Habr! Two years ago we wrote about how we switched to PHP 7.0 and saved a million dollars. On our load profile, the new version turned out to be twice as efficient in terms of CPU usage: the load that we had previously served ~ 600 servers, after the transfer, we started to serve ~ 300. As a result, for two years we had a reserve capacity.
But Badoo is growing. The number of active users is constantly increasing. We are improving and developing our functionality, so that users spend in the application more and more time. And this, in turn, is reflected in the number of requests, which in two years has increased 2-2.5 times.
')
We found ourselves in a situation where the double performance gain was leveled by more than twice the growth of requests, and we again began to approach the limits of our cluster. In the PHP core, useful optimizations are expected again (JIT, preloading), but they are planned only for PHP 7.4, and this version will be released not earlier than in a year. Therefore, the trick with the transition now can not be repeated - you need to optimize the application code itself.
Under the cut, I will tell you how we approach such tasks as using tools, and give examples of optimizations, ideas and approaches that we use and which helped us in due time.
Why optimize
The easiest and most obvious way to solve a performance problem is to add iron. If your code runs on one server, then adding another one will double the performance of your cluster. Translating these costs to the developer’s working time, we ask ourselves: can he get a two-fold increase in productivity during this time through optimizations? Perhaps, yes, and, perhaps, no: it depends on how optimally the system is already working and how good the developer is. On the other hand, the purchased server will remain in the ownership of the company, and the time spent will not be returned.
It turns out that in small volumes the correct solution will often be the addition of iron.
But take our situation. Now, after the gain from the transition to PHP 7.0 was offset by the growth of activity and the number of users, we again have 600 servers serving requests to a PHP application. In order to increase capacity by one and a half times, we need to add 300 servers.
Take for the calculation of the average cost of the server - 4000 dollars. 300 * 4000 = 1,200,000 dollars - the cost of increasing capacity by half.
That is, in our conditions, we can invest a significant amount of working time in optimizing the system, and it will still be more profitable than buying iron.
Capacity planning
Before you do something, it is important to understand whether there is a problem. If it is not, then it is worth trying to predict when it may appear. This process is called capacity planning.
A concrete indicator of performance problems is response time. After all, in fact, it does not matter if the CPU (or other resources) is 6% or 146% loaded: if the client receives the service of the required quality in a satisfactory time, then everything works well.
The lack of focus on response time is that it usually begins to increase only when the problem has already appeared. If it is not there yet, then it is difficult to predict its appearance. In addition, the response time reflects the results of the influence of all factors (braking services, network, disks, etc.) and does not provide an understanding of the causes of problems.
In our case, the bottleneck is usually the CPU, so when planning the size and performance of clusters, we primarily pay attention to the metrics associated with its use. We collect CPU usage from all of our machines and build graphs with average value, median, 75th and 95th percentile:
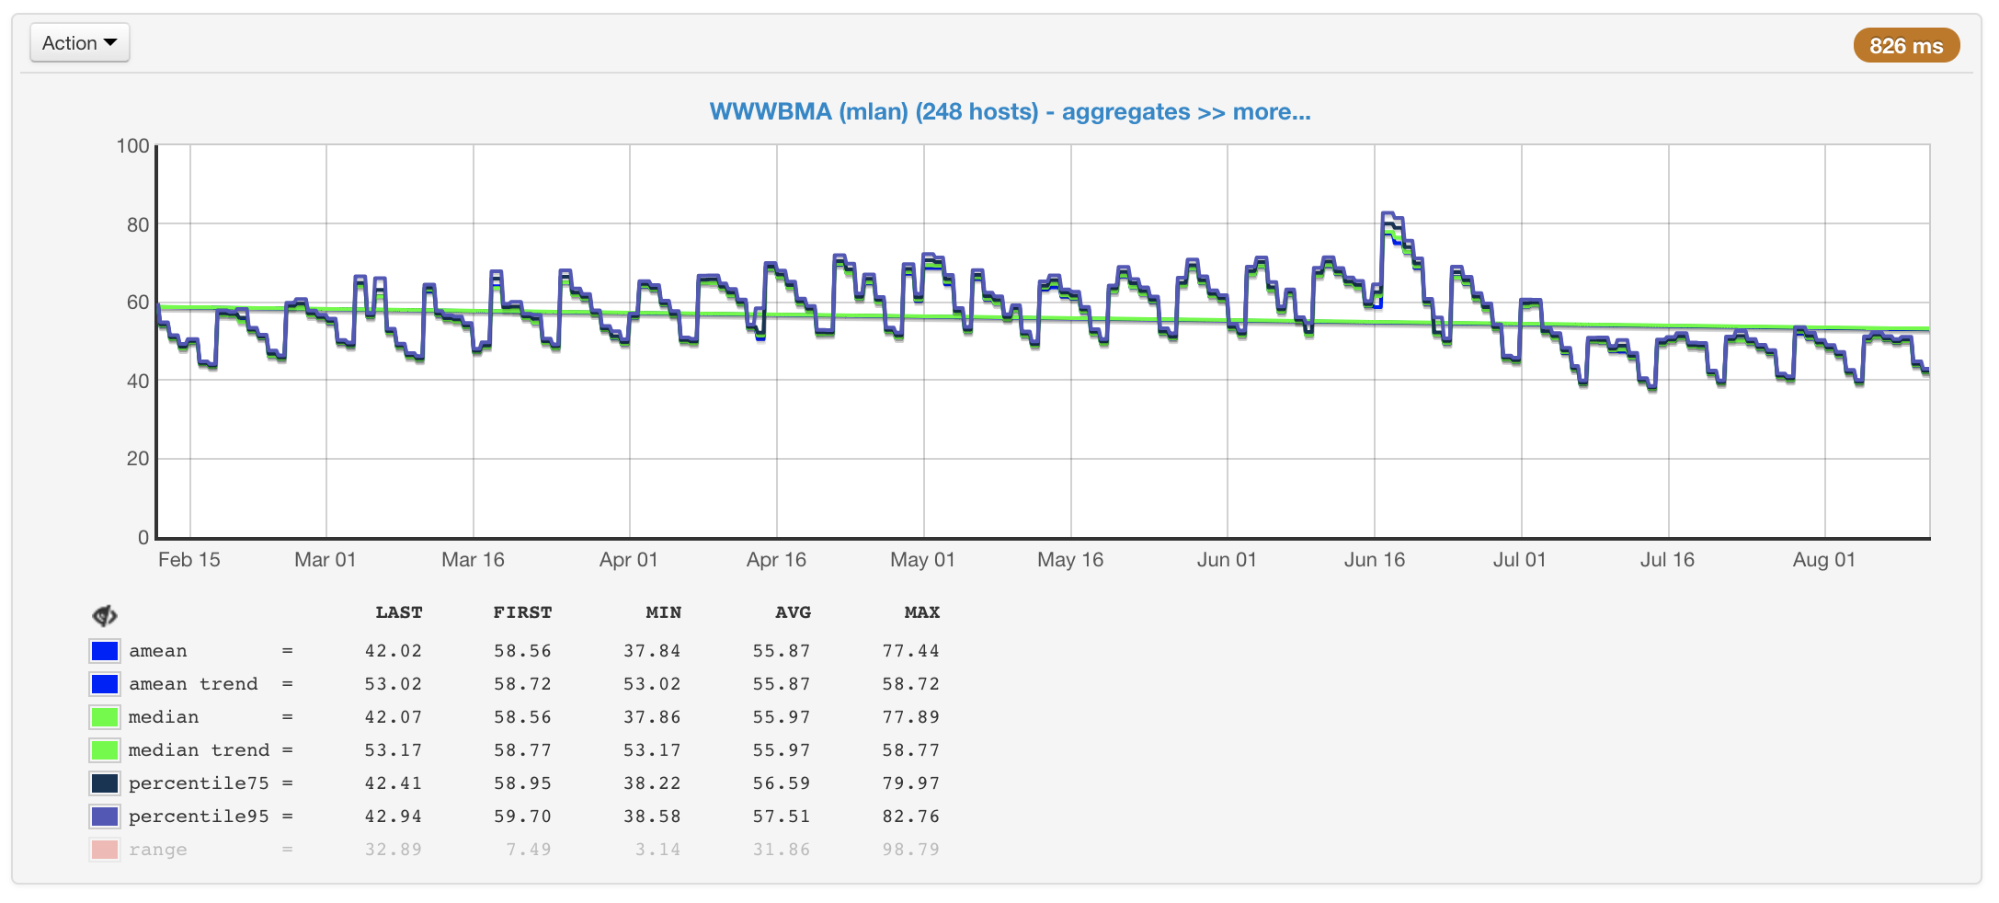
CPU load of cluster machines in percent: average, median, percentile
In our clusters, hundreds of machines that have been added there over the years. They are different in configuration and performance (the cluster is not homogeneous). Our balancer takes this into account ( article and video ) and loads the machines according to their capabilities. In order to control this process, we also have a schedule of maximum and minimum loaded machines.

Most and least loaded cluster machines
If you look at these graphs (or simply at the output of the top command) and see the CPU load at 50%, then you would think that we still have a margin to double the load. But in fact, this is usually not the case. And that's why.
Hyper-threading
Imagine one core without hypertreding. Load it with one CPU-bound-thread. We will see in the top download at 100%.
Now we will enable hypertreaming on this core and load it in the same way. In the top we will see already two logical cores, and the total load will be 50% (usually on one 0%, and on the other - 100%).
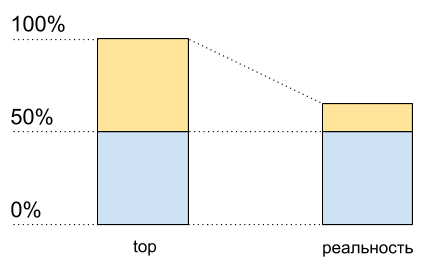
CPU utilization: data top and what actually happens
As if the processor is only 50% loaded. But there was no physically additional free core. Hypertrending allows in some cases to perform more than one process on one physical core simultaneously. But this is far from a doubling of performance in typical situations, although on the CPU usage graph this also looks like another half of the resources: from 50% to 100%.
This means that after 50% of CPU usage, when hyper-trading is enabled, it will not grow in the same way as it grew before.
I wrote the following code for demonstration (this is a kind of synthetic case, in reality the results will differ):
Script code
<?php $concurrency = $_SERVER['argv'][1] ?? 1; $hashes = 100000000; $chunkSize = intval($hashes / $concurrency); $t1 = microtime(true); $children = array(); for ($i = 0; $i < $concurrency; $i++) { $pid = pcntl_fork(); if (0 === $pid) { $first = $i * $chunkSize; $last = ($i + 1) * $chunkSize - 1; for ($j = $first; $j < $last; $j++) { $dummy = md5($j); } printf("[%d]: %d hashes in %0.4f sec\n", $i, $last - $first, microtime(true) - $t1); exit; } else { $children[$pid] = 1; } } while (count($children) > 0) { $pid = pcntl_waitpid(-1, $status); if ($pid > 0) { unset($children[$pid]); } else { exit("Got a error pid=$pid"); } } I have two physical cores on my laptop. Run this code with different input data to measure the performance of its work with a different number of parallel processes C.
Measurement results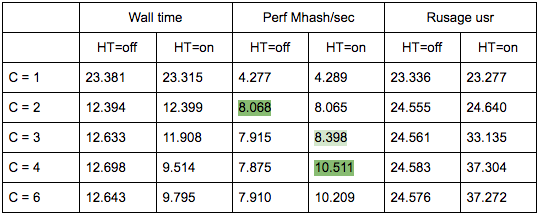
Build a schedule on the results of launches:
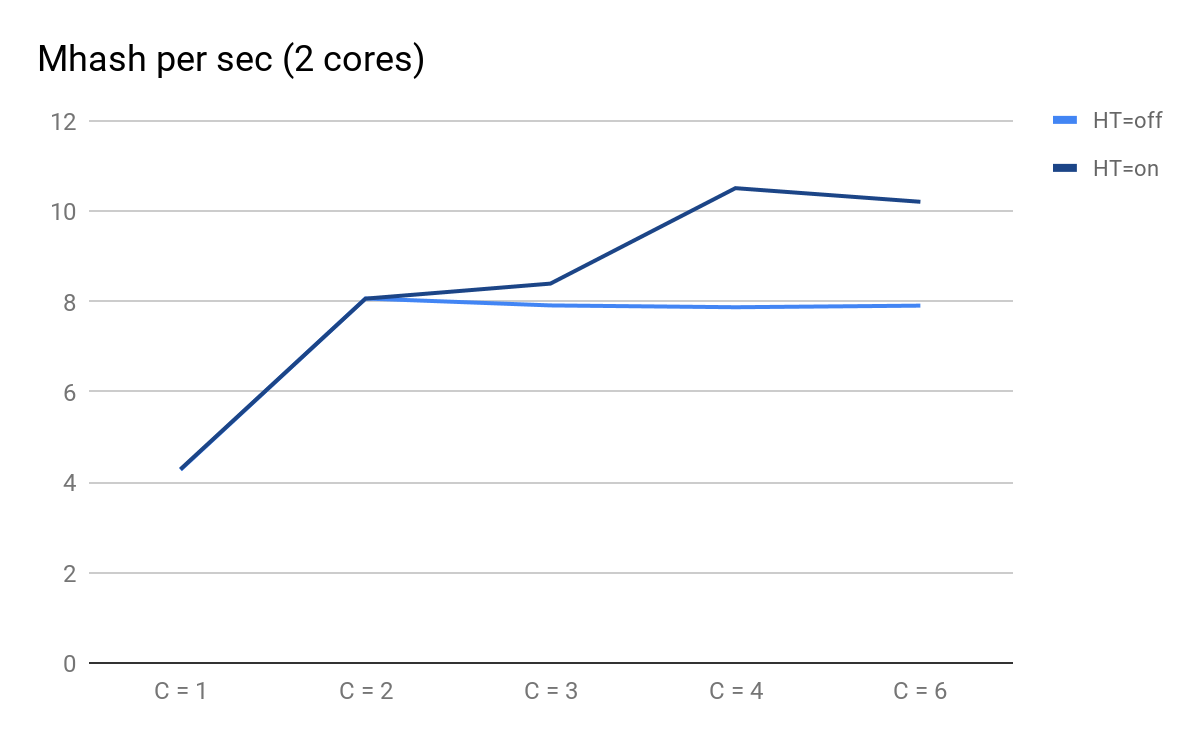
Script performance depending on the number of parallel processes
What you can pay attention to:
- C = 1 and C = 2 are predictably the same for HT = on and HT = off, performance doubles when you add a physical core;
- on C = 3, advantages from HT become noticeable: for HT = on, we were able to get additional performance, moreover, for HT = off with C = 3 and further, it begins to decrease predictably slowly;
- at C = 4, we see all the benefits of HT; we were able to squeeze out an additional 30% of performance, but in comparison with C = 2 at this time, CPU usage increased from 50% to 100%.
Total, seeing in the top 50% of the CPU load, when executing this script, we get 8.065 Mhash / sec, and at 100% - 10.511 Mhash / sec. This means that at 50% of the top we get 8.065 / 10.511 ~ 77% of the maximum system performance, and in fact we have about 100% in stock - 77% = 23%, not 50%, as it might seem.
This fact must be considered when planning.
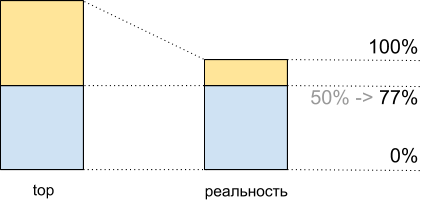
CPU utilization for demoscript: top data and what actually happens
Traffic irregularity
In addition to hyper-trading, planning also complicates traffic irregularity depending on the time of day, day of the week, season and other frequency. For us, for example, the peak is Sunday evening.

Requests per second peak Sunday evening
Not always the number of requests changes in the obvious way. For example, users can somehow interact with other users: the activity of some can generate push / emails to others and thus involve them in the process. To this are added promo campaigns that increase traffic and to which you also need to be ready.
All this is also important to consider when planning: for example, to build a trend by peak days and keep in mind the possible nonlinearity of peak growth.
Profiling and measurement tools
Suppose we found out that there were performance problems, realized that it was not the databases / services / other that were to blame, and nevertheless decided to optimize the code. To do this, first of all, we need a profiler or some tools that allow us to find bottlenecks and subsequently see the results of our optimizations.
Unfortunately, for PHP today there is no good universal tool.
perf
perf is a profiling tool built into the Linux kernel. It is a sampling profiler that is launched by a separate process and therefore does not directly add an overhead to the program being profiled. Indirectly added overhead evenly “smeared”, therefore, does not distort the measurement.
With all its advantages, perf is able to work only with compiled code and with JIT and does not know how to work with code that runs “under a virtual machine”. Therefore, profiling the PHP code itself will not work in it, but you can clearly see how PHP works inside, including various PHP extensions, and how much resources are spent on it.
We, for example, with the help of perf, found several bottlenecks, including a place with compression, which I will discuss below.
Example:
perf record --call-graph dwarf,65528 -F 99 -p $(pgrep php-cgi | paste -sd "," -) -- sleep 20
perf report
(if the process and perf are executed under different users, then perf needs to be started from under sudo).

Example output of perf report for PHP-FPM
XHProf and XHProf aggregator
XHProf is an extension for PHP that puts timers around all function / method calls, and also contains tools for visualizing the results thus obtained. Unlike perf, it allows you to operate with the terms of PHP-code (in this case, what happens in the extensions can not be seen).
The disadvantages include two things:
- all measurements are collected within a single request, therefore they do not provide information about the picture as a whole;
- The overhead projector is not as big as, for example, when using Xdebug, but it is there, and in some cases the results are distorted (the more often a function is called and the simpler it is, the stronger the distortion).
Here is an example illustrating the last point:
function child1() { return 1; } function child2() { return 2; } function parent1() { child1(); child2(); return; } for ($i = 0; $i < 1000000; $i++) { parent1(); } 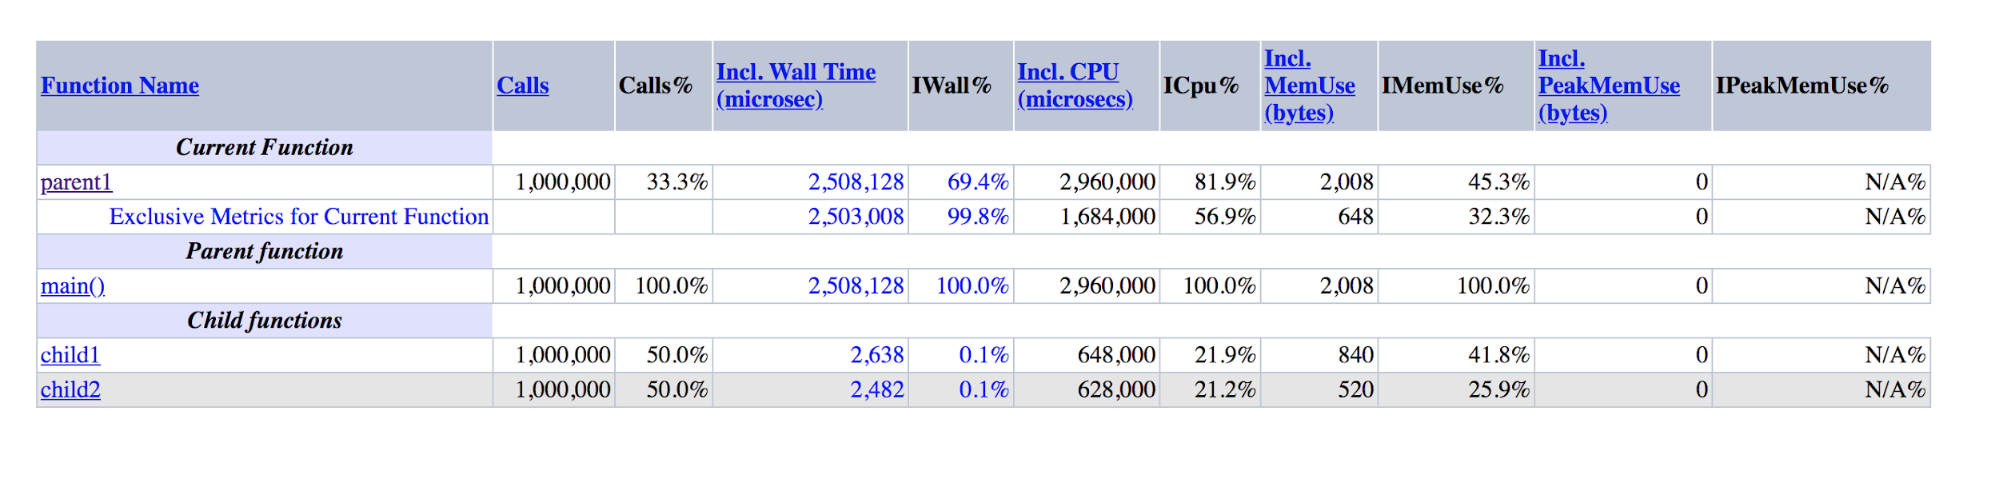
The output of XHProf for demoscript: parent1 is orders of magnitude larger than the sum of child1 and child2
It can be seen that parent1 () was performed about 500 times longer than child1 () + child2 (), although in reality these numbers should be approximately equal, as are main () and parent1 ().
If the last drawback is difficult to fight, then to combat the first, we made an add-on for XHProf, which aggregates profiles of different requests and visualizes aggregated data.
In addition to XHProf, there are many other less well-known profilers working along similar lines. They have similar advantages and disadvantages.
Pinba
Pinba allows you to monitor performance in the context of scripts (actions) and on pre-arranged timers. All measurements in the context of scripts are made out of the box; for this, no additional actions are required. For each script and timer, getrusage is executed , so we know exactly how much processor time was spent on a particular piece of code (as opposed to sampling profilers, where this time can be network, disk, and so on). Pinba is great for storing historical data and getting pictures in general, as well as within specific types of requests.
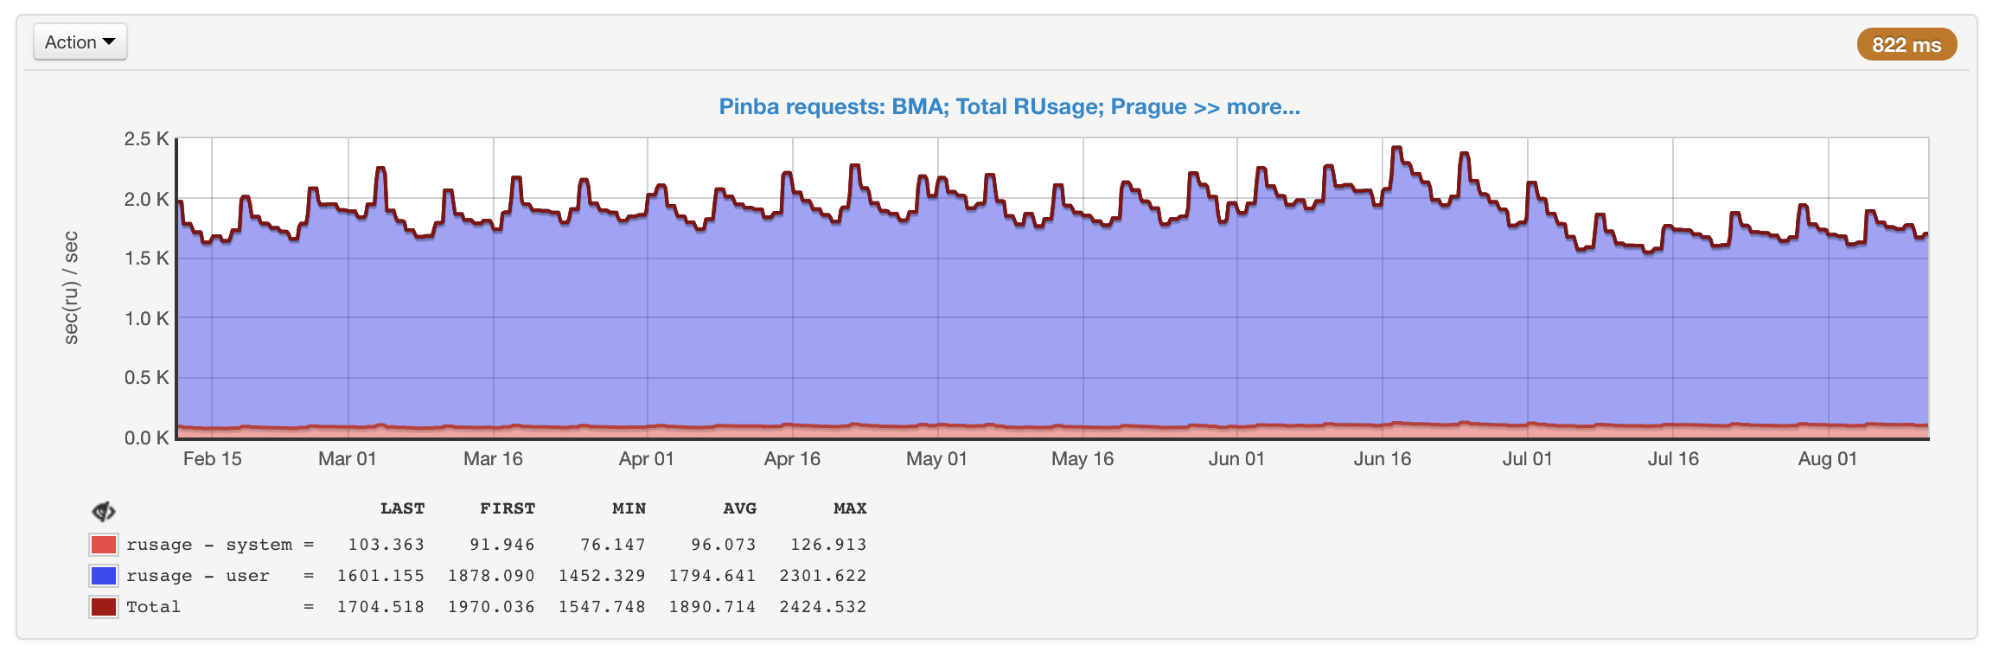
General rusage of all scripts, obtained from Pinba
The disadvantages include the fact that timers that profile specific parts of the code, rather than the entire script, must be set in the code in advance, as well as the presence of an overhead projector, which (as in XHProf) can distort the data.
phpspy
phpspy is a relatively new project (the first commit on GitHub was six months ago), which looks promising, so we are closely following it.
From the user's point of view, phpspy is similar to perf: a parallel process is started, which periodically copies portions of the PHP process's memory, parses them and receives stack traces and other data from there. This is done in a rather specific way. In order to minimize overhead, phpspy does not stop the PHP process and copies the memory right during its work. This leads to the fact that the profiler can get a non-consistent state, stack-traces can be broken. But phpspy can detect this and discards such data.
In the future, using this tool, it will be possible to collect both data on the picture as a whole and profiles of specific types of requests.
comparison table
To structure the differences between the tools, let's make a pivot table:

Comparison of the main features of profilers
Flame graphs
Optimizations and approaches
With these tools, we constantly monitor the performance and use of our resources. When they are used unnecessarily or we are approaching the threshold (for the CPU, we empirically chose a value of 55% to have time left for growth), as I wrote above, optimization is one of the solutions to the problem.
It is good if the optimization has already been done by someone else, as was the case with PHP 7.0, when this version turned out to be much more productive than the previous ones. We generally try to use modern technologies and tools, including timely updates to the latest versions of PHP. According to public benchmarks , PHP 7.2 is 5–12% faster than PHP 7.1. But this transition, alas, gave us much less.
For all the time we have implemented a huge number of optimizations. Unfortunately, most of them are strongly connected with our business logic. I will talk about those that may be relevant not only for us, or ideas and approaches from which you can use outside of our code.
Compress zlib => zstd
We use compression for large keys. This allows us to spend three to four times less memory for storage at the expense of additional CPU costs for compression / decompression. We used zlib for this (our extension for working with memcs is different from those that come with PHP, but the official one also uses zlib).
In perf production was like this:
+ 4.03% 0.22% php-cgi libz.so.1.2.11 [.] inflate
+ 3.38% 0.00% php-cgi libz.so.1.2.11 [.] deflate
7-8% of the time was spent on compression / decompression.
We decided to test different levels and compression algorithms. It turned out that zstd works on our data almost ten times faster, losing in place by ~ 1.1 times. A fairly simple change in the algorithm saved us ~ 7.5% of the CPU (this, let me remind you, on our volumes is equivalent to ~ 45 servers).
It is important to understand that the ratio of the performance of different compression algorithms can vary greatly depending on the input data. There are various comparisons , but most precisely this can be assessed only by real examples.
IS_ARRAY_IMMUTABLE as a repository for infrequently changing data
Working with real-life tasks, one has to deal with such data that is needed often and at the same time rarely changes and has a limited size. We have a lot of similar data, a good example is the configuration of split tests . We check whether the user is subject to the conditions of a particular test, and depending on this we show him experimental or regular functionality (this happens during almost every request). In other projects, such an example can be configs and various reference books: countries, cities, languages, categories, brands, etc.
Since such data is often requested, receiving it can create a noticeable additional load on both the application itself and the service in which this data is stored. The last problem can be solved, for example, with the help of APCu, which uses the memory of the same machine as PHP-FPM as storage. But even in this case:
- there will be serialization / deserialization costs;
- need to somehow invalidate the data when changing;
- there is some overhead compared to just accessing a variable in PHP.
In PHP 7.0, IS_ARRAY_IMMUTABLE optimization appeared . If you declare an array, all elements of which are known at the time of compilation, it will be processed and placed in the OPCache memory once, PHP-FPM workers will refer to this shared memory without spending its own before attempting the change. It also follows from this that including such an array will take a constant time regardless of size (usually ~ 1 microsecond).
For comparison: an example of the time to get an array of 10,000 elements via include and apcu_fetch:
$t0 = microtime(true); $a = include 'test-incl-1.php'; $t1 = microtime(true); printf("include (%d): %d microsec\n", count($a), ($t1-$t0) * 1e6); $t0 = microtime(true); $a = apcu_fetch('a'); $t1 = microtime(true); printf("apcu_fetch (%d): %d microsec\n", count($a), ($t1-$t0) * 1e6); //include (10000): 1 microsec //apcu_fetch (10000): 792 microsec It is very easy to check whether this optimization has been applied, if you look at the generated opcodes:
$ cat immutable.php <?php return [ 'key1' => 'val1', 'key2' => 'val2', 'key3' => 'val3', ]; $ cat mutable.php <?php return [ 'key1' => \SomeClass::CONST_1, 'key2' => 'val2', 'key3' => 'val3', ]; $ php -d opcache.enable=1 -d opcache.enable_cli=1 -d opcache.opt_debug_level=0x20000 immutable.php $_main: ; (lines=1, args=0, vars=0, tmps=0) ; (after optimizer) ; /home/ubuntu/immutable.php:1-8 L0 (4): RETURN array(...) $ php -d opcache.enable_cli=1 -d opcache.opt_debug_level=0x20000 mutable.php $_main: ; (lines=5, args=0, vars=0, tmps=2) ; (after optimizer) ; /home/ubuntu/mutable.php:1-8 L0 (4): T1 = FETCH_CLASS_CONSTANT string("SomeClass") string("CONST_1") L1 (4): T0 = INIT_ARRAY 3 T1 string("key1") L2 (5): T0 = ADD_ARRAY_ELEMENT string("val2") string("key2") L3 (6): T0 = ADD_ARRAY_ELEMENT string("val3") string("key3") L4 (6): RETURN T0 In the first case, it is clear that there is a single opcode in the file — the return of the finished array. In the second case, it is formed by element-by-element every time the file is executed.
Thus, it is possible to generate structures in the form that does not require further conversion in runtime. For example, instead of disassembling the class names by the “_” and “\” signs each time for an autoload, you can pre-generate the “Class => Path” correspondence map. In this case, the conversion function will be reduced to a single reference to the hash table. Composer does this optimization if you enable the optimize-autoloader option .
For the invalidation of such data, you do not need to do anything specifically - PHP itself recompiles the file when it is modified in the same way as it is done with the usual code deployment. The only drawback that you need to remember is that if the file is very large, then the first request after changing it will cause a recompilation, which can take considerable time.
Performance include / require
Unlike the example with a static array, the connection of files with declarations of classes and functions is not so fast. Despite the availability of OPCache, the PHP engine must copy them into the process memory, recursively connecting dependencies, which may take hundreds of microseconds or even milliseconds per file.
If you create a new empty project on Symfony 4.1 and put get_included_files () in the first line of the action, you can see that 310 files are already connected. In a real project, this number can reach thousands per request. It is worth paying attention to the following things.
Lack of autoloading functions
There is a Function Autoloading RFC , but no development has been seen for several years. Therefore, if the dependency in Composer defines functions outside the class and these functions must be accessible to the user, this is done by necessarily connecting the file with these functions to each initialization of the autoloader.
For example, removing one of the dependencies from composer.json, which declares many functions and is easily replaced by a hundred lines of code, we won a couple of percent of the CPU.
Autoloader is called more often than it might seem
To demonstrate the idea, create such a file with a class:
<?php class A extends B implements C { use D; const AC1 = \E::E1; const AC2 = \F::F1; private static $as3 = \G::G1; private static $as4 = \H::H1; private $a5 = \I::I1; private $a6 = \J::J1; public function __construct(\K $k = null) {} public static function asf1(\L $l = null) :? LR { return null; } public static function asf2(\M $m = null) :? MR { return null; } public function af3(\N $n = null) :? NR { return null; } public function af4(\P $p = null) :? PR { return null; } } Register autoloader:
spl_autoload_register(function ($name) { echo "Including $name...\n"; include "$name.php"; }); And we will make several options for using this class:
include 'A.php' Including B... Including D... Including C... \A::AC1 Including A... Including B... Including D... Including C... Including E... new A() Including A... Including B... Including D... Including C... Including E... Including F... Including G... Including H... Including I... Including J... You may notice that when we simply somehow connect the class, but do not create its instance, the parent, interfaces, and traits will be connected. This is done recursively for all files that are connected as they are resolved.
When creating an instance, a rezolv of all constants and fields is added to this, which leads to the connection of all the necessary files for this, which, in turn, will also cause a recursive connection of the traits, parents and interfaces of the newly connected classes.

Connection of related classes for instantiation process and other cases
There is no universal solution to this problem, you just need to keep it in mind and follow the links between the classes: one line can pull on the connection of hundreds of files.
OPCache settings
If you use the atomic deployment method using the symlink change proposed by Rasmus Lerdorf, the creator of PHP, then to solve the symlink sticking problem on the old version, you have to enable opcache.revalidate_path, as recommended in, for example, this article about OPCache translated by Mail .Ru Group.
The problem is that this option significantly (on average one and a half to two times) increases the time to include each file. In total, this can consume a significant amount of resources (in our case, turning off this option yielded a gain of 7–9%).
To disable it, you need to do two things:
- make the web server rezolvit simlinki;
- stop connecting files inside a PHP script along paths that contain symlinks, or force them to be resolved via readlink () or realpath ().
If all files are connected by the Composer autoloader, the second item will be executed automatically after the first one is executed: omposer uses the constant __DIR__, which will be split correctly.
OPCache has a few more options that can give a performance boost in exchange for flexibility. Read more about this in the article I mentioned above.
Despite all these optimizations, include will not be free anyway. To combat this, preload is planned for PHP 7.4.
APCu lock
Although we are not talking about databases and services here, various kinds of locks can also occur in the code, which increase the execution time of the script.
As requests grew, we noticed a sharp slowdown in response at peak times. After finding out the reasons, it turned out that, although APCu is the fastest way to get data (compared to Memcache, Redis and other external repositories), it can also work slowly with frequent overwriting of identical keys.
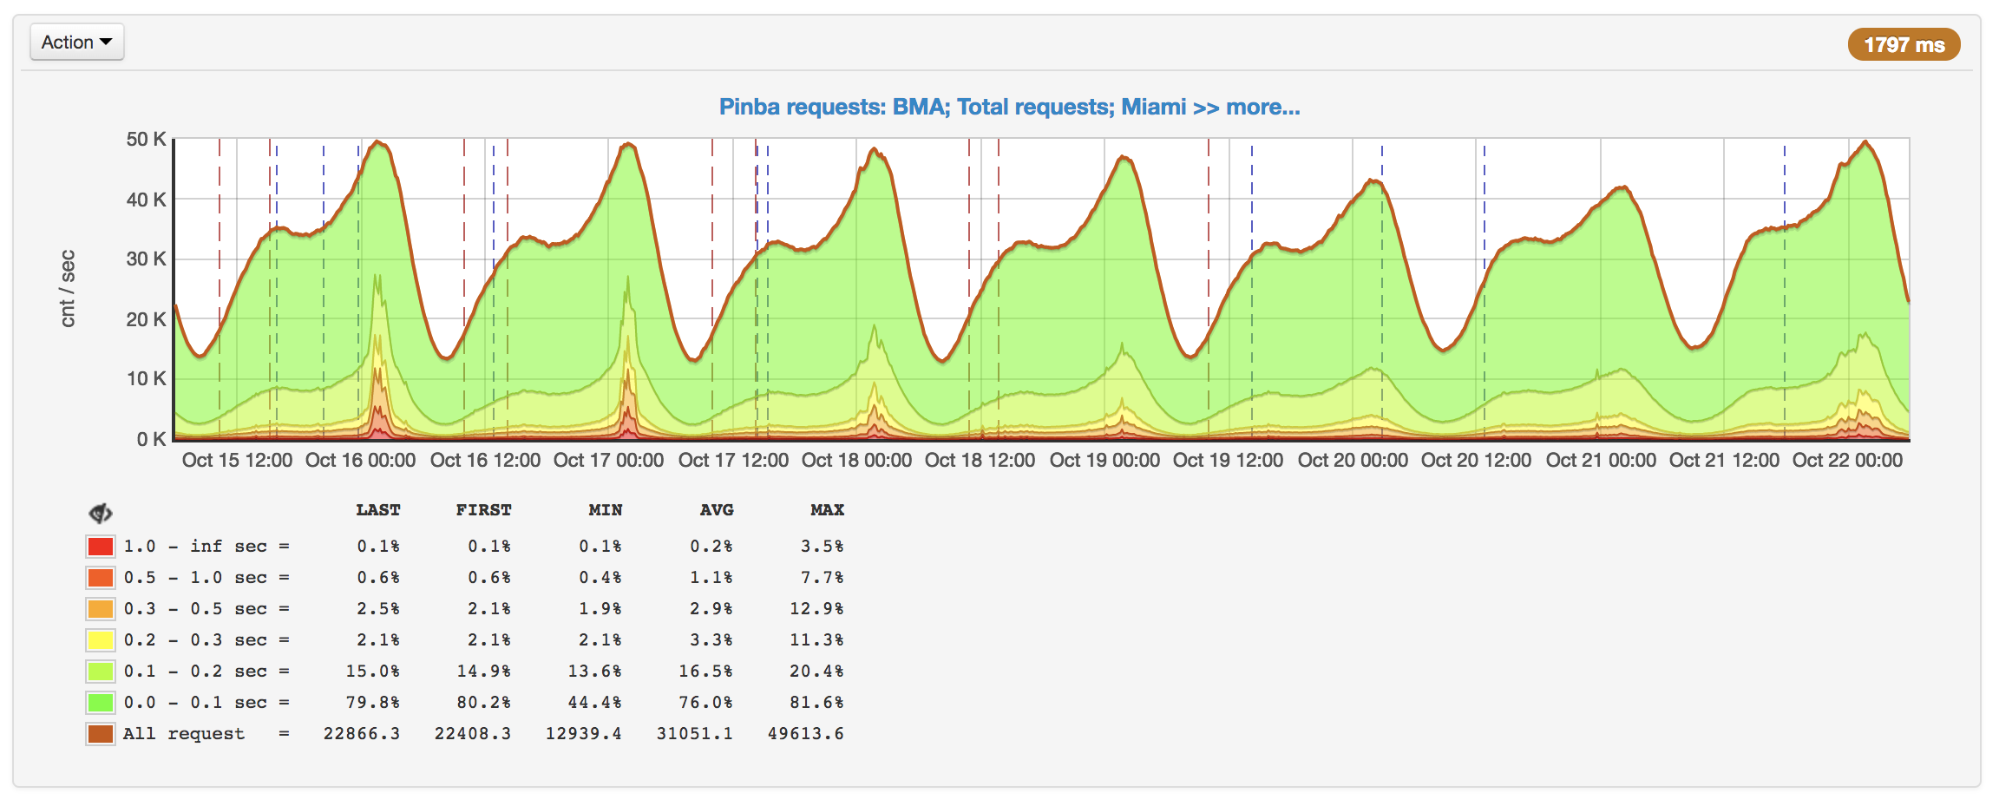
Requests per second and execution time: bursts at the peaks on October 16 and 17
When using APCu as a cache, this problem is not so urgent, because caching usually means rare writing and frequent reading. But some tasks and algorithms (for example, Circuit Breaker ( implementation in PHP )) also imply frequent writing, which causes locks.
There is no universal solution to this problem, but in the case of Circuit Breaker, it can be solved, for example, by putting it into a separate service delivered to machines with PHP.
Batch processing
Even if you do not take into account the include, usually still a significant part of the query execution time is spent on the initial initialization: the framework (for example, building a DI container and initializing all its dependencies, routing, executing all listeners), raising the session, User and so Further.
If your backend is an internal API for something, then surely some requests on clients can be bundled together and sent as a single request. In this case, initialization will be performed once for several requests.
, , . - , . .
Badoo , . PHP-FPM, CPU, , , : IO, CPU .
PHP-FPM — , PHP.
(CPU, IO), . , , , , - , . , . , , .
Conclusion
. PHP .
:
- ;
- ;
- - , : , ;
- : (, , );
- : ;
- , OPCache PHP, , , ;
- : (, , PHP 7.2 , );
- : , .
?
Thanks for attention!
Source: https://habr.com/ru/post/430722/
All Articles