How scoring works in the car sharing industry. Part 1. Overview of popular tools on real data
Carsharing, despite its youth, is one of the most actively developing areas in the Russian auto business. 5 years have passed since the launch of the first company, and today more than 25 operators specializing in short-term leases are working on the market. With the development of car sharing, user data is accumulated, and now car sharing, like banks, has a certain client scoring system. It also relies on age, gender, driving experience, but it’s not the history of your credits that is considered here, but the history of trips. One of the objectives of such scoring, in addition to solvency, validation of a driver's license, fines, is to predict the likelihood of an accident for a particular driver.
In this article we will examine the logic of the scoring algorithms of car sharing users, who will rely only on age and driving style. In addition to these parameters, and for obtaining more accurate results, social status, trips with children, activity in social networks and information from the camera inside the car can be used. However, today we will focus on two basic ones - age and driving style.
')
Note that in the article we will demonstrate the logic of scoring using the example of driving activity of 50,000 users and 260,000 trips. All data has been anonymized. In addition, we used data on 220 road accidents committed with Moscow and Moscow Region.
In car sharing, a car is a means of generating profit, and bought with credit money. With this approach, it is important to use it as efficiently as possible, avoiding downtime. And if the car got into an accident, then the paperwork with the insurer, coordination, ordering parts and repair itself can take considerable time, from several days to months. Scoring can predictively uncover potential accidents, and based on this, customers can be given feedback on the risks of unsafe driving.
For car sharing operators, it is important to save their property and make money on it. Thus, carshoring platform is simply obliged to collect all possible information about the car and what is happening with it. For each trip, a car sharing vehicle collects telematic data — trip points with an interval of no more than 1 second and vehicle readings at these points (speed, revolutions, accelerations, door and window statuses, etc.).
When making a contract with a car sharing operator, the driver must indicate his age and driving experience. Based on this data, we can build the following histogram.
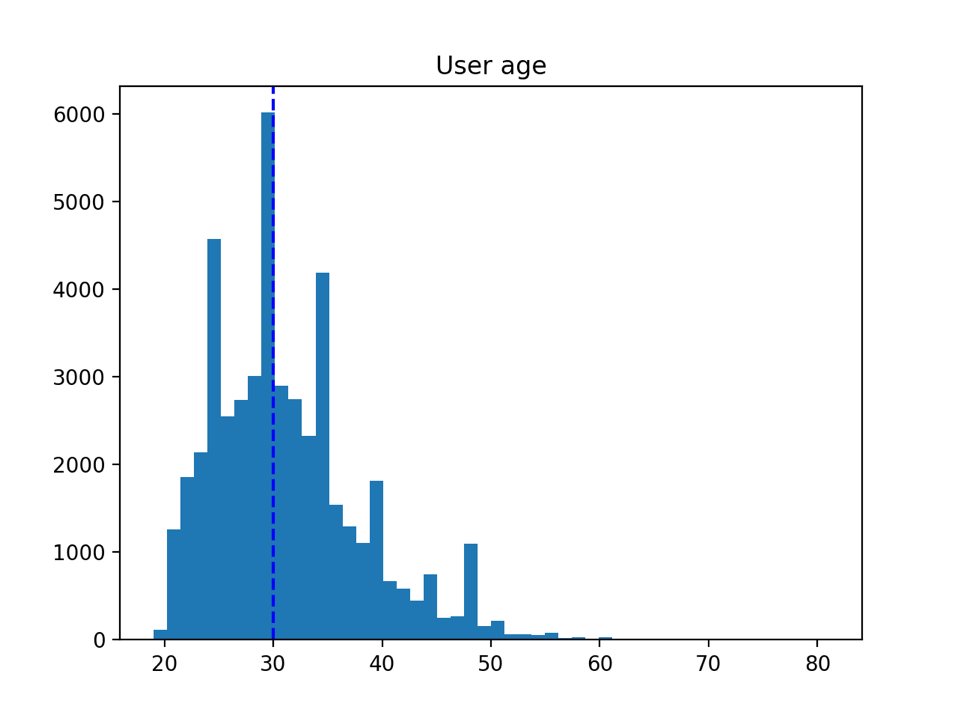
Figure 1. User age
Figure 1 shows a histogram of car sharing users' ages. On the horizontal axis - the age of users, on the vertical - their number, the dotted line indicates the median - 30 years. It looks like a normal distribution and pronounced bursts of the number of users aged 25, 30 and 35 years.
Then we consider the age distribution of users identified by the perpetrators of accidents.
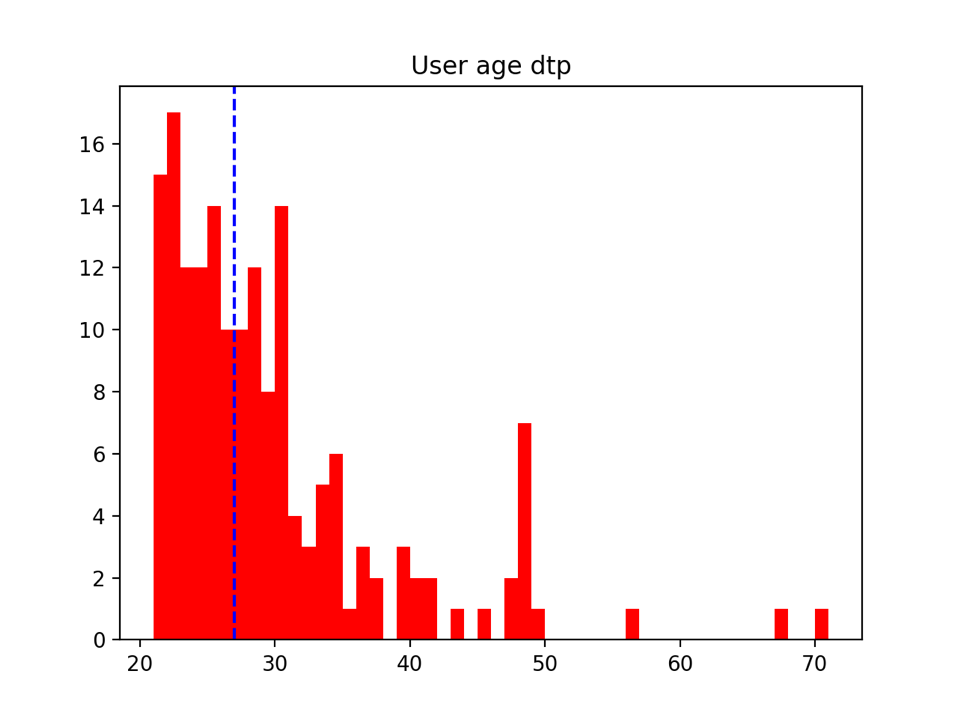
Figure 2. The age of users with an accident
Figure 2 shows a histogram of the distribution of ages of users guilty of accidents, horizontally - the age of users, vertically - the number of users. Again, the dashed line marks the median - 26 years. Thus it is clear that users younger than 26 years more often than others are the perpetrators of accidents.
According to the histogram, it is clear that half of the accidents occurred due to the fault of the group making up a quarter of users (users under 26 years old). Similarly, a group of users older than 30, constituting half of the total, generated only a quarter of the accident.
Thus, we find that the probability of an accident among users under the age of 26 is four times higher than that of users older than 30. That draws additional attention to a younger group of users from carsharing operators. It is no coincidence that for many operators age requirements do not begin at age 18, but at age 21. Carsharingi also want to see experienced drivers among their users and indicate the experience of 2 years, thereby dismissing inexperienced young drivers.
Driving style is more complicated. At the moment, the industry has an established model for determining the driving style - a model for counting sudden accelerations and decelerations. Consider it in more detail.
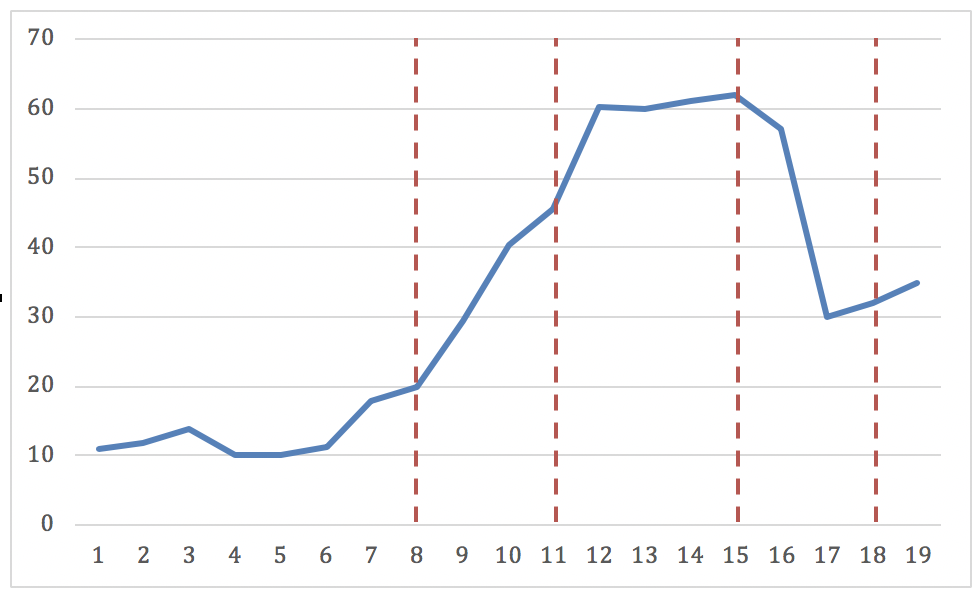
Figure 3. Graph of changes in vehicle speed.
If the vehicle speed for the time interval ∆t≤3sec. increases by ∆s≥15 km / h, then in this time interval the car accelerates sharply. Similarly, if during the time interval ∆t≤3 sec. The vehicle speed decreases by ∆s≥15 km / h, then in this time interval the car slows down dramatically. ∆t and ∆s are model parameters and can be changed both upwards and downwards. For example, graph 3 shows the dependence of vehicle speed on time, and in the interval from the 8th to the 11th second the speed of the car increased dramatically from 20km / h to 40km / h, and in the interval from the 15th to the 18th second, the speed dropped sharply from 60km / h to 30km / h
A - the number of sharp accelerations on the route, B - the number of sudden braking. Figure 4 shows the distribution of the sum A + B on the selected route selection.
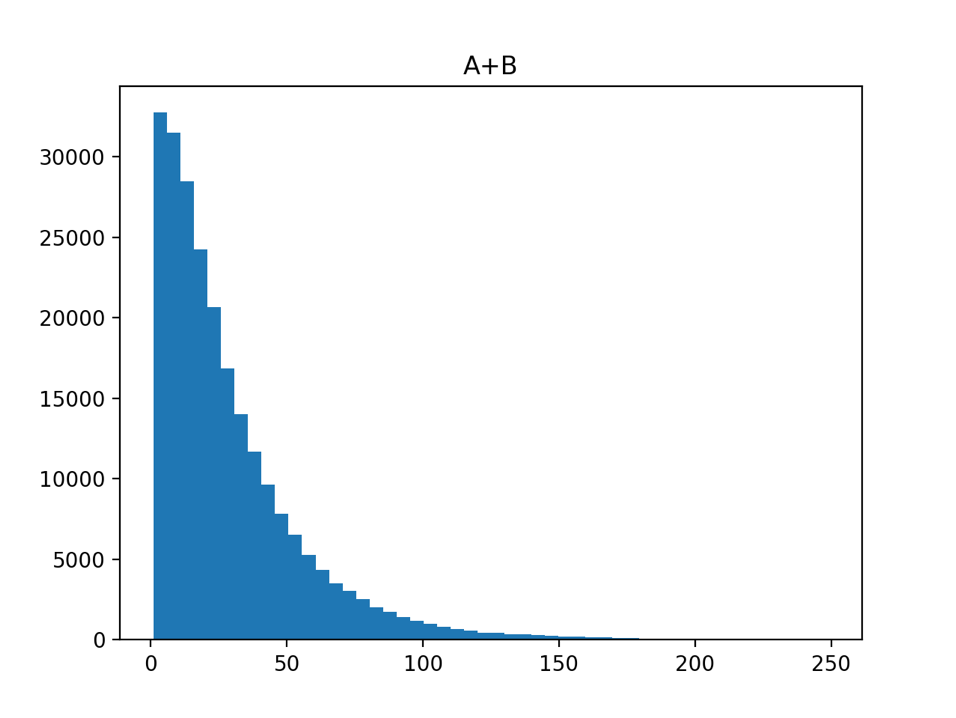
Figure 4. Distribution of sudden accelerations and decelerations.
Note that the trip can last 15 minutes, and maybe 5 hours, thus, you need to take into account the time or distance of the trip when choosing scoring parameters. D - the length of the route in kilometers. Let us calculate the number of sharp accelerations and decelerations per 1 km of the route, i.e. ((A + B)) / D. We obtain the asymmetric distribution shown in the histogram of Figure 5, where the values on the left are damped much faster than on the right. Unfortunately, most statistical methods do not work for strongly skewed distributions. In such cases, a logarithmic transformation usually helps, which often transforms asymmetry into symmetry, because it allows you to stretch the scale in the neighborhood of zero.

Figure 5. Distribution of accelerations and decelerations per 1 km of route
Calibrating this function, we get Log (((A + B)) / D). As a result, the distribution is very similar to the normal one - Figure 6.

Figure 6. The logarithm of the number of accelerations and decelerations for 1km trip
It is on the basis of this function that a scoring model of driving style is usually built. Let's try to drive through all the routes of each user through a similar function. In the histogram Figure 7.
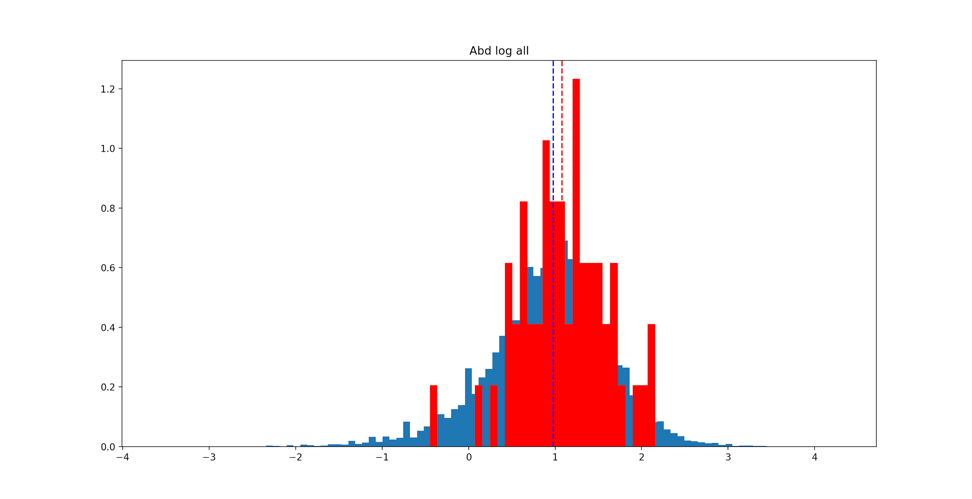
Figure 7. Comparison of users with and without accident
On it, the results of all users are marked in blue, while the blue dotted line is their median, the red one is the result of users with accidents, and the red dotted line is their median. It can be seen that the results of users with an accident are shifted to the right, i.e. users with accidents often dramatically slow down and accelerate in the process of movement. However, the displacement is extremely small and, in fact, there is no correlation between this value of the function and the fact of getting into an accident. Averages of users are considered, but the option is possible when users drive on average safely, but periodically go astray. Consider trips without an accident with the maximum value of the function Log (((A + B)) / D) for each user. It turns out the histogram Figure 8, where the median is marked with a dotted line.
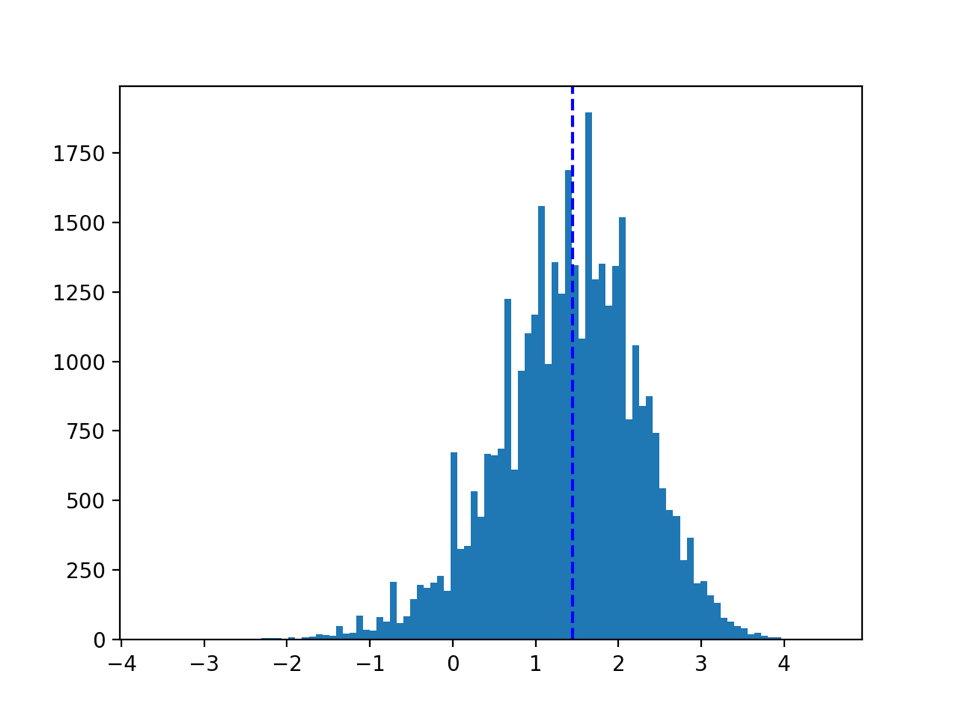
Figure 8. Worst user travel
Add a histogram of trips of users with an accident, and also we will not take into account their trips in which the accident occurred. The resulting histograms are shown in Figure 9, where the blue dotted line is the median of trips of users without an accident, the orange dotted line is the median of trips of users with an accident. There is a greater shift to the right. Those. users with an accident in this review are allocated from the general group.
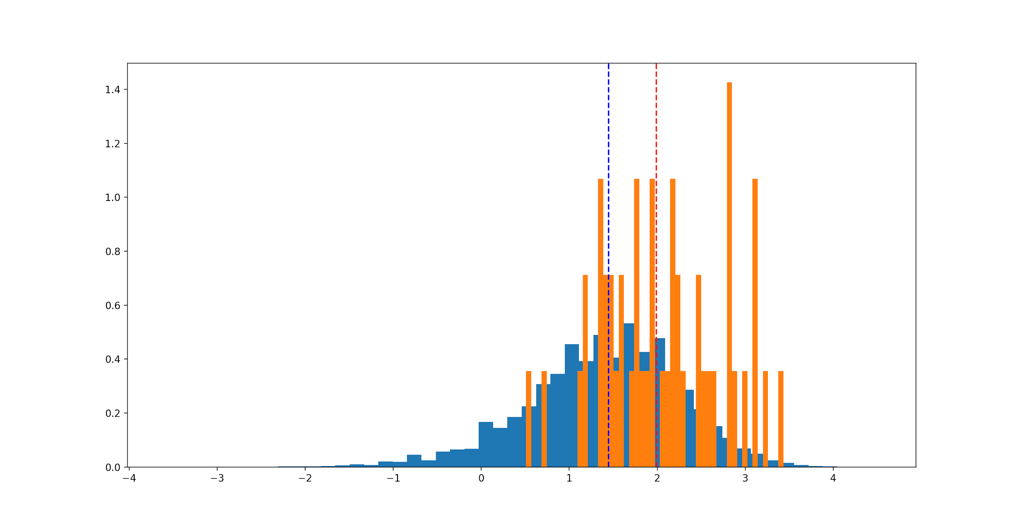
Figure 9. Comparison of the worst user trips.
Based on this method, we build a scoring model. The results of the model are displayed in Figure 10. Blue highlights the results of all users, orange - the results of users with an accident. It is fast from 0 to 10, where 0 is the worst result and 10 is the best. Dashed lines mark the median rate of two user groups. At the same time, the average speed of users with crashes is about 4, and all users are 5. 80% of users with traffic accidents have a speed below average, in other words, 80% of users with traffic accidents are worse than average.
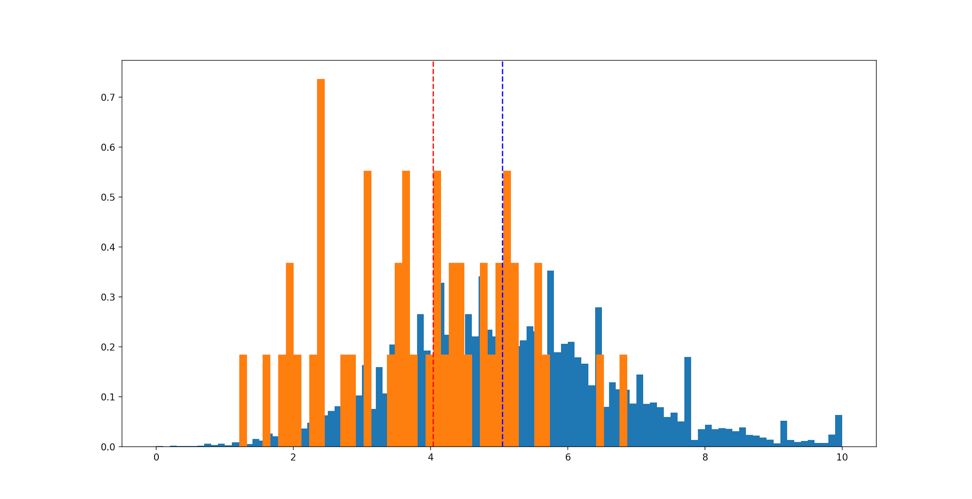
Figure 10. Scoring results
Such a model is usually used when calculating driving scoring using telematic data. Based on its results, access to premium cars or to the service in general may be limited. However, it is not the only and most optimal for all cases.
The model described in the article is not perfect for predicting an accident. In this article, we only reviewed the current models in car sharing. In the next part we will talk about the model of the energy of motion, which is based on the driving style (style of changing speed, maneuvering, etc.).
Author: Kirill Kulchenkov, kulchenkov32 , business consultant, Bright Box.
In this article we will examine the logic of the scoring algorithms of car sharing users, who will rely only on age and driving style. In addition to these parameters, and for obtaining more accurate results, social status, trips with children, activity in social networks and information from the camera inside the car can be used. However, today we will focus on two basic ones - age and driving style.
')
Note that in the article we will demonstrate the logic of scoring using the example of driving activity of 50,000 users and 260,000 trips. All data has been anonymized. In addition, we used data on 220 road accidents committed with Moscow and Moscow Region.
In car sharing, a car is a means of generating profit, and bought with credit money. With this approach, it is important to use it as efficiently as possible, avoiding downtime. And if the car got into an accident, then the paperwork with the insurer, coordination, ordering parts and repair itself can take considerable time, from several days to months. Scoring can predictively uncover potential accidents, and based on this, customers can be given feedback on the risks of unsafe driving.
For car sharing operators, it is important to save their property and make money on it. Thus, carshoring platform is simply obliged to collect all possible information about the car and what is happening with it. For each trip, a car sharing vehicle collects telematic data — trip points with an interval of no more than 1 second and vehicle readings at these points (speed, revolutions, accelerations, door and window statuses, etc.).
Age
When making a contract with a car sharing operator, the driver must indicate his age and driving experience. Based on this data, we can build the following histogram.
Figure 1. User age
Figure 1 shows a histogram of car sharing users' ages. On the horizontal axis - the age of users, on the vertical - their number, the dotted line indicates the median - 30 years. It looks like a normal distribution and pronounced bursts of the number of users aged 25, 30 and 35 years.
Then we consider the age distribution of users identified by the perpetrators of accidents.
Figure 2. The age of users with an accident
Figure 2 shows a histogram of the distribution of ages of users guilty of accidents, horizontally - the age of users, vertically - the number of users. Again, the dashed line marks the median - 26 years. Thus it is clear that users younger than 26 years more often than others are the perpetrators of accidents.
According to the histogram, it is clear that half of the accidents occurred due to the fault of the group making up a quarter of users (users under 26 years old). Similarly, a group of users older than 30, constituting half of the total, generated only a quarter of the accident.
Thus, we find that the probability of an accident among users under the age of 26 is four times higher than that of users older than 30. That draws additional attention to a younger group of users from carsharing operators. It is no coincidence that for many operators age requirements do not begin at age 18, but at age 21. Carsharingi also want to see experienced drivers among their users and indicate the experience of 2 years, thereby dismissing inexperienced young drivers.
Driving style
Driving style is more complicated. At the moment, the industry has an established model for determining the driving style - a model for counting sudden accelerations and decelerations. Consider it in more detail.
Figure 3. Graph of changes in vehicle speed.
If the vehicle speed for the time interval ∆t≤3sec. increases by ∆s≥15 km / h, then in this time interval the car accelerates sharply. Similarly, if during the time interval ∆t≤3 sec. The vehicle speed decreases by ∆s≥15 km / h, then in this time interval the car slows down dramatically. ∆t and ∆s are model parameters and can be changed both upwards and downwards. For example, graph 3 shows the dependence of vehicle speed on time, and in the interval from the 8th to the 11th second the speed of the car increased dramatically from 20km / h to 40km / h, and in the interval from the 15th to the 18th second, the speed dropped sharply from 60km / h to 30km / h
A - the number of sharp accelerations on the route, B - the number of sudden braking. Figure 4 shows the distribution of the sum A + B on the selected route selection.
Figure 4. Distribution of sudden accelerations and decelerations.
Note that the trip can last 15 minutes, and maybe 5 hours, thus, you need to take into account the time or distance of the trip when choosing scoring parameters. D - the length of the route in kilometers. Let us calculate the number of sharp accelerations and decelerations per 1 km of the route, i.e. ((A + B)) / D. We obtain the asymmetric distribution shown in the histogram of Figure 5, where the values on the left are damped much faster than on the right. Unfortunately, most statistical methods do not work for strongly skewed distributions. In such cases, a logarithmic transformation usually helps, which often transforms asymmetry into symmetry, because it allows you to stretch the scale in the neighborhood of zero.
Figure 5. Distribution of accelerations and decelerations per 1 km of route
Calibrating this function, we get Log (((A + B)) / D). As a result, the distribution is very similar to the normal one - Figure 6.
Figure 6. The logarithm of the number of accelerations and decelerations for 1km trip
It is on the basis of this function that a scoring model of driving style is usually built. Let's try to drive through all the routes of each user through a similar function. In the histogram Figure 7.
Figure 7. Comparison of users with and without accident
On it, the results of all users are marked in blue, while the blue dotted line is their median, the red one is the result of users with accidents, and the red dotted line is their median. It can be seen that the results of users with an accident are shifted to the right, i.e. users with accidents often dramatically slow down and accelerate in the process of movement. However, the displacement is extremely small and, in fact, there is no correlation between this value of the function and the fact of getting into an accident. Averages of users are considered, but the option is possible when users drive on average safely, but periodically go astray. Consider trips without an accident with the maximum value of the function Log (((A + B)) / D) for each user. It turns out the histogram Figure 8, where the median is marked with a dotted line.
Figure 8. Worst user travel
Add a histogram of trips of users with an accident, and also we will not take into account their trips in which the accident occurred. The resulting histograms are shown in Figure 9, where the blue dotted line is the median of trips of users without an accident, the orange dotted line is the median of trips of users with an accident. There is a greater shift to the right. Those. users with an accident in this review are allocated from the general group.
Figure 9. Comparison of the worst user trips.
Based on this method, we build a scoring model. The results of the model are displayed in Figure 10. Blue highlights the results of all users, orange - the results of users with an accident. It is fast from 0 to 10, where 0 is the worst result and 10 is the best. Dashed lines mark the median rate of two user groups. At the same time, the average speed of users with crashes is about 4, and all users are 5. 80% of users with traffic accidents have a speed below average, in other words, 80% of users with traffic accidents are worse than average.
Figure 10. Scoring results
Such a model is usually used when calculating driving scoring using telematic data. Based on its results, access to premium cars or to the service in general may be limited. However, it is not the only and most optimal for all cases.
The model described in the article is not perfect for predicting an accident. In this article, we only reviewed the current models in car sharing. In the next part we will talk about the model of the energy of motion, which is based on the driving style (style of changing speed, maneuvering, etc.).
Author: Kirill Kulchenkov, kulchenkov32 , business consultant, Bright Box.
Source: https://habr.com/ru/post/430558/
All Articles