Load testing with locust
Load testing is not so much in demand and widespread, as other types of testing - tools that allow such testing to take place, are not so many but can be easily and easily counted on the fingers of one hand.
When it comes to performance testing - first of all everyone thinks about JMeter, it undoubtedly remains the most famous tool with the largest number of plug-ins. I never liked JMeter because of the non-obvious interface and high threshold of entry, as soon as the need arises to test a non-Hello World application.
Inspired by the success of testing in two different projects, I decided to share information about a relatively simple and convenient software - Locust
')
For those who are too lazy to go under the cat, recorded a video:
An open source tool that allows you to specify load scripts for Python code that supports distributed load and, as the authors claim, was used for load testing Battlelog for the Battlefild series of games (immediately appealing)
Of the benefits:
Of the minuses:
Any testing is a complex task that requires planning, preparation, control of performance and analysis of results. With load testing, if possible, it is possible and necessary to collect all possible data that may affect the result:
The following examples can be classified as black-box functional load testing. Even without knowing anything about the application under test and not accessing the logs, we can measure its performance.
In order to test load tests in practice, I deployed a locally simple web server https://github.com/typicode/json-server . Almost all of the following examples I will give for him. I took the data for the server from a deployed online example - https://jsonplaceholder.typicode.com/
To run it requires a nodeJS.
The obvious spoiler : just like with security testing - it is better to perform load testing experiments on cats locally, without loading online services so that you will not be banned
In order to get started, you also need Python - in all examples I will use version 3.6, as well as locust itself (at the time of writing this article, version 0.9.0). It can be installed with the command
Details of the installation can be found in the official documentation.
Next we need a test file. I took an example from the documentation, as it is very simple and straightforward:
Everything! This is really enough to start the test! Let's take an example before moving on to launch.
Skipping imports, at the very beginning we see 2 almost identical functions of login and logout, consisting of one line. l.client is an HTTP session object with which we will create the load. We use the POST method, which is almost identical to the same in the requests library. Almost - because in this example, we pass as the first argument not the full URL, but only a part of it - a specific service.
The second argument passes the data - and I can not help but notice that it is very convenient to use Python dictionaries, which are automatically converted into json
You can also note that we do not process the result of the request in any way - if it is successful, the results (for example, cookies) will be saved in this session. If an error occurs, it will be recorded and added to the load statistics.
If we want to know whether we wrote the request correctly, we can always check it as follows:
I added only the base_url variable, which should contain the full address of the resource under test.
The next few functions are requests for which the load will be created. Again, we do not need to process the server response - the results will go immediately to the statistics.
Next is the UserBehavior class (the class name can be any). As the name implies, it will describe the behavior of the spherical user in a vacuum of the application under test. The tasks property is passed to the dictionary of methods that the user will call and their call frequency. Now, despite the fact that we do not know what function and in which order each user will call - they are chosen randomly, we guarantee that the index function will be called on average 2 times more often than the profile function.
In addition to behavior, the parent TaskSet class allows you to set 4 functions that can be performed before and after tests. The order of calls will be as follows:
Here it is worth mentioning that there are 2 ways to declare user behavior: the first is already indicated in the example above - the functions are declared in advance. The second way is to declare methods right inside the UserBehavior class:
In this example, user functions and the frequency of their calling is set using task annotation. Functionally, nothing has changed.
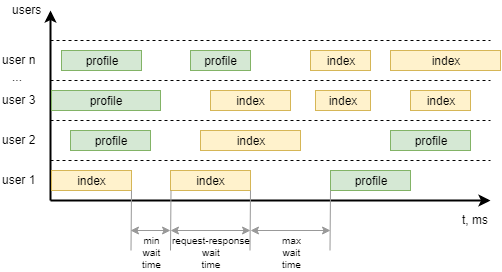
The last class from the example is WebsiteUser (the class name can be any). In this class, we define the model of user Behavior *** + user behaviors, as well as the minimum and maximum waiting times between individual tasks for each task to be called by individual users. To make it clearer, here's how to visualize it:
Run the server, the performance of which we will test:
We also modify the sample file so that it can test the service, remove the login and logout, set the user behavior:
To run the command line need to run the command
where host is the address of the tested resource. It will be added to it the addresses of the services specified in the test.
If there are no errors in the test, the load server will start and be available at http: // localhost: 8089 /
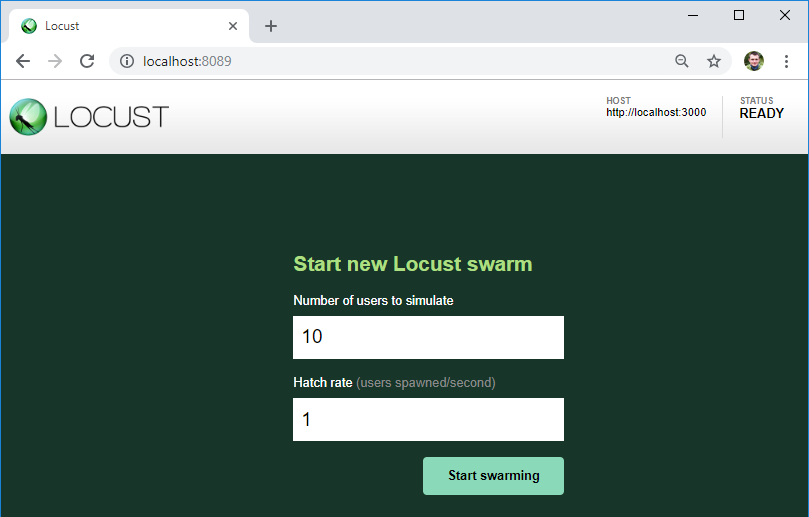
As you can see, here is the server that we will test - it is to this URL that the addresses of the services from the test file will be added.
Also here we can specify the number of users for the load and their increase per second.
By the button we start the load!
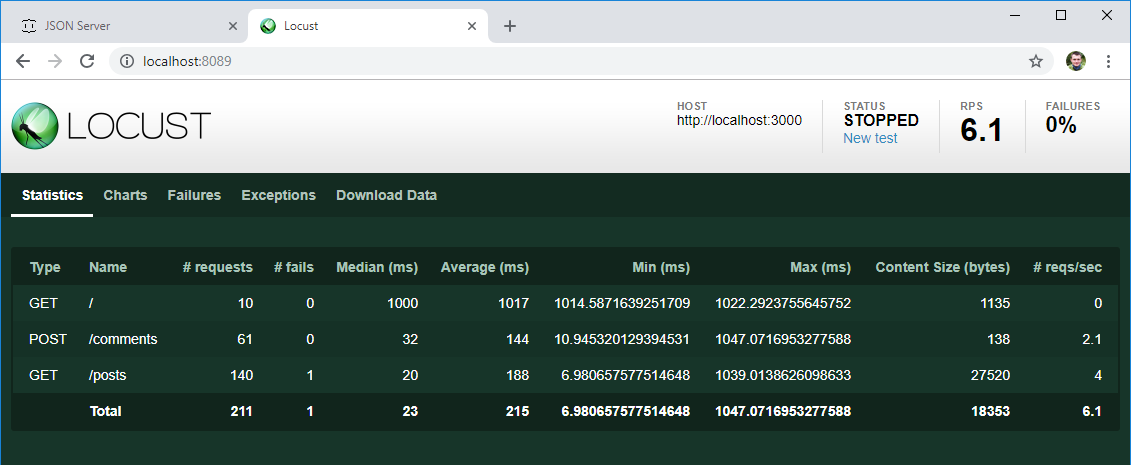
After a certain time, stop the test and take a look at the first results:
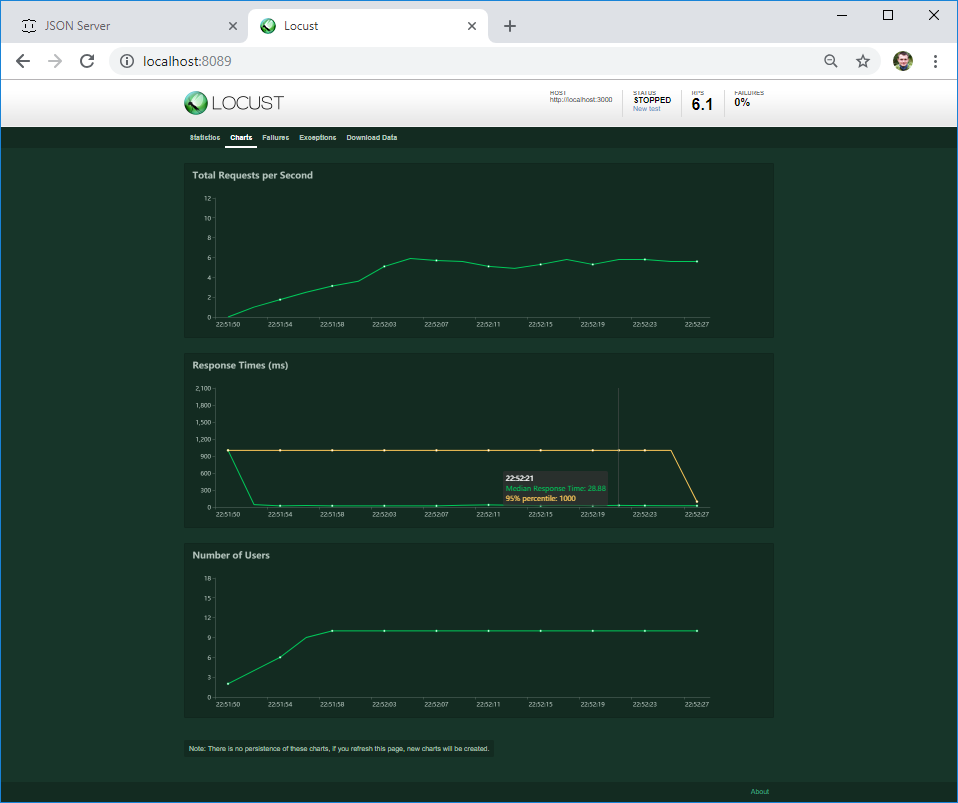
On the second tab, you can see the load graphs in real time. If the server crashes at a certain load or its behavior changes, it will be immediately visible on the graph.
On the third tab, you can see the error - in my case it is a client error. But if the server returns 4XX or 5XX an error - its text will be written here
If the error happens in the code of your text, it will go to the Exceptions tab. So far, I have the most frequent error associated with using the print () command in the code - this is not the best way to log in :)
On the last tab, you can download all test results in csv format.
Are these results relevant? Let's see. Most often, the performance requirements (if they are stated at all) sound like this: the average page load time (server response) should be less than N seconds with the load of M users. Not really specifying what users should do. And I like this locust - it creates an activity of a specific number of users who randomly perform the intended actions that they expect from users.
If we need to carry out a benchmark - measure the behavior of the system at different loads, we can create several classes of behavior and carry out several tests at different loads.
For starters, this is enough. If you liked the article, I soon plan to write about:
When it comes to performance testing - first of all everyone thinks about JMeter, it undoubtedly remains the most famous tool with the largest number of plug-ins. I never liked JMeter because of the non-obvious interface and high threshold of entry, as soon as the need arises to test a non-Hello World application.
Inspired by the success of testing in two different projects, I decided to share information about a relatively simple and convenient software - Locust
')
For those who are too lazy to go under the cat, recorded a video:
What is it?
An open source tool that allows you to specify load scripts for Python code that supports distributed load and, as the authors claim, was used for load testing Battlelog for the Battlefild series of games (immediately appealing)
Of the benefits:
- simple documentation, including copy-paste example. You can start to test, even almost not knowing how to program
- “Under the hood” uses the requests library (HTTP for people). Her documentation can be used as an extended cheat sheet and debug tests.
- Python support - I just like the language
- The previous paragraph gives cross-platform tests to run.
- Own web server on Flask to display test results
Of the minuses:
- No Capture & Replay - all by hand
- The result of the previous paragraph - you need a brain. As with the use of Postman, you need to understand how HTTP works.
- Looking for minimal programming skills
- Linear load model - which immediately upsets fans to generate users “according to Gauss”
Testing process
Any testing is a complex task that requires planning, preparation, control of performance and analysis of results. With load testing, if possible, it is possible and necessary to collect all possible data that may affect the result:
- Server hardware (CPU, RAM, ROM)
- Server software (OS, server versions, JAVA, .NET, etc., database and amount of data itself, server logs and application under test)
- Network bandwidth
- Availability of proxy servers, load balancers and DDOS protection
- Load testing data (number of users, average response time, number of requests per second)
The following examples can be classified as black-box functional load testing. Even without knowing anything about the application under test and not accessing the logs, we can measure its performance.
Before the start
In order to test load tests in practice, I deployed a locally simple web server https://github.com/typicode/json-server . Almost all of the following examples I will give for him. I took the data for the server from a deployed online example - https://jsonplaceholder.typicode.com/
To run it requires a nodeJS.
The obvious spoiler : just like with security testing - it is better to perform load testing experiments on cats locally, without loading online services so that you will not be banned
In order to get started, you also need Python - in all examples I will use version 3.6, as well as locust itself (at the time of writing this article, version 0.9.0). It can be installed with the command
python -m pip install locustio Details of the installation can be found in the official documentation.
Case study
Next we need a test file. I took an example from the documentation, as it is very simple and straightforward:
from locust import HttpLocust, TaskSet def login(l): l.client.post("/login", {"username":"ellen_key", "password":"education"}) def logout(l): l.client.post("/logout", {"username":"ellen_key", "password":"education"}) def index(l): l.client.get("/") def profile(l): l.client.get("/profile") class UserBehavior(TaskSet): tasks = {index: 2, profile: 1} def on_start(self): login(self) def on_stop(self): logout(self) class WebsiteUser(HttpLocust): task_set = UserBehavior min_wait = 5000 max_wait = 9000 Everything! This is really enough to start the test! Let's take an example before moving on to launch.
Skipping imports, at the very beginning we see 2 almost identical functions of login and logout, consisting of one line. l.client is an HTTP session object with which we will create the load. We use the POST method, which is almost identical to the same in the requests library. Almost - because in this example, we pass as the first argument not the full URL, but only a part of it - a specific service.
The second argument passes the data - and I can not help but notice that it is very convenient to use Python dictionaries, which are automatically converted into json
You can also note that we do not process the result of the request in any way - if it is successful, the results (for example, cookies) will be saved in this session. If an error occurs, it will be recorded and added to the load statistics.
If we want to know whether we wrote the request correctly, we can always check it as follows:
import requests as r response=r.post(base_url+"/login",{"username":"ellen_key","password":"education"}) print(response.status_code) I added only the base_url variable, which should contain the full address of the resource under test.
The next few functions are requests for which the load will be created. Again, we do not need to process the server response - the results will go immediately to the statistics.
Next is the UserBehavior class (the class name can be any). As the name implies, it will describe the behavior of the spherical user in a vacuum of the application under test. The tasks property is passed to the dictionary of methods that the user will call and their call frequency. Now, despite the fact that we do not know what function and in which order each user will call - they are chosen randomly, we guarantee that the index function will be called on average 2 times more often than the profile function.
In addition to behavior, the parent TaskSet class allows you to set 4 functions that can be performed before and after tests. The order of calls will be as follows:
- setup - invoked 1 time when starting UserBehavior (TaskSet) - it is not in the example
- on_start - is called 1 time by each new user of the load when starting work
- tasks - performing the tasks themselves
- on_stop - called once by each user when the test finishes
- teardown - called 1 time when TaskSet terminates - it is also not in the example
Here it is worth mentioning that there are 2 ways to declare user behavior: the first is already indicated in the example above - the functions are declared in advance. The second way is to declare methods right inside the UserBehavior class:
from locust import HttpLocust, TaskSet, task class UserBehavior(TaskSet): def on_start(self): self.client.post("/login", {"username":"ellen_key", "password":"education"}) def on_stop(self): self.client.post("/logout", {"username":"ellen_key", "password":"education"}) @task(2) def index(self): self.client.get("/") @task(1) def profile(self): self.client.get("/profile") class WebsiteUser(HttpLocust): task_set = UserBehavior min_wait = 5000 max_wait = 9000 In this example, user functions and the frequency of their calling is set using task annotation. Functionally, nothing has changed.
The last class from the example is WebsiteUser (the class name can be any). In this class, we define the model of user Behavior *** + user behaviors, as well as the minimum and maximum waiting times between individual tasks for each task to be called by individual users. To make it clearer, here's how to visualize it:
Beginning of work
Run the server, the performance of which we will test:
json-server --watch sample_server/db.json We also modify the sample file so that it can test the service, remove the login and logout, set the user behavior:
- To open the main page 1 time at the beginning of work.
- Get a list of all posts x2
- Write a comment on the first post x1
from locust import HttpLocust, TaskSet, task class UserBehavior(TaskSet): def on_start(self): self.client.get("/") @task(2) def posts(self): self.client.get("/posts") @task(1) def comment(self): data = { "postId": 1, "name": "my comment", "email": "test@user.habr", "body": "Author is cool. Some text. Hello world!" } self.client.post("/comments", data) class WebsiteUser(HttpLocust): task_set = UserBehavior min_wait = 1000 max_wait = 2000 To run the command line need to run the command
locust -f my_locust_file.py --host=http://localhost:3000 where host is the address of the tested resource. It will be added to it the addresses of the services specified in the test.
If there are no errors in the test, the load server will start and be available at http: // localhost: 8089 /
As you can see, here is the server that we will test - it is to this URL that the addresses of the services from the test file will be added.
Also here we can specify the number of users for the load and their increase per second.
By the button we start the load!
results
After a certain time, stop the test and take a look at the first results:
- As expected, each of the 10 users created at the start went to the main page
- The list of posts on average was opened 2 times more often than the comment was written
- There is an average and median response time for each operation, the number of operations per second is already useful data, even though now take it and compare it with the expected result from the requirements
On the second tab, you can see the load graphs in real time. If the server crashes at a certain load or its behavior changes, it will be immediately visible on the graph.
On the third tab, you can see the error - in my case it is a client error. But if the server returns 4XX or 5XX an error - its text will be written here
If the error happens in the code of your text, it will go to the Exceptions tab. So far, I have the most frequent error associated with using the print () command in the code - this is not the best way to log in :)
On the last tab, you can download all test results in csv format.
Are these results relevant? Let's see. Most often, the performance requirements (if they are stated at all) sound like this: the average page load time (server response) should be less than N seconds with the load of M users. Not really specifying what users should do. And I like this locust - it creates an activity of a specific number of users who randomly perform the intended actions that they expect from users.
If we need to carry out a benchmark - measure the behavior of the system at different loads, we can create several classes of behavior and carry out several tests at different loads.
For starters, this is enough. If you liked the article, I soon plan to write about:
- complex test scenarios in which the results of one step are used in the following
- processing server response, because it may be wrong even if HTTP 200 OK has arrived
- non-obvious difficulties that can be encountered and how to get around them
- testing without using UI
- distributed load testing
Source: https://habr.com/ru/post/430502/
All Articles