What gives retail machine learning: a project example
Retail has a very diverse range of buyers. There are a lot of them - all kinds of professions and income levels, from youth to pensioners. Such a variety cannot be correctly described by two or three business rules, because you simply cannot cover all combinations of criteria and inevitably lose some customers. Therefore, for retail it is very important to segment your audience as accurately as possible, but this inevitably complicates the model. Here Machine Learning technologies come to the rescue, giving businesses more accurate predictions and answers to important questions.
What questions are meant? For example: will the client leave? Often, customers leave if the store does not have the right product. For example, a woman buys a special cream every month for 10 thousand rubles and can choose from two cosmetics stores. In one of them the right product is often missing, and in the second there are no problems with availability. Most likely, it will constantly buy in the second, albeit a bit more expensive.
')
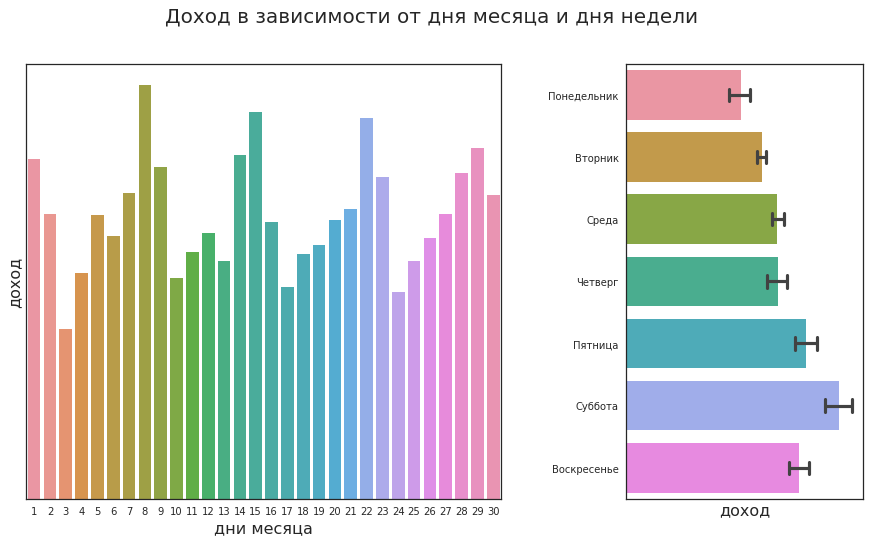
Another pressing question: how to optimize staff performance? For example, you need to plan shifts for cashiers and sales assistants. One way involves the use of statistical analysis. The analyst assesses the activity of clients depending on the day of the week and sees that on Saturday they buy the most, and on Friday and Sunday a little less. This hypothesis is tested by statistical tests, and the conclusions are passed on to management.
But such an analysis may not take into account many combinations of factors. For example, if it is Wednesday on March 7, will they buy more on this day than on Friday (after all, during normal times, Friday is a more popular day than other weekdays)? And graduation? Or local holidays? The more factors, the harder it is to take them all using simple rules. And instead of infinitely complicating the rules, you can build a model that predicts the demand for a particular day.
In this case, it was necessary to analyze the customer base (approximately 2.5 million people) and predict which of them will return to the store in the next two weeks. We took two methods of the CatBoost library - CatBoostClassifier and CatBoostRegressor, the first one - to predict the composition of the audience, the second - to select the most requested products in the next 2 weeks. CatBoost came out at the very beginning of our project; it was a fresh approach to working with categorical signs. And since the product range of our customer contains a lot of categorical features, we gladly tried the novelty in the work. After selecting the parameters, the model immediately met our expectations with accurate forecasting. No wonder CatBoost is one of the most popular gradient boosting models today.
For the model, we took statistics for 2017:
Cleared the data from the noise (vendor cards, returns, purchases of services, not goods) and considered the necessary criteria (discount percentage, age). After that, the largest and smallest check for each customer was calculated, the average, median and maximum discount, how many times a person came and how many products from which categories he bought. These parameters were recalculated at intervals: the last week, two weeks, a month, three months. Such scrupulous work allowed us to build models with high prediction accuracy.
Aggregated data for models and run calculations. The first model predicted which of the buyers would come in the next two weeks, and the second gave recommendations: what goods (up to the article level) a particular person would buy. By the way, the requirement to predict the popularity of specific articles made the task much more complicated (usually, business only has enough forecasts by category and name of goods, but not by positions).
Clients recommended by the model for targeted mailing had a larger median check for one visit, and for the analyzed period they bought in total for a larger amount than other clients.
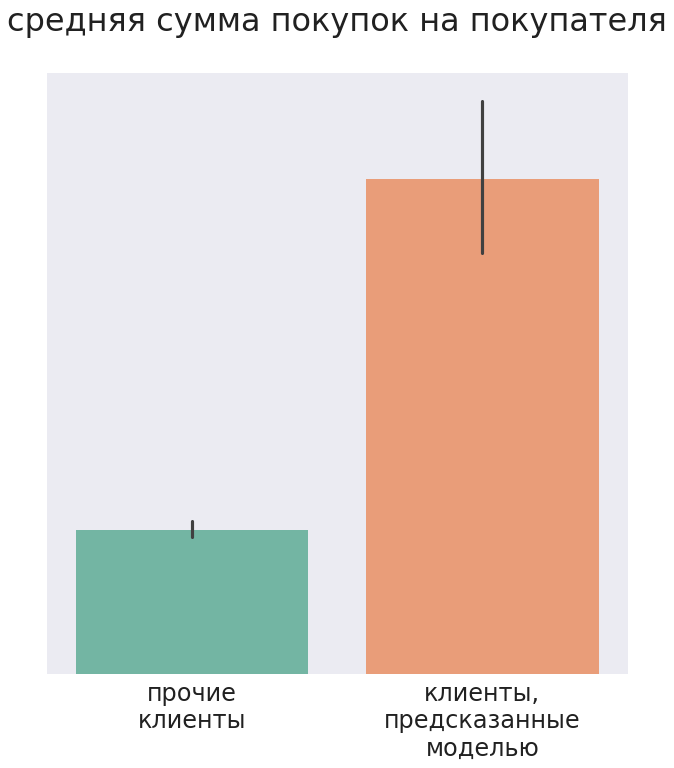
As a result, after mailing, about 30% of customers purchased at least one of the three products predicted by the model.
Now the company can more accurately forecast sales: the retailer knows who will come to him in the near future and what he will buy. This helps not only to optimize logistics, but also to reduce associated costs. For example, if a particular customer usually does not buy anything in winter, then you do not need to send him an SMS in January. The models also optimize newsletters: based on the forecast, the specialist immediately understands who to send the e-mail and who needs to send an urgent SMS.
They are in any ML-task - they were in ours. For example, we checked whether mailings with product recommendations help boost sales. For this, the predicted segment of buyers was divided into three groups:
It turned out that people who received recommendations bought less than customers who did not receive mailings. Less was the average check and the amount of goods purchased. The t-test showed that the differences were statistically significant (pvalue = 0.017).
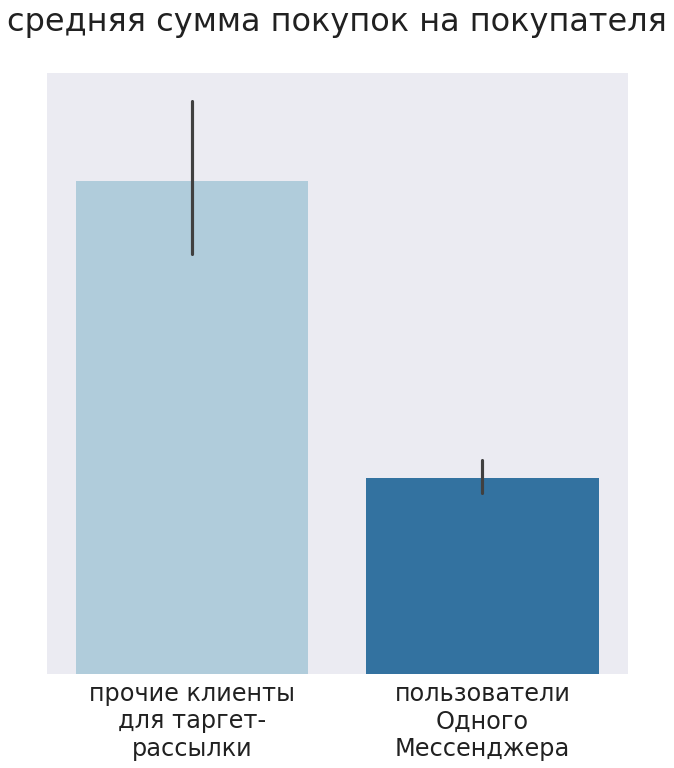
To put it mildly, such results were discouraged by all. They began to look for the cause and found out that the shops sent customers messages to a certain messenger, and its users in our segment initially bought less compared to other customers. Even the marketers of the customer did not know about it. So the experiment turned out to be incorrect, but according to its results, we added the parameter “user of the messenger” to the model. This case demonstrates how carefully you need to choose channels to communicate with customers.
What other conclusions can be drawn?
Data analysis reveals patterns that were hidden in previously available information. A good example is the comparison of customer groups using RFM segmentation (Recency Frequency Monetary) and segmentation using ML algorithms.
Three key indicators are used in RFM segmentation:
On the basis of these data, the main groups are distinguished: “squander”, “loyal customers”, “almost lost customers”, etc. And marketers are already including the desired target group in a specific newsletter or make an offer specifically for this group.
For example, using RFM segmentation, you can select customer segments and present them as points in three-dimensional space:
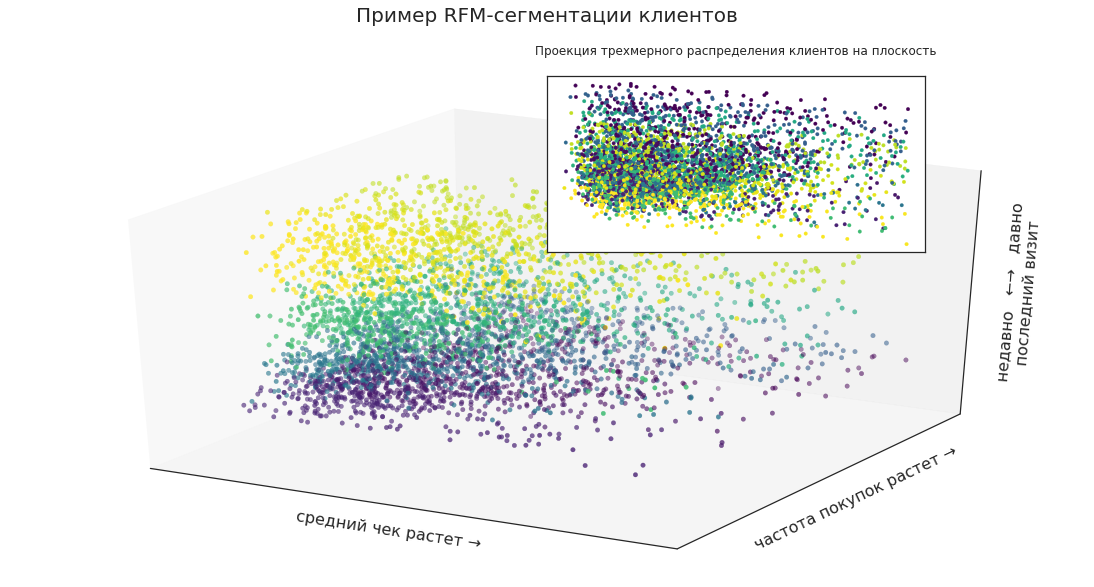
This allows you to visually see the location of certain groups in the total mass of customers, their proportions and the dynamics of changes.
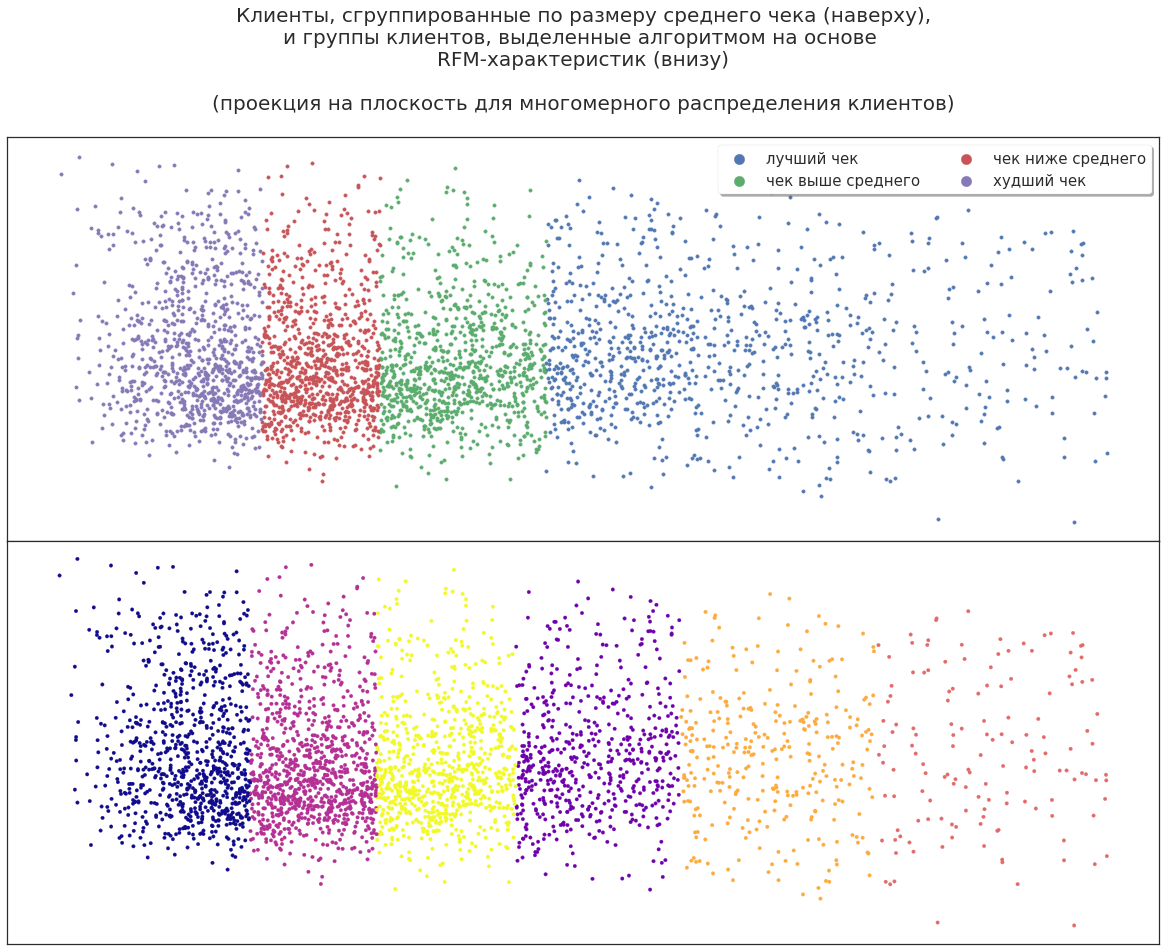
Now we project the three-dimensional distribution of the segments onto the plane. Customers can be divided by the company's revenue to include the most profitable in marketing campaigns, but will this be enough for effective planning?
Even in such data, the machine learning algorithm finds additional possibilities: it breaks up customers into new large groups. You can analyze this partition to find out why the algorithm divided clients exactly in this way. For example, some high-yield customers are experts who accompany their customers in shopping and use their discount cards; Some actively share their cards with friends and acquaintances. That is, after the first ML application, you can get additional information about your clients based on the same data.
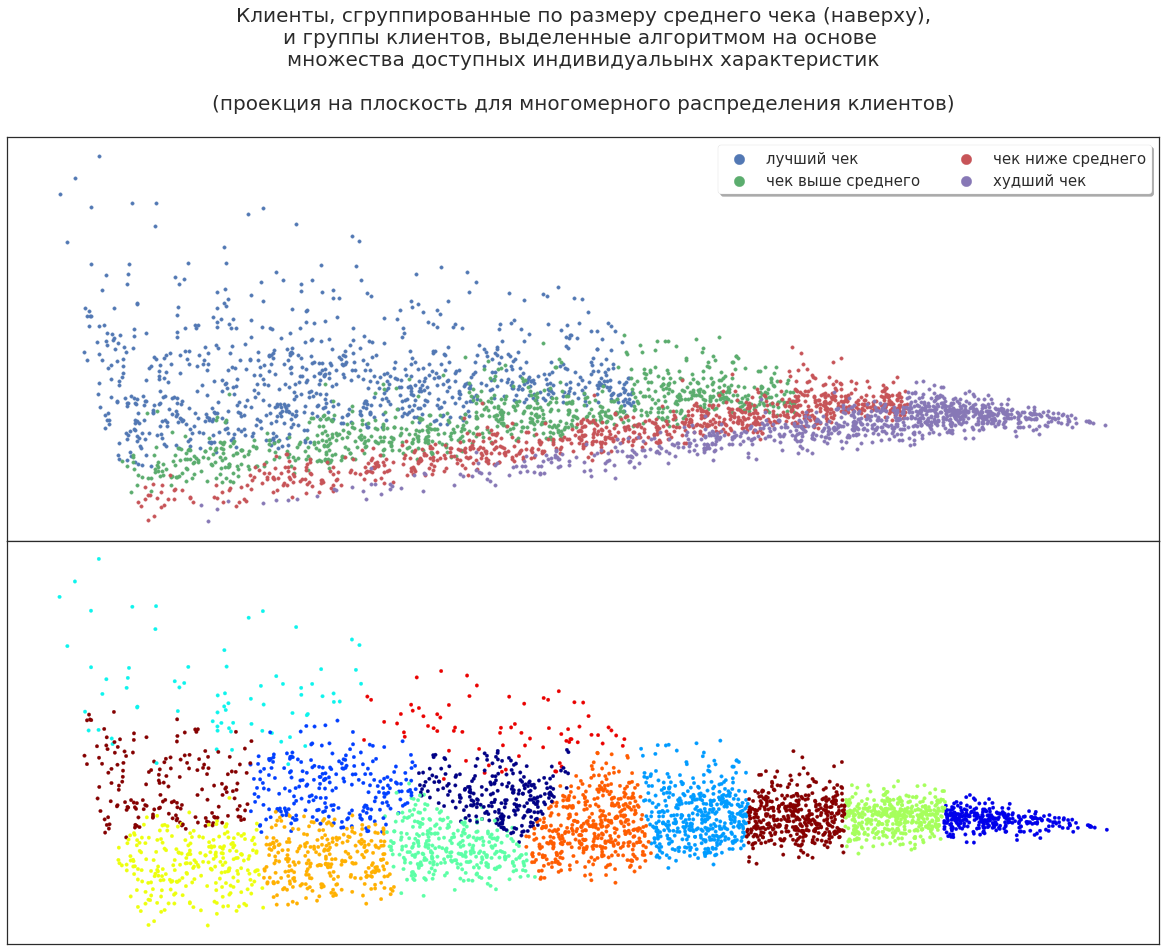
Let's expand the set of customer characteristics: add gender, age, behaviors, and more. How now the algorithm will distribute buyers?
For example, there is a group that covers both the best customers (the most profitable) and their “neighbors”, who bring less profit. Why the algorithm singled out this group is a question for the analyst. Perhaps, these clients with additional incentives will show greater profitability. Or, on the contrary, these clients are not very promising and the increase in profitability was an accidental deviation - it is pointless to stimulate them additionally. You can put forward various theories, but they have to be tested experimentally.
Further, the project may have several options for development. For example, you can predict purchases in a particular store for the next period. Then the store administrator will be able to order the necessary goods from the central warehouse on time.
Analysis of purchases at a specific outlet will help to form and display goods in shop windows. For example, if a lot of male buyers come to the store, a department with male products should not be placed in the far corner.
We must not forget about the so-called cannibalization of shops. That is, if two points of sales of the same network are located nearby (for example, at different ends of the same street), one of them can delay customers and the second one will stand idle. You can build a model that will monitor such events and signal it.
***
In short, machine learning is a powerful tool that can do a lot. Often, when building models, there are unobvious patterns that even business users did not know about. However, the quality of the model is very dependent on the quality and quantity of data.
Analysts of the Directorate for the development and implementation of software, Jet Infosystems
What questions are meant? For example: will the client leave? Often, customers leave if the store does not have the right product. For example, a woman buys a special cream every month for 10 thousand rubles and can choose from two cosmetics stores. In one of them the right product is often missing, and in the second there are no problems with availability. Most likely, it will constantly buy in the second, albeit a bit more expensive.
')
Another pressing question: how to optimize staff performance? For example, you need to plan shifts for cashiers and sales assistants. One way involves the use of statistical analysis. The analyst assesses the activity of clients depending on the day of the week and sees that on Saturday they buy the most, and on Friday and Sunday a little less. This hypothesis is tested by statistical tests, and the conclusions are passed on to management.
But such an analysis may not take into account many combinations of factors. For example, if it is Wednesday on March 7, will they buy more on this day than on Friday (after all, during normal times, Friday is a more popular day than other weekdays)? And graduation? Or local holidays? The more factors, the harder it is to take them all using simple rules. And instead of infinitely complicating the rules, you can build a model that predicts the demand for a particular day.
Our project in non-food retail
In this case, it was necessary to analyze the customer base (approximately 2.5 million people) and predict which of them will return to the store in the next two weeks. We took two methods of the CatBoost library - CatBoostClassifier and CatBoostRegressor, the first one - to predict the composition of the audience, the second - to select the most requested products in the next 2 weeks. CatBoost came out at the very beginning of our project; it was a fresh approach to working with categorical signs. And since the product range of our customer contains a lot of categorical features, we gladly tried the novelty in the work. After selecting the parameters, the model immediately met our expectations with accurate forecasting. No wonder CatBoost is one of the most popular gradient boosting models today.
For the model, we took statistics for 2017:
- checks: who owns the bonus card from the check, when you made a purchase, what you bought, the size of the discount, buy it or refund.
- demography: region and city of residence of the client, date of birth and gender, consent to distribution by phone or mail.
- goods: which category or segment are purchases, applications, etc.
Cleared the data from the noise (vendor cards, returns, purchases of services, not goods) and considered the necessary criteria (discount percentage, age). After that, the largest and smallest check for each customer was calculated, the average, median and maximum discount, how many times a person came and how many products from which categories he bought. These parameters were recalculated at intervals: the last week, two weeks, a month, three months. Such scrupulous work allowed us to build models with high prediction accuracy.
Aggregated data for models and run calculations. The first model predicted which of the buyers would come in the next two weeks, and the second gave recommendations: what goods (up to the article level) a particular person would buy. By the way, the requirement to predict the popularity of specific articles made the task much more complicated (usually, business only has enough forecasts by category and name of goods, but not by positions).
Clients recommended by the model for targeted mailing had a larger median check for one visit, and for the analyzed period they bought in total for a larger amount than other clients.
As a result, after mailing, about 30% of customers purchased at least one of the three products predicted by the model.
Now the company can more accurately forecast sales: the retailer knows who will come to him in the near future and what he will buy. This helps not only to optimize logistics, but also to reduce associated costs. For example, if a particular customer usually does not buy anything in winter, then you do not need to send him an SMS in January. The models also optimize newsletters: based on the forecast, the specialist immediately understands who to send the e-mail and who needs to send an urgent SMS.
Underwater rocks
They are in any ML-task - they were in ours. For example, we checked whether mailings with product recommendations help boost sales. For this, the predicted segment of buyers was divided into three groups:
- Control - the newsletter did not receive.
- Group with reminders - received a general text from the store.
- Group with recommendations - received SMS with three specific products predicted by the model.
It turned out that people who received recommendations bought less than customers who did not receive mailings. Less was the average check and the amount of goods purchased. The t-test showed that the differences were statistically significant (pvalue = 0.017).
To put it mildly, such results were discouraged by all. They began to look for the cause and found out that the shops sent customers messages to a certain messenger, and its users in our segment initially bought less compared to other customers. Even the marketers of the customer did not know about it. So the experiment turned out to be incorrect, but according to its results, we added the parameter “user of the messenger” to the model. This case demonstrates how carefully you need to choose channels to communicate with customers.
What other conclusions can be drawn?
- There is not much data.
- Sometimes an analyst's view from the outside leads to a fresh idea.
Customer segmentation
Data analysis reveals patterns that were hidden in previously available information. A good example is the comparison of customer groups using RFM segmentation (Recency Frequency Monetary) and segmentation using ML algorithms.
Three key indicators are used in RFM segmentation:
- prescription last purchase,
- frequency of purchases for the period
- amount spent by the client.
On the basis of these data, the main groups are distinguished: “squander”, “loyal customers”, “almost lost customers”, etc. And marketers are already including the desired target group in a specific newsletter or make an offer specifically for this group.
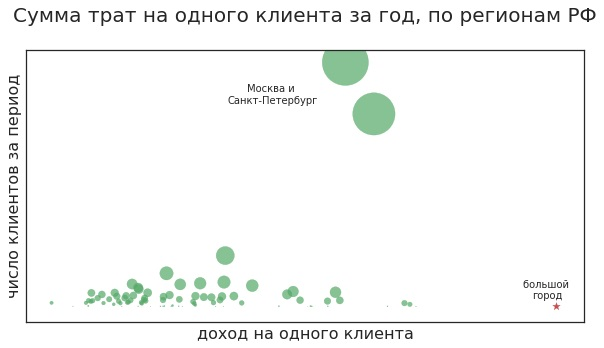
For example, using RFM segmentation, you can select customer segments and present them as points in three-dimensional space:
This allows you to visually see the location of certain groups in the total mass of customers, their proportions and the dynamics of changes.
Now we project the three-dimensional distribution of the segments onto the plane. Customers can be divided by the company's revenue to include the most profitable in marketing campaigns, but will this be enough for effective planning?
Even in such data, the machine learning algorithm finds additional possibilities: it breaks up customers into new large groups. You can analyze this partition to find out why the algorithm divided clients exactly in this way. For example, some high-yield customers are experts who accompany their customers in shopping and use their discount cards; Some actively share their cards with friends and acquaintances. That is, after the first ML application, you can get additional information about your clients based on the same data.
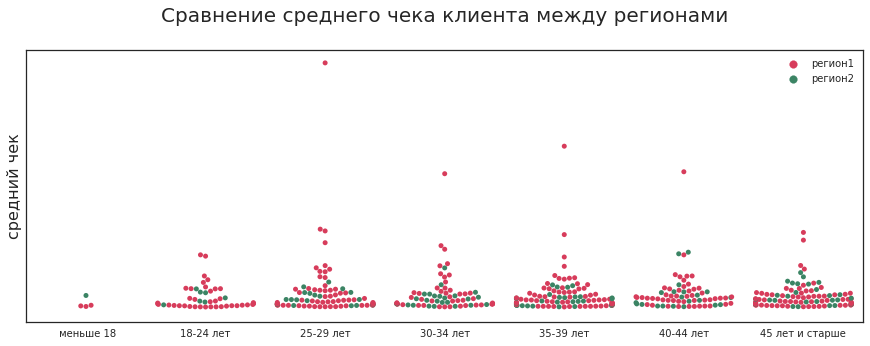
Let's expand the set of customer characteristics: add gender, age, behaviors, and more. How now the algorithm will distribute buyers?
For example, there is a group that covers both the best customers (the most profitable) and their “neighbors”, who bring less profit. Why the algorithm singled out this group is a question for the analyst. Perhaps, these clients with additional incentives will show greater profitability. Or, on the contrary, these clients are not very promising and the increase in profitability was an accidental deviation - it is pointless to stimulate them additionally. You can put forward various theories, but they have to be tested experimentally.
Warehouse Planning - Sales Forecasting
Further, the project may have several options for development. For example, you can predict purchases in a particular store for the next period. Then the store administrator will be able to order the necessary goods from the central warehouse on time.
Analysis of purchases at a specific outlet will help to form and display goods in shop windows. For example, if a lot of male buyers come to the store, a department with male products should not be placed in the far corner.
We must not forget about the so-called cannibalization of shops. That is, if two points of sales of the same network are located nearby (for example, at different ends of the same street), one of them can delay customers and the second one will stand idle. You can build a model that will monitor such events and signal it.
***
In short, machine learning is a powerful tool that can do a lot. Often, when building models, there are unobvious patterns that even business users did not know about. However, the quality of the model is very dependent on the quality and quantity of data.
Analysts of the Directorate for the development and implementation of software, Jet Infosystems
Source: https://habr.com/ru/post/430448/
All Articles