Splunk. Easy Troubleshooting application work

How often do you use already created add-ins with Splukbase instead of writing your own? Do they always have what you would like to see? Does everything in them work normally, even if it was installed exactly according to the instructions? Today we will talk about the features of working with Splunk applications.
Namely, we will learn to understand how requests are formed in applications, so that later on, on the basis of them, we can do something concrete for our task. And also we will consider several reasons because of which often applications start to work crookedly or do not work at all.
Why do we talk about this? Because many applications have a more complex query structure than ordinary ordinary users use when writing their own applications. But at the same time, there is often a need to understand how a particular table is constructed in order to correct it for yourself.
What chips are used by advanced application developers:
')
- Eventtype
- Macros
- Alert
- Lookups
Now, using examples of several queries, we will try to show what it is and how to understand them.
Example number 1
Take the request from the application Splunk App for Windows Infrastructure , which should give us the number of new users in Active Directory. We get the following table as a result:

Suppose we are not satisfied with something in this table: we need to add another field, do additional filtering by Subject User, or something else. It seems that this is difficult? Now open the search query, and edit everything!
But ... something went wrong.

Instead of a standard and understandable query, a strange construction appeared in single quotes. Let's get acquainted, this is a macro.
Splunk macros are reusable search queries. Macros are created when, in the framework of a single application, you often have to make similar transformations, and in order not to repeat them in each query, save them separately. The macro in the request can be recognized by the `macros_name` structure. Also, macros may require some input variable, such macros in the query have the structure `macros_name (value)`.
Next, open the macro text, you can find it here Settings - Advanced Search - Search macros .

In general, such a request looks more ordinary and can already be worked with. But there is one nuance, if you try to find such a field as eventtype in the logs, you will not find anything. This is another Splunk tool.
Eventtype is a filtering tool. It is used in cases where the necessary events are selected by a variety of criteria. Therefore, with the help of eventtype, we can once set up which events will be of this type, give them an adequate name and use them in any future requests.
You can find Eventtype in Settings - Event types.
Under “eventtype = wineventlog_security” the following search is hidden:

Thus, we “unwound” one of the requests in the application. Now we know on the basis of what data and what transformations were carried out in order to get the result, which means that if necessary we can correct it or create our own similar one. Just be careful, do not try to edit the macros and event types that are embedded in the application. Other dashboards can refer to them and then the results will change too. To prevent this from happening, it is better to collect all the fragments in one search or to create new macros and event types.
I note immediately that this is not the most complicated and complicated story. Eventtype can refer to any other eventtype, and this other to the third and so on. Some macros can refer to directories that are formed using other macros and so on.
Example number 2
Consider another example: the formation of a list of domains.
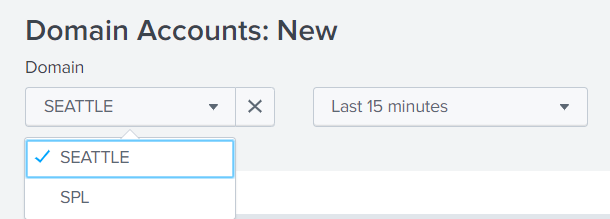
Let's look at the query that forms this list for us.
And we again see a macro that replaces almost the entire request.
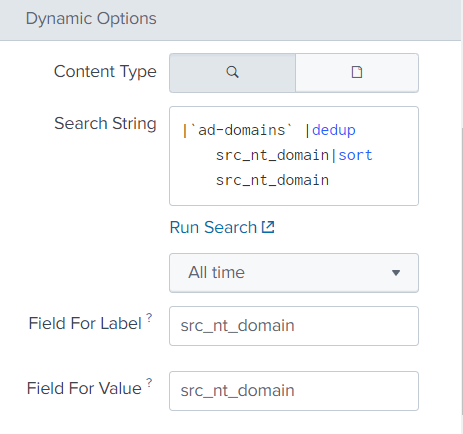
Go to the menu with macros ( Settings - Advanced Search - Search macros ) and see that our macro takes the basis of the directory with domains.
This begs questions: what is this directory, how and from where did it get our data, if we downloaded the application from the Internet and did not give him any reference information.
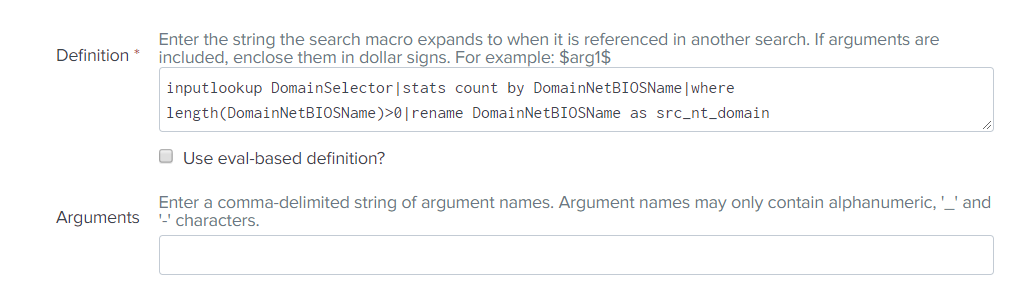
We recall that reference books can be created not only from downloaded files, but also with the help of searches or alerts. We go to the appropriate section ( Settings - Searches, Reports, and Alerts ) and really find an object there that is similar in name to something we need. (DomainSelector_Lookup)
This is an alert that runs on a schedule, works with a certain frequency and updates the directory.

But let's see where it takes the domain name, and for this we will open a search query. And in it ... again a macro.

In which there is again a link to the eventtype.

And in which there is another reference to eventtype
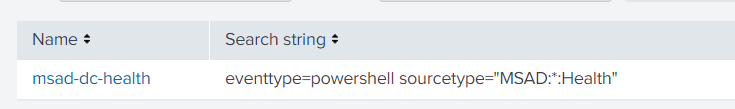
And just now we got to the end of this confusing chain:

In two examples, we examined what lies behind the signs and graphs of such an application as the Splunk App for Windows Infrastructure. This architecture shows a high level of data model development, and hence the quality of the application, but it gives a lot of pain to users who want to understand what is happening there.
Troubleshooting
As stated at the beginning of the article, let's say a couple of words about why the application may not work as we expect.
Consider this example: we installed the Splunk App for Windows Infrastructure application, installed the add-ons that are required for it, set up data loading on the splank. But when we go into the application, we see the following picture:

Why can this be? To be honest, there can be a lot of reasons, but we will now consider the two most likely and most common.
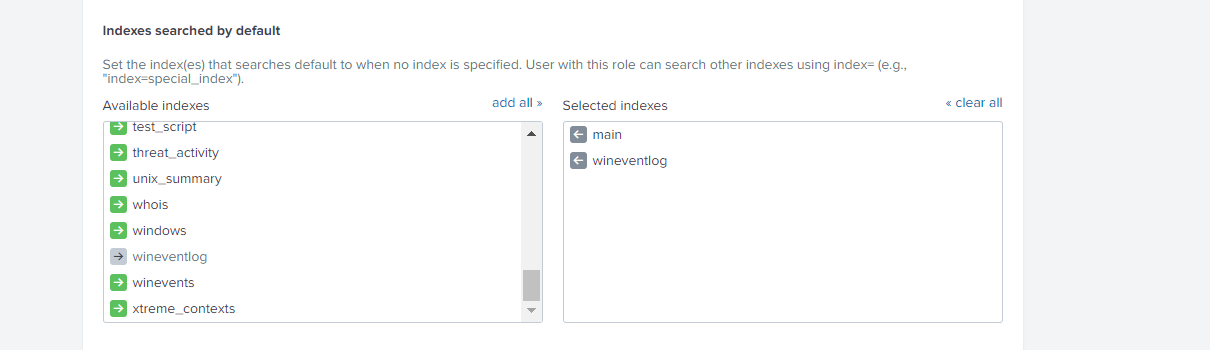
1. Default Indexes
As you can see, in all search queries that were in the first part of the article there is no classical part of index = .... When the query does not indicate which index is being searched for, then the search is only for those indices that are in the Default Indexes list. By default, only the main index is included there, so we need to add the indices we need to this group.
This can be done as follows:
Settings - Users and authentication - Access controls - Roles - <those roles that will work with this application> - Indexes searched by default
Then add the necessary indexes to the Selected indexes.
2. Scheduled Alerts
Many filters are based on directories, and directories on alerts. Perhaps these alerts have not yet worked and have not filled out reference books with the necessary information. We need to look at when they will work and, if necessary, change the time and interval for updating the directory. ( Settings - Searches, Reports, and Alerts )
In this article, we all looked at the example of a Windows Infrastructure application, but the same thing is found in many applications created by experienced splankers.
If you want to understand them better, so that this would not be a black box for you, which transforms information in order to create high-quality your own analytics based on this data, then you need to learn more about macros and eventtypes . This can also be done as part of the Splunk Fundamentals 2 course.
If you have not tried Splunk yet, then it's time to start, the free version up to 500MB per day is available to everyone. And if you have questions or problems with Splunk - you can ask them to us , and we will help.
We are the official Premier Splunk Partner .

Source: https://habr.com/ru/post/429930/
All Articles