Adult journalism: from Russia to the Kremlin
Analysis of publications Lenta.ru for 18 years (from September 1999 to December 2017) using python, sklearn, scipy, XGBoost, pymorphy2, nltk, gensim, MongoDB, Keras and TensorFlow.
The study used data from the post " Analyze this - Lenta.ru " user ildarchegg . The author has kindly provided 3 gigabytes of articles in a convenient format, and I decided that this is a great opportunity to test some text processing methods. At the same time, if you're lucky, learn something new about Russian journalism, society and in general.
Content:
- MongoDB to import json into python
- Clearing and normalizing text
- Tag Cloud
- LDA-based thematic modeling
- Popularity Prediction: XGBClassifier, LogisticRegression, Embedding & LSTM
- Explore Objects with Word2Vec
MongoDB to import json into python
Unfortunately, json with texts was a bit broken, uncritical for me, but python refused to work with the file. Therefore, at first I imported into MongoDB, and only then through MongoClient from the pymongo library I loaded the array and saved it to csv piece by piece.
From the comments: 1. I had to start the database with the sudo service mongod start command - there are other options, but they did not work; 2. mongoimport - a separate application, from the mongo console does not start, only from the terminal.
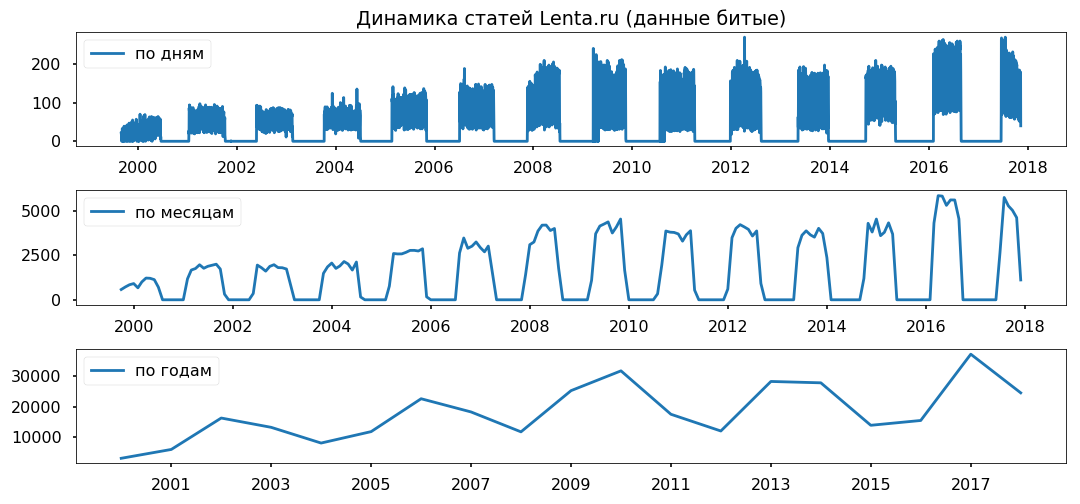
The data gaps are evenly distributed over the years. I do not plan to use the period of less than a year, I hope, it will not affect the correctness of the conclusions.
Clearing and normalizing text
Before directly analyzing the array, you need to bring it to standard form: remove special characters, translate text into lower case (pandas string methods did a great job), remove stop words (stopwords.words ('russian') from nltk.corpus), return the words to normal form using lemmatization (pymorphy2.MorphAnalyzer).
It was not without flaws, for example, Dmitry Peskov turned into “dmitry” and “sand”, but on the whole I was satisfied with the result.
Tag Cloud
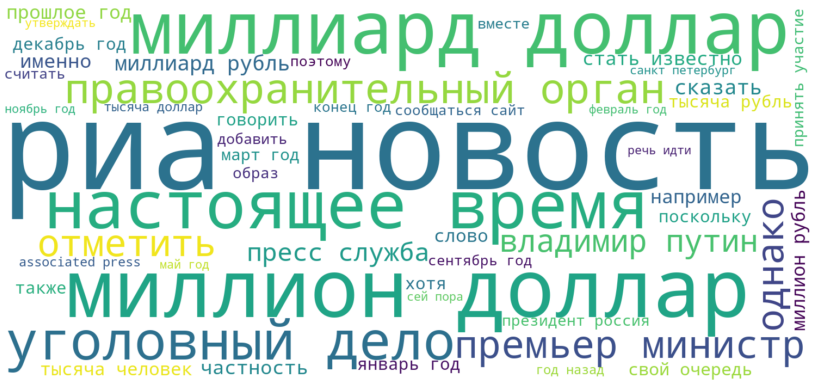
As a seed, let's see what publications are in the most general form. We will display the 50 most frequent words that journalists used Tapes from 1999 to 2017, in the form of a tag cloud.
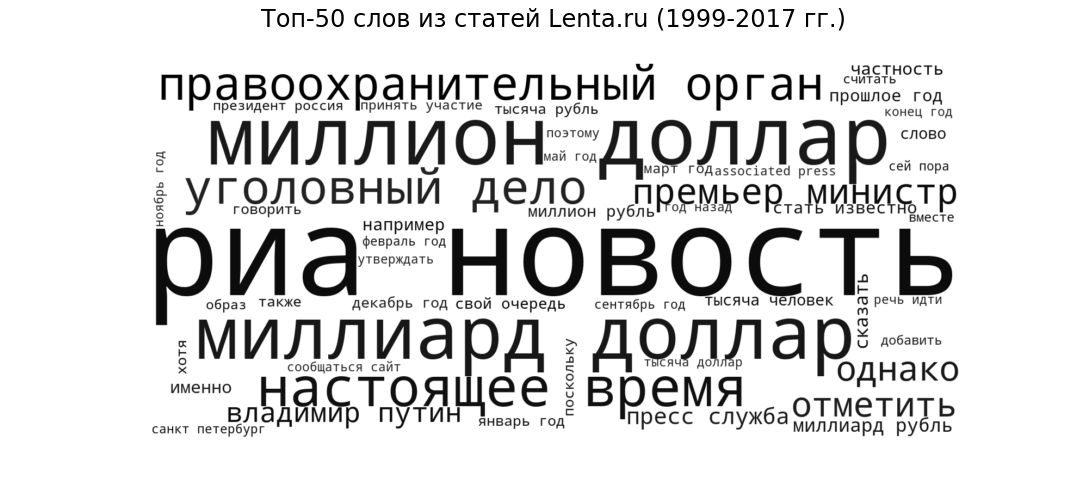
“Ria Novosti” (the most popular source), “billion dollar” and “million dollar” (financial topics), “present” (speech circulation, typical of all news sites), “law enforcement agency” and “criminal case” (criminal news ), “Prime Minister” and “Vladimir Putin” (politics) are quite expected style and themes for a news portal.
LDA-based thematic modeling
We calculate the most popular topics for each year using LDA from gensim. LDA (thematic modeling of the Dirichlet latent placement method) automatically reveals hidden topics (a set of words that occur together and most often) based on the observed word frequencies in the articles.
The cornerstone of domestic journalism was Russia, Putin, the United States.
In some years, this topic was diluted by the Chechen war (from 1999 to 2000), September 11 - in 2001, by Iraq (from 2002 to 2004). From 2008 to 2009, the economy took the first place: interest, company, dollar, ruble, billion, million. In 2011, they often wrote about Gaddafi.
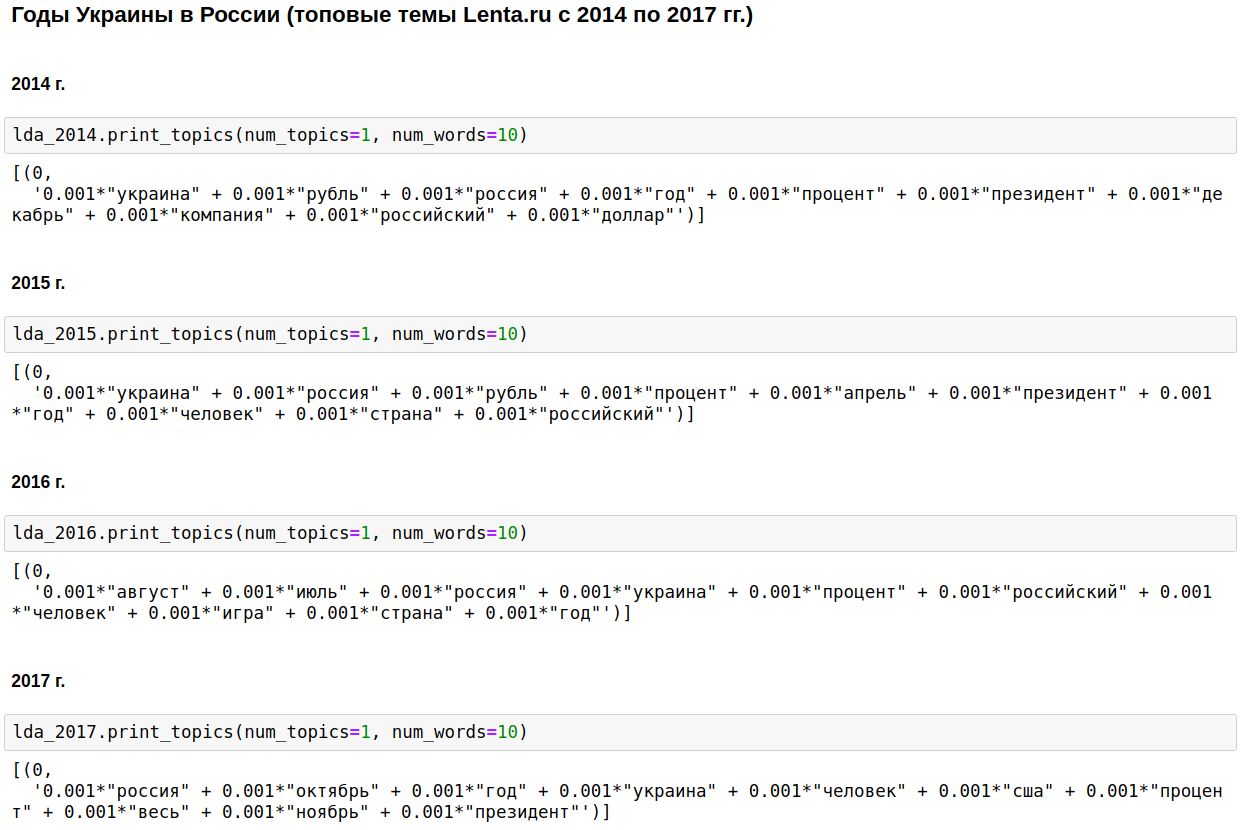
From 2014 to 2017 in Russia began and continues the years of Ukraine. The peak came in 2015, then the trend began to decline, but still continues to hold high.
Interesting, of course, but nothing that I wouldn’t know or guess about.
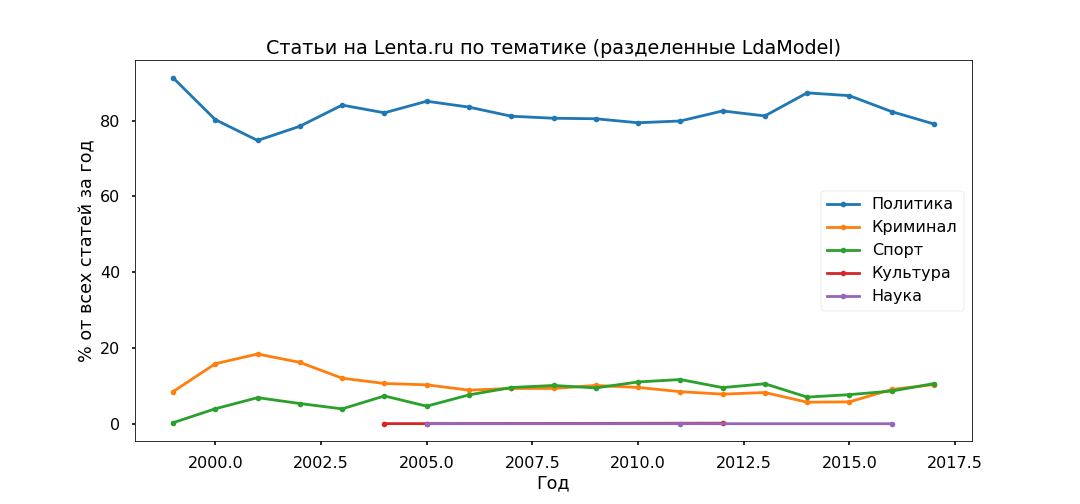
Let's change a bit of the approach - let's highlight the top topics for all the time and see how their ratio has changed from year to year, that is, let's study the evolution of topics.
The most interpreted option was Top-5:
- Crime (male, police, occur, detain, policeman);
- Politics (Russia, Ukraine, President, USA, chapter);
- Culture (spinner, purulent, instagram, ramming - yes, this is our culture, although this topic turned out to be quite mixed);
- Sports (match, team, game, club, athlete, championship);
- Science (scientist, space, satellite, planet, cell).
Next, take each article and see with what probability it relates to a particular topic, as a result, all materials will be divided into five groups.
The policy turned out the most popular - under 80% of all publications. However, the peak of popularity of political materials was passed in 2014, now their share is declining, and the contribution to the information agenda of Crime and Sports is growing.
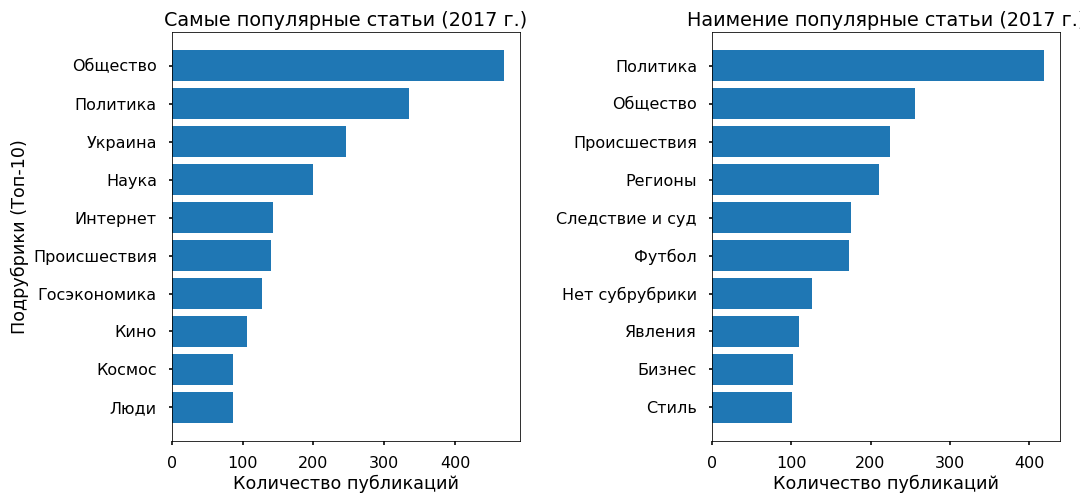
Check the adequacy of thematic models using the subheadings indicated by the editors. The top sub-headings have been more or less correctly distinguished since 2013.

There are no particular contradictions: the policy is stagnating in 2017, Football and the Accidents are growing, Ukraine is still in the trend, with a peak in 2015
Popularity Prediction: XGBClassifier, LogisticRegression, Embedding & LSTM
Let us try to understand whether the text can predict the popularity of an article on the Ribbon, and on what this popularity generally depends. As a target variable, I took the number of reposts on Facebook for 2017.
3 thousand articles for 2017 did not have any repost on Fb - they were assigned the class “unpopular”, 3 thousand materials with the largest number of reposts received the “most popular” label.
The text (6 thousand publications for 2017) was divided into unograms and digrams (tokens, both single and two-word phrases) and a matrix was built, where the columns are tokens, rows are articles, and at the intersection is relative the frequency of words in the article. Used functions from sklearn - CountVectorizer and TfidfTransformer.
The prepared data were fed to the input XGBClassifier (classifier based on gradient boosting from the xgboost library), which after 13 minutes of searching the hyperparameters (GridSearchCV with cv = 3) produced an accuracy of 76% on the test.

Then I used the usual logistic regression (sklearn.linear_model.LogisticRegression) and after 17 seconds I got an accuracy of 81%.
Once again, I am convinced that linear methods are best for classifying texts, provided that the data are carefully prepared.
As a fashion, I tested a little neural networks. Translated words into numbers using one_hot from keras, brought all articles to the same length (the pad_sequences function from keras) and fed LSTM (convolutional neural network, using TensorFlow backend) to the input through the Embedding layer (to reduce the dimension and speed up processing time).
The network worked for 2 minutes and showed accuracy on the test of 70%. It’s not the limit at all, but there’s no point in bothering much.
In general, all methods gave relatively little accuracy. Experience shows that classification algorithms work well with a variety of stylistics, - on author's materials, in other words. Lenta.ru has such materials, but there are very few of them - less than 2%.

The main array is written using neutral news vocabulary. And the popularity of news is determined not by the text itself or even the topic as such, but by their affiliation to the upward informational trend.
For example, quite a lot of popular articles cover events in Ukraine, the least popular of this topic almost do not concern.
Explore Objects with Word2Vec
As a conclusion, I wanted to conduct a sentiment analysis - to understand how journalists are among the most popular objects that they mention in their articles, whether their attitude changes with time.
But I have no marked data, and the search for semantic thesauruses is unlikely to work correctly, since the news vocabulary is rather neutral, stingy with emotions. Therefore, I decided to focus on the context in which the objects are mentioned.
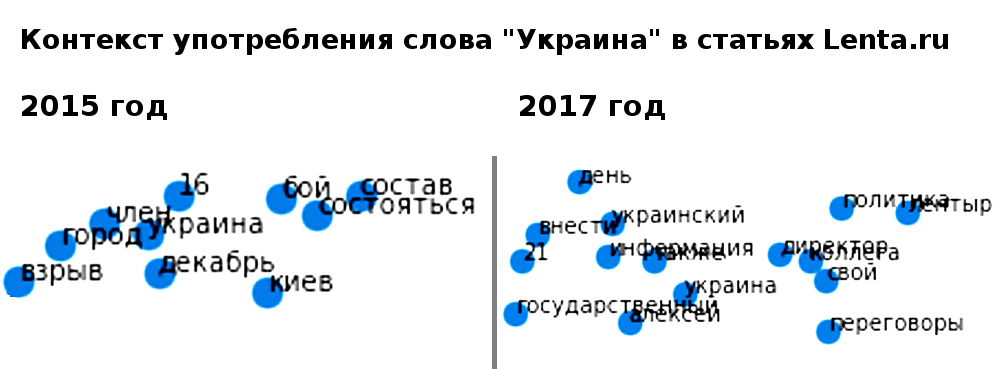
He took Ukraine (2015 vs 2017) and Putin (2000 vs 2017) as a test. I chose the articles in which they are mentioned, translated the text into a multidimensional vector space (Word2Vec from gensim.models) and projected onto a two-dimensional one using the Main Components method.
After the visualization of the pictures turned out to be epic, no less than the tapestry from Bayeux. Cut out the necessary clusters to simplify perception, as I could, sorry for the "jackals."
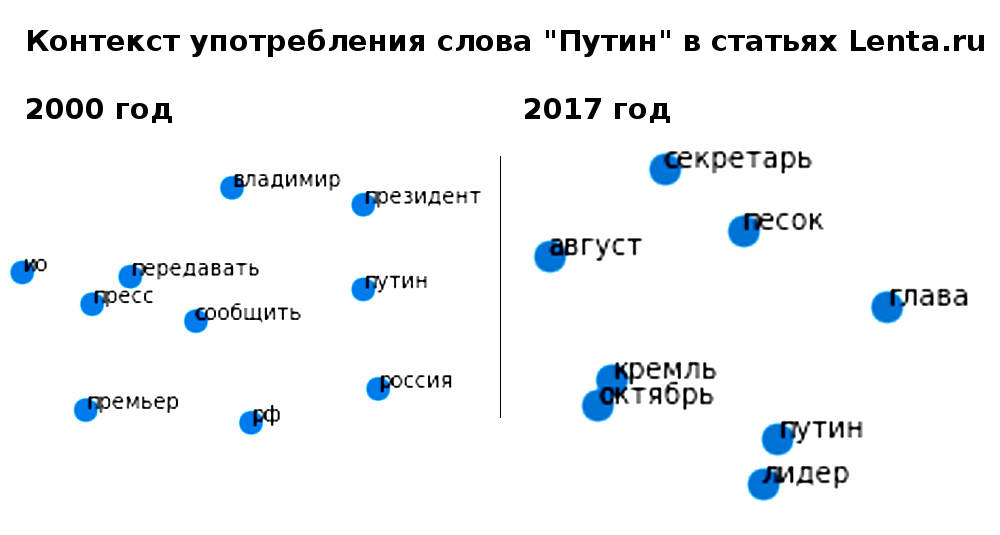
What noticed.
Putin of the 2000 model always appeared in the context of Russia and delivered his addresses personally. In 2017, the President of the Russian Federation became a leader (whatever that means) and distanced himself from the country, now he is, judging by the context, a representative of the Kremlin, who communicates with the world through his press secretary.
Ukraine-2015 in the Russian media - war, battles, explosions; mentioned impersonal (Kiev declared, Kiev began). Ukraine 2017 appears primarily in the context of negotiations between officials, and these individuals have specific names.
...
It can take a long time to interpret the information received, but I think this is offtopic on this resource. Those interested can look at their own. Code and data attached.
')
Source: https://habr.com/ru/post/429270/
All Articles