"Find N Differences." Experience testing layout Tinkoff.ru
The article is published on behalf of Alexander Kochetkov and Krass Snezhana
How many differences can you find in 10 seconds?

')
Our tester will find ALL the differences. And even those that are not visible. Below I will talk about how he will do it, but for a start I will give you a little insight.
Our company is developing various web applications. Take for example a typical client web application with a rich UI, several hundred pages, adaptive layout and support for all popular browsers. In this scenario, regression testing of an existing UI turns into blood pressure and takes a lot of time. In order not to go crazy and not get bogged down in this quagmire, we automated this process and created a new tool - QVisual .
How does a person test the layout (UI)? It takes the current implementation and compares it with an abstract benchmark, built on the basis of its own experience, convenience, and thousands of web pages viewed so far. Writing your AI to test the layout would, of course, be very cool. But this idea looks like shooting from a cannon on a sparrow. Therefore, we did it easier: as a reference, we began to take the same page previously tested by man (in most cases, this is a page from the past successful release). Thus, the whole task was reduced to a comparison of two pages.
Of course, many solutions have already been published that allow pixel-by-pixel comparison of two pictures. Why did we write "another bike"? The answer is simple - we did not want to be limited to a pixel-by-pixel comparison, we wanted to be able to compare individual blocks on a page and get a meaningful report on the number and types of differences in these blocks. Therefore, the tool implemented by us can compare not only the images themselves, but also individual elements of the page, if required. So we operate not with screenshots from two pages, but with snapshots of these pages.
Snapshot is a screenshot of the entire page, plus data on the styles and properties of some of the web elements of this page. Finding differences in snapshots we implement server application with an open API.
Approach: comparing elements rather than pictures allows us to highlight common errors, such as:
A small analysis of examples with a number of typical errors:

You can remove the snapshot from the page using your own tools, and you can send a screenshot and data about the elements to the server with two usual POST requests.
If your tests are written in Java, it will be easier to use our library for these purposes, which will take care of creating a snapshot and transferring data to the server.
Before you start, you need to specify several variables (server address, type and version of the browser, etc.). In the test itself, you must specify the address of the page from which you want to take a snapshot, and a list of locators in the Xpath or CSS format to search for the elements we need (optional). That's all!
Inside the library, we use internal Selenium WebDriver commands and JavaScript scripts to take a snapshot. WebDriver's internal commands allow you to quickly and accurately take screenshots of the page (without gluing and scrolling), and js - to find the necessary elements and add data about them to the snapshot. After removing the snapshot, we transfer it to our server application, which saves the item data in mongo, and the screenshots themselves on the server disk. Now this snapshot can be compared with the standard. These elements will be compared as normal objects, and screenshots will be pixel-by-pixel using OpenCV .
Now you can get a report comparing two snapshots. To do this, you need to send a GET request and get back the comparison data in the form of JSON, or use our front-end application, which will build a detailed, and most importantly, readable report.
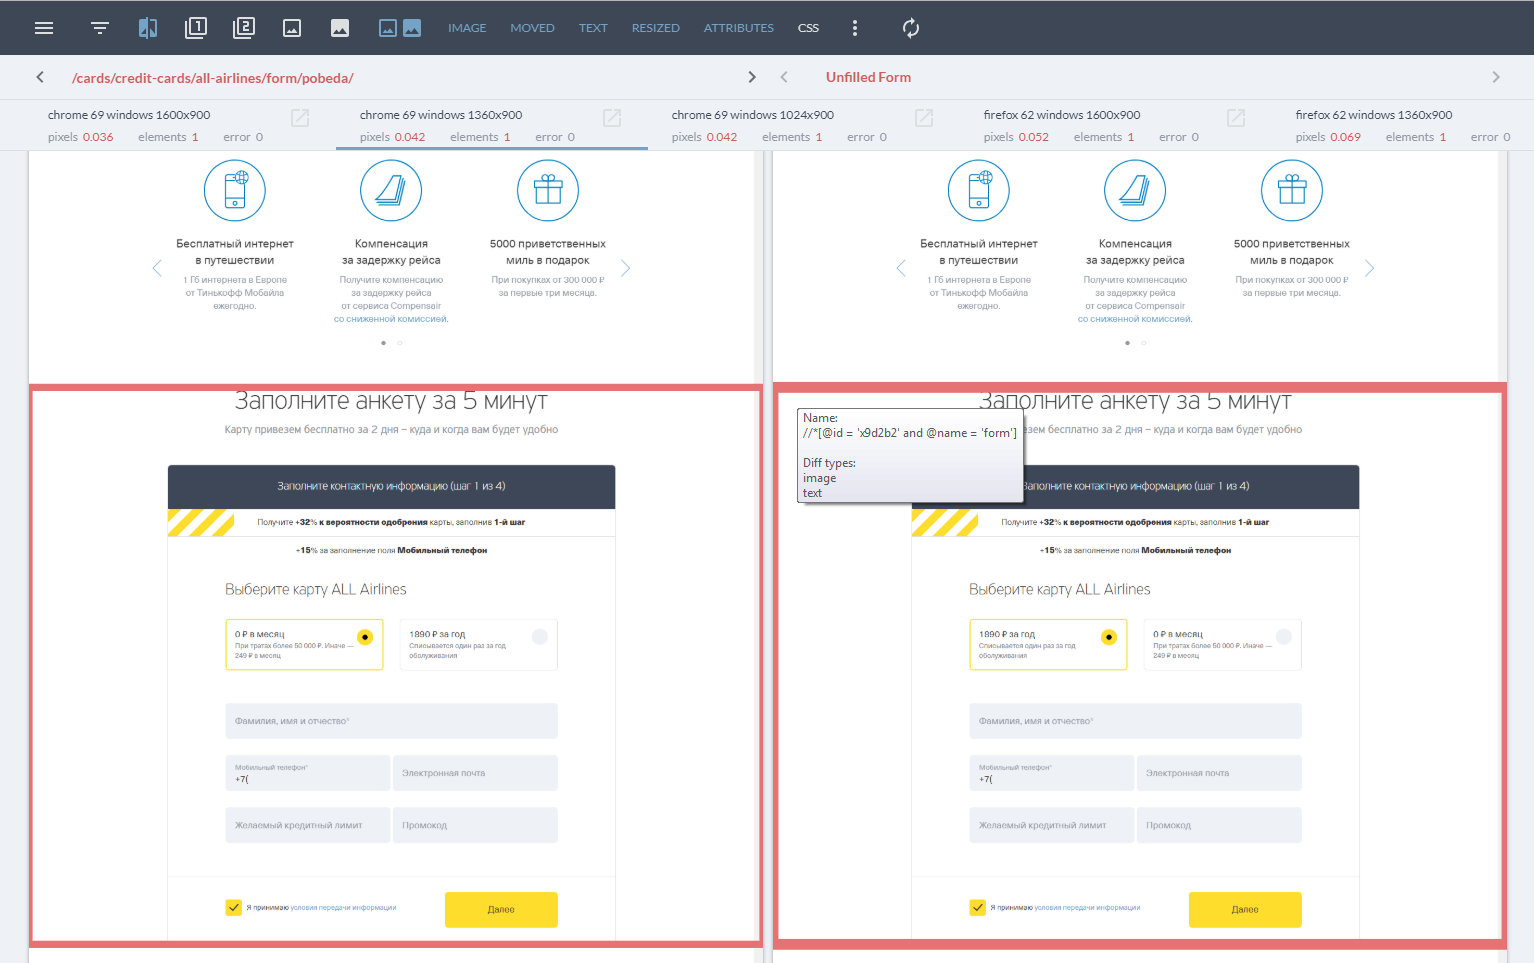
The main page of the report contains information about successfully passed and failed tests (highlighted in red) and consists of three lists:
In the upper part there are icons that allow you to filter the results depending on the type of errors and the percentage difference in pixel by pixel comparison. This implementation speeds error verification.

Brief statistics in the blocks of the last list contains three parameters:
The report for each page consists of two separate screenshots and a stroke of the elements in which diff were found. The pop-up text when hovering on different elements indicates the type of error and the locator by which the element was found. You can also set filtering by error type, hide one of the screenshots and enable / disable the result of pixel by pixel comparison.
As mentioned above, we also compare screenshots pixel by pixel, which is very effective for some tasks. For example, for new pages, with a still unsteady DOM, there is no point in wasting time writing and maintaining locators.

In conclusion, I would like to say about the real exhaust of this tool for the company: every day, QVisual helps our testers to be aware of all changes in the layout of applications. We save a lot of time comparing landings using automatic screenshot creation (up to 1500+ landings in 3 browsers in 6 screen resolutions).
PS . This is a quick overview of our tool. More information can be found on GitHub , as well as participate in the development of the tool.
PPS For those who want to test themselves - these are all the differences in the picture from the title:

Tool support channel in Telegram: t.me/qvisual
How many differences can you find in 10 seconds?
')
Our tester will find ALL the differences. And even those that are not visible. Below I will talk about how he will do it, but for a start I will give you a little insight.
Our company is developing various web applications. Take for example a typical client web application with a rich UI, several hundred pages, adaptive layout and support for all popular browsers. In this scenario, regression testing of an existing UI turns into blood pressure and takes a lot of time. In order not to go crazy and not get bogged down in this quagmire, we automated this process and created a new tool - QVisual .
How does a person test the layout (UI)? It takes the current implementation and compares it with an abstract benchmark, built on the basis of its own experience, convenience, and thousands of web pages viewed so far. Writing your AI to test the layout would, of course, be very cool. But this idea looks like shooting from a cannon on a sparrow. Therefore, we did it easier: as a reference, we began to take the same page previously tested by man (in most cases, this is a page from the past successful release). Thus, the whole task was reduced to a comparison of two pages.
Of course, many solutions have already been published that allow pixel-by-pixel comparison of two pictures. Why did we write "another bike"? The answer is simple - we did not want to be limited to a pixel-by-pixel comparison, we wanted to be able to compare individual blocks on a page and get a meaningful report on the number and types of differences in these blocks. Therefore, the tool implemented by us can compare not only the images themselves, but also individual elements of the page, if required. So we operate not with screenshots from two pages, but with snapshots of these pages.
Benefits of the approach
Snapshot is a screenshot of the entire page, plus data on the styles and properties of some of the web elements of this page. Finding differences in snapshots we implement server application with an open API.
Approach: comparing elements rather than pictures allows us to highlight common errors, such as:
- IMAGE - the element on the page does not visually correspond to the element on the standard;
- MOVED - the displacement of elements, the element is identical to the reference, but with different coordinates;
- RESIZED - very similar to the offset, but instead of the position of the element is different in its size;
- TEXT - errors in the text;
- CSS and ATTRIBUTES - differences in styles and attributes are not always visually noticeable and are not always an error. But controlling changes in them is quite useful, because in some cases it helps to find errors related to them.
A small analysis of examples with a number of typical errors:
How it works?
You can remove the snapshot from the page using your own tools, and you can send a screenshot and data about the elements to the server with two usual POST requests.
If your tests are written in Java, it will be easier to use our library for these purposes, which will take care of creating a snapshot and transferring data to the server.
Before you start, you need to specify several variables (server address, type and version of the browser, etc.). In the test itself, you must specify the address of the page from which you want to take a snapshot, and a list of locators in the Xpath or CSS format to search for the elements we need (optional). That's all!
Inside the library, we use internal Selenium WebDriver commands and JavaScript scripts to take a snapshot. WebDriver's internal commands allow you to quickly and accurately take screenshots of the page (without gluing and scrolling), and js - to find the necessary elements and add data about them to the snapshot. After removing the snapshot, we transfer it to our server application, which saves the item data in mongo, and the screenshots themselves on the server disk. Now this snapshot can be compared with the standard. These elements will be compared as normal objects, and screenshots will be pixel-by-pixel using OpenCV .
Now you can get a report comparing two snapshots. To do this, you need to send a GET request and get back the comparison data in the form of JSON, or use our front-end application, which will build a detailed, and most importantly, readable report.
What's in the report?
The main page of the report contains information about successfully passed and failed tests (highlighted in red) and consists of three lists:
- list of tests (story) in which the layout was checked. Here, for convenience, the test names correspond to the url of the pages from which the snapshot was taken;
- list of states (state) - each story can contain several states, for example, a screenshot before the form is filled in and after. Each state can contain several snapshots in different resolutions and versions of the browser;
- a list with different browsers and permissions and brief statistics.
In the upper part there are icons that allow you to filter the results depending on the type of errors and the percentage difference in pixel by pixel comparison. This implementation speeds error verification.
Brief statistics in the blocks of the last list contains three parameters:
- pixels - the difference between two images in percentage relative to the size of the entire page;
- elements - the number of different elements (of those that were found on the locators passed in the test);
- error - internal errors that occurred when comparing snapshots (for example, one of the images was not found for comparison, or there is no data on the snapshots).
The report for each page consists of two separate screenshots and a stroke of the elements in which diff were found. The pop-up text when hovering on different elements indicates the type of error and the locator by which the element was found. You can also set filtering by error type, hide one of the screenshots and enable / disable the result of pixel by pixel comparison.
As mentioned above, we also compare screenshots pixel by pixel, which is very effective for some tasks. For example, for new pages, with a still unsteady DOM, there is no point in wasting time writing and maintaining locators.
In conclusion, I would like to say about the real exhaust of this tool for the company: every day, QVisual helps our testers to be aware of all changes in the layout of applications. We save a lot of time comparing landings using automatic screenshot creation (up to 1500+ landings in 3 browsers in 6 screen resolutions).
PS . This is a quick overview of our tool. More information can be found on GitHub , as well as participate in the development of the tool.
PPS For those who want to test themselves - these are all the differences in the picture from the title:
Tool support channel in Telegram: t.me/qvisual
Source: https://habr.com/ru/post/429054/
All Articles