Reading meter readings at home
 In the last article I told you how I took readings from water meters. Since then, several years have passed. The device continues to work and for all this time I did not touch it. But this seemed to me a little, because there were other devices in the house from which it was necessary to take readings. This is what I want to talk about.
Electricity meter
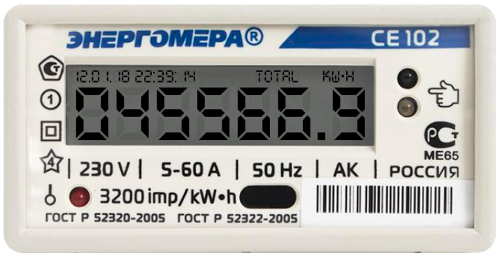
Each apartment has an electricity meter and his testimony must also be delivered on time. We had the same problem with this as with water meters - we constantly remembered about it when we were quite far away. It was necessary to somehow solve this problem. This is the counter I have installed in the panel on the landing.
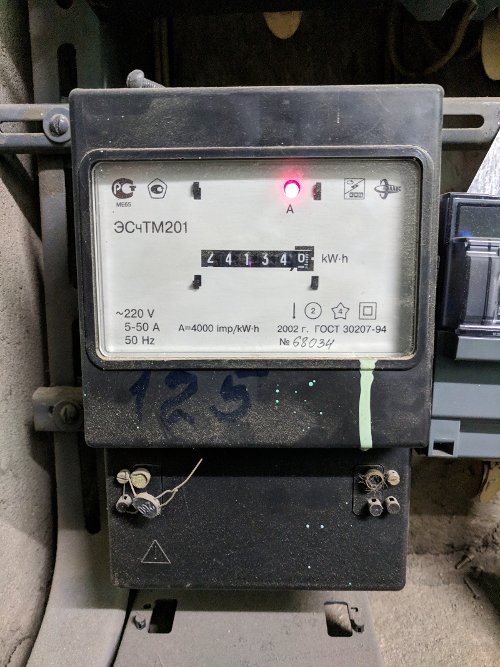
Each counter indicates the number of pulses that it makes per 1 kW * h. I have an old electricity meter installed and it does not have special conclusions for counting these pulses. But he has an LED that flashes in time with these pulses. So we need to somehow determine that the LED is blinking. For this, I decided to use a phototransistor, which changes its resistance depending on its light. So that he would react only to the LED, the phototransistor was installed in a fragment of a square wooden bar and taped to the meter with tape. As it turned out you can see in the photo below.

Even during the repair in the apartment, in the general shield I installed the plinth and led him from the twisted pair to the apartment shield with a weak current. I installed the device in this shield (it also has a power outlet) and connected the phototransistor to my device through the skirting board. And in this form, everything works for more than six months.
Water leakage sensor
As a sample, I took the usual leak sensor GIDROLOCK WSP . His principle of operation is similar to a phototransistor, only he changes his resistance from the ingress of water on him.
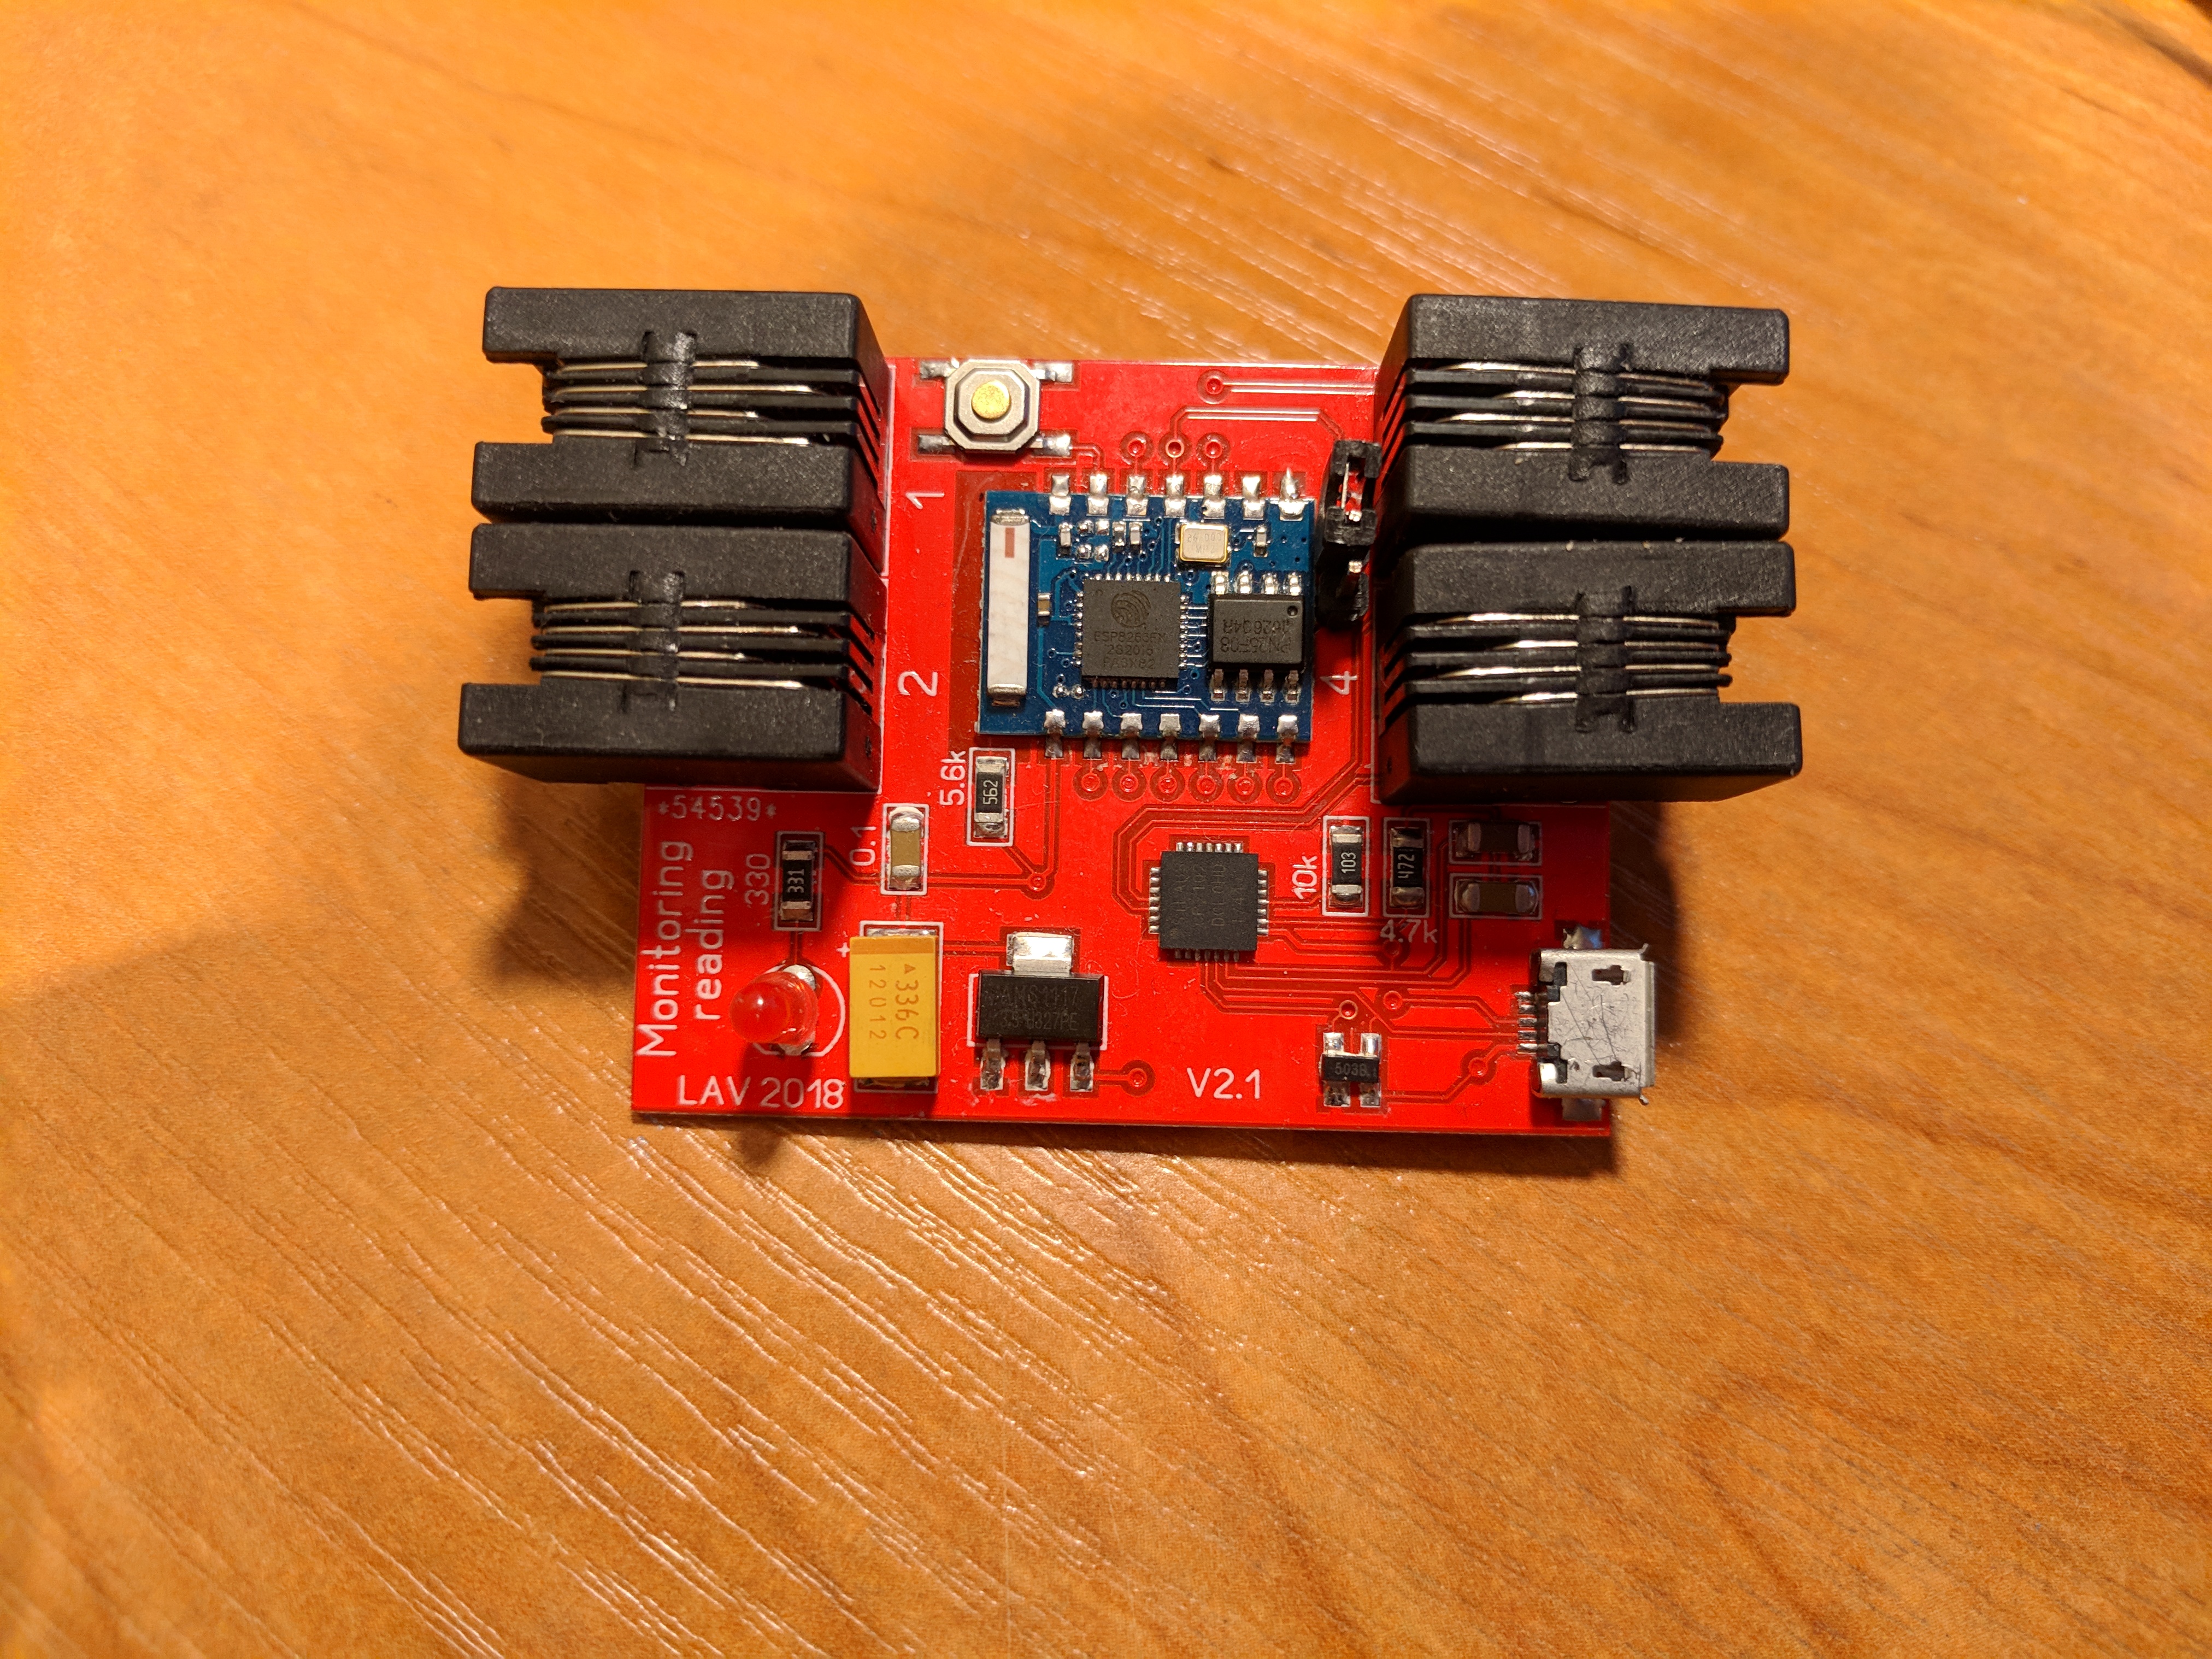
Completion of the board
I modified the old board a bit. Now the scheme is as follows
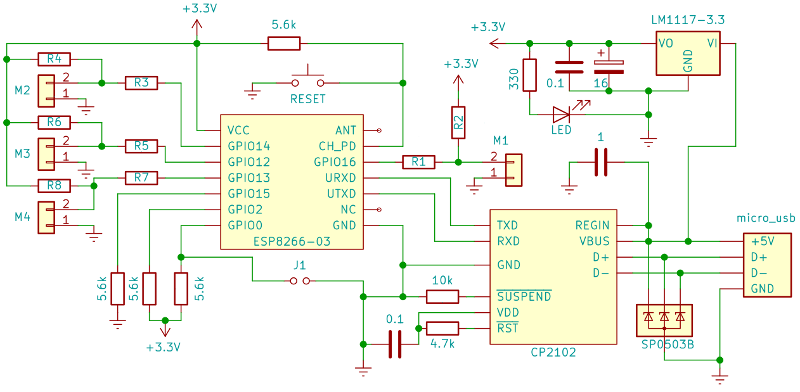
The following changes were made:
- The chip CP2102 is added to the circuit, so that the board can be connected directly without adapters
- Increased the number of pins to 4 (M1, M2, M3, M4), which allows you to simultaneously connect a larger number of counters
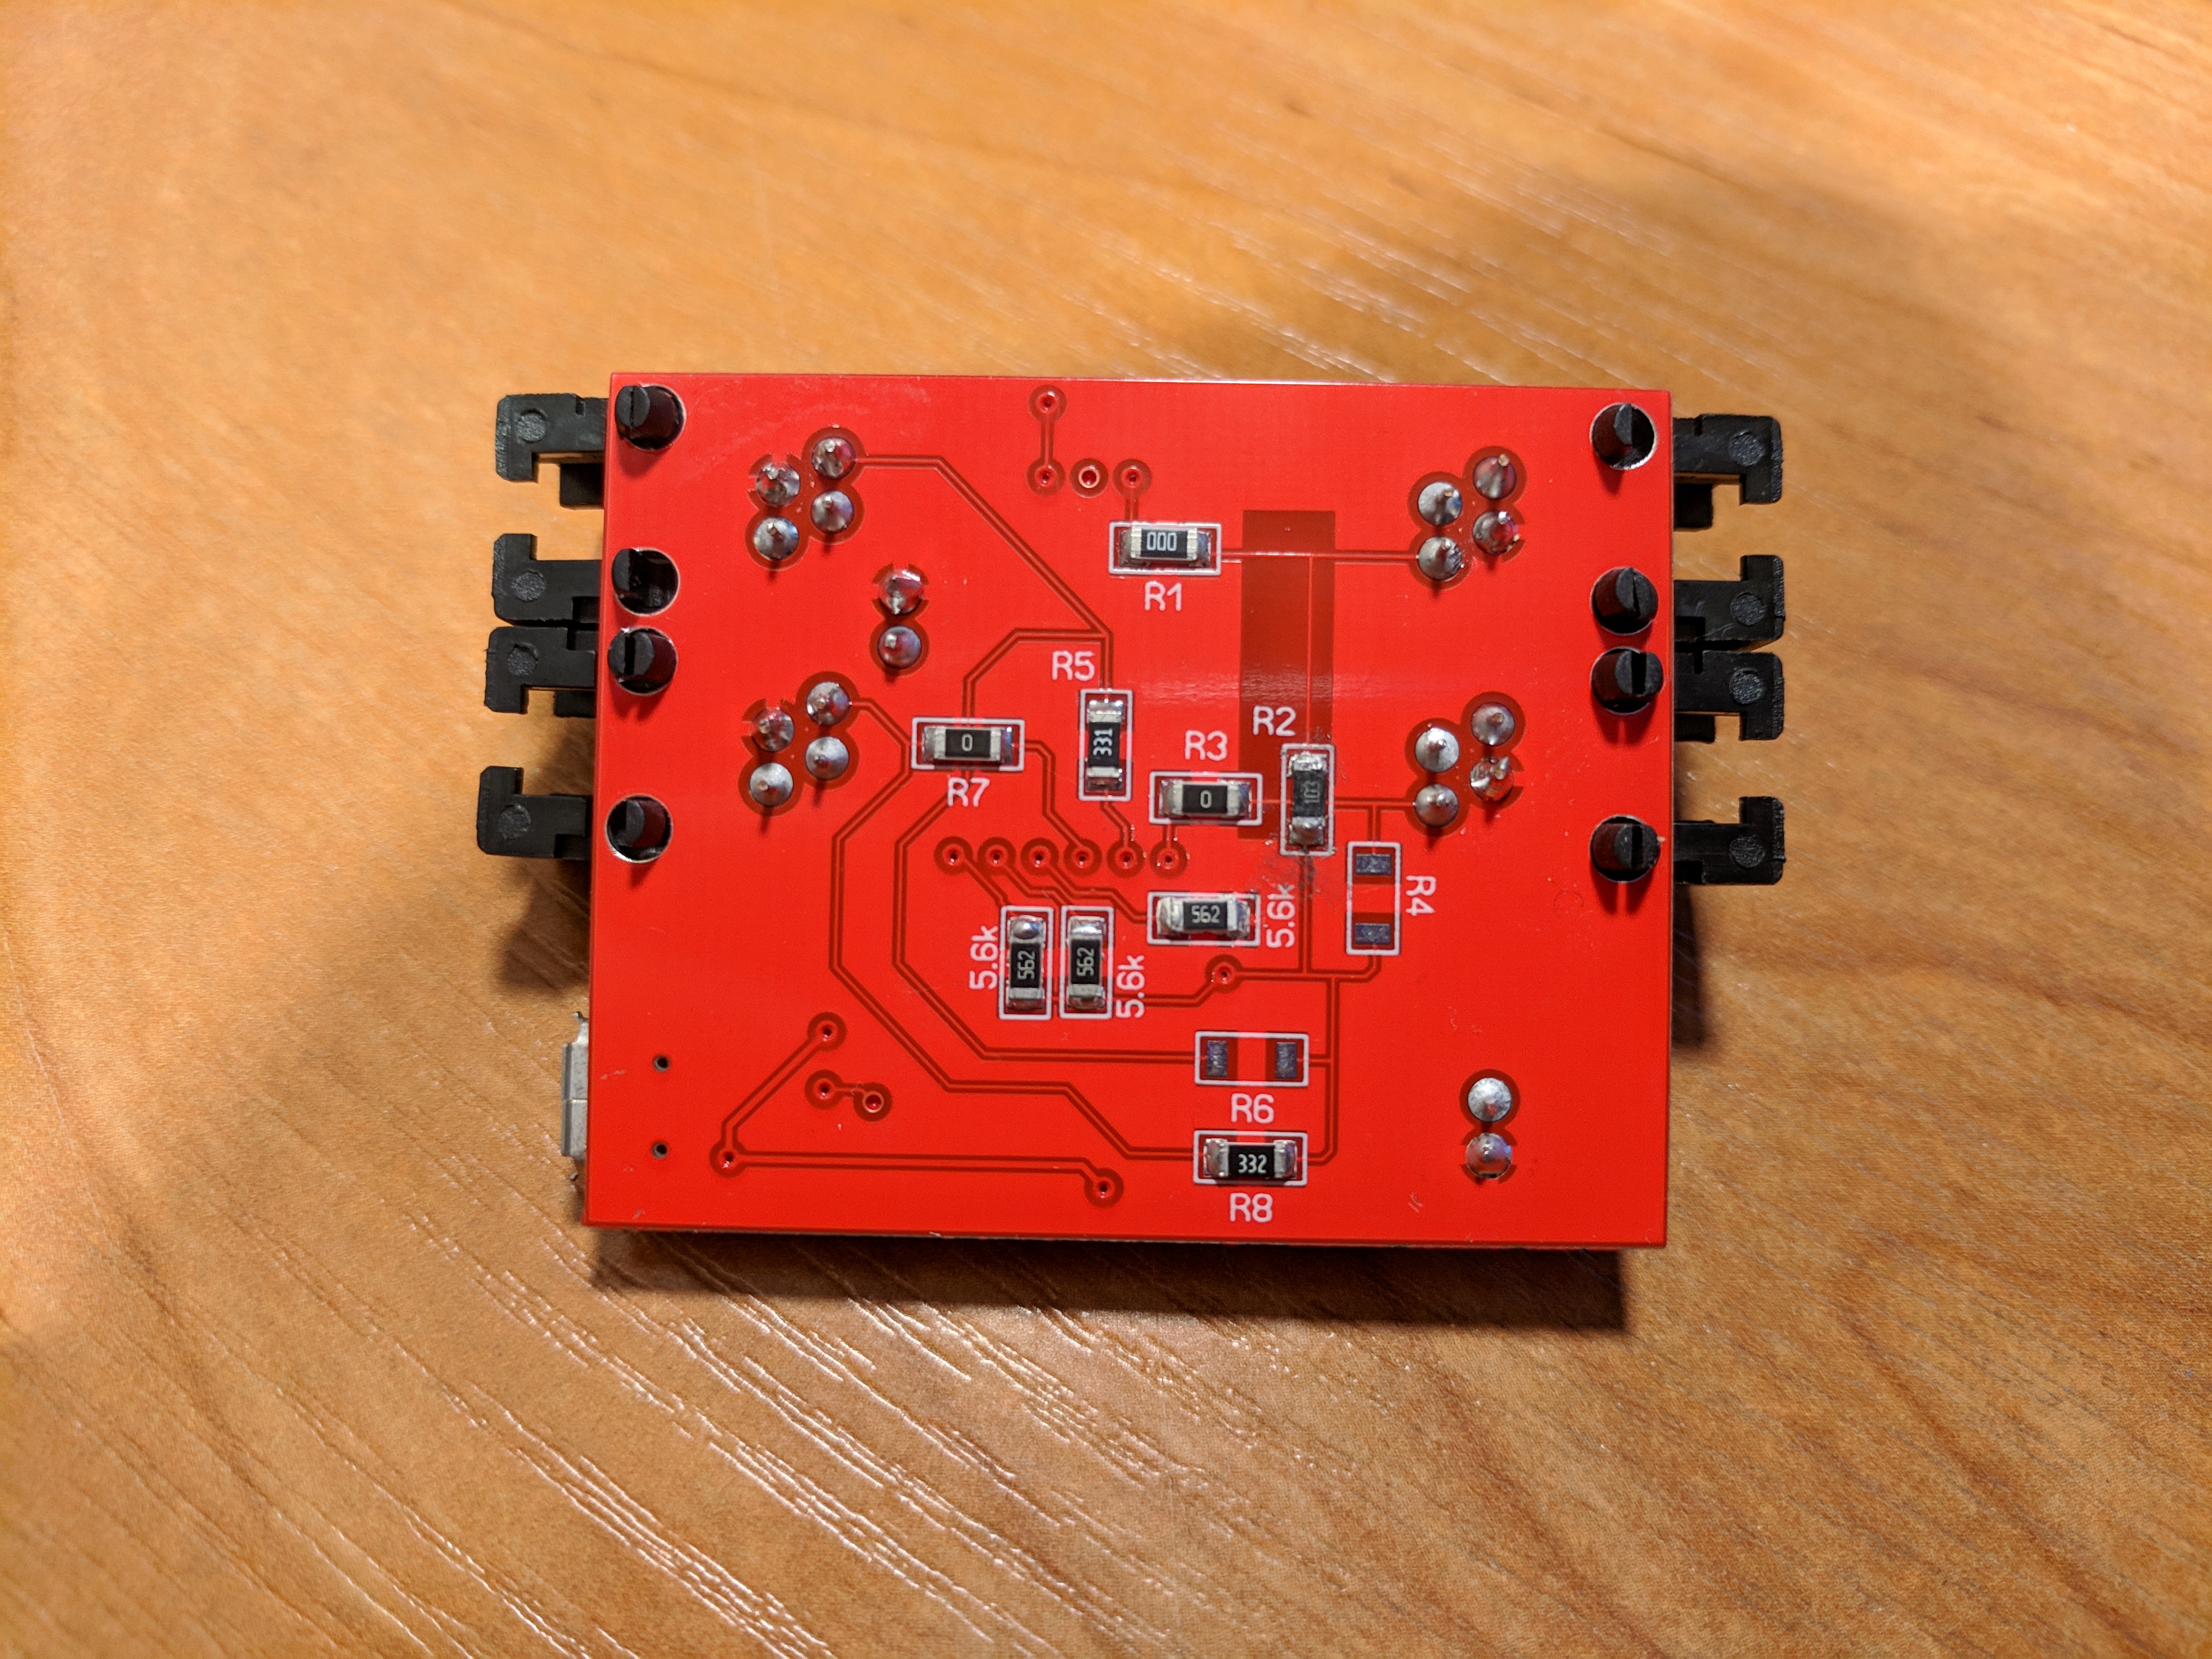
- Added auxiliary resistors (R1..R8), which allowed to configure the outputs as needed
Now each output can be configured for:
- LED connection
- connect button
- connection of counters (sensors)
When using a phototransistor and a leakage sensor, their minimum resistance may not be enough for the voltage to drop to a logic zero level. For this, a voltage divider was added to each output.

Let's calculate the voltage divider using the leakage sensor as an example. Let's say the sensor is connected to the M1 pin. It has auxiliary resistors R1 and R2. Power supply (U) ESP 3.3V. The resistance of a leakage sensor (Rd) when water hits it becomes 10k ohms. We need to ensure that the tension It was below the voltage level of logical zero. For ESP it is 0.8V, take 0.6V. we do not need, respectively, we assume equal to 0. The formula for calculating the voltage :
Select :
where Is the sensor resistance
Substitute the known values in the formula
, rounded to the nearest larger and get 47kOhm.
For a phototransistor, the calculation is done similarly, only Rd is equal to the resistance of the phototransistor when it is illuminated by an LED.
Firmware
As before, the firmware is assembled using an online constructor . The old script has been modified for 2 modes of operation: the reading of water meters and the reading of the meter. Accordingly, there are 2 configuration windows:

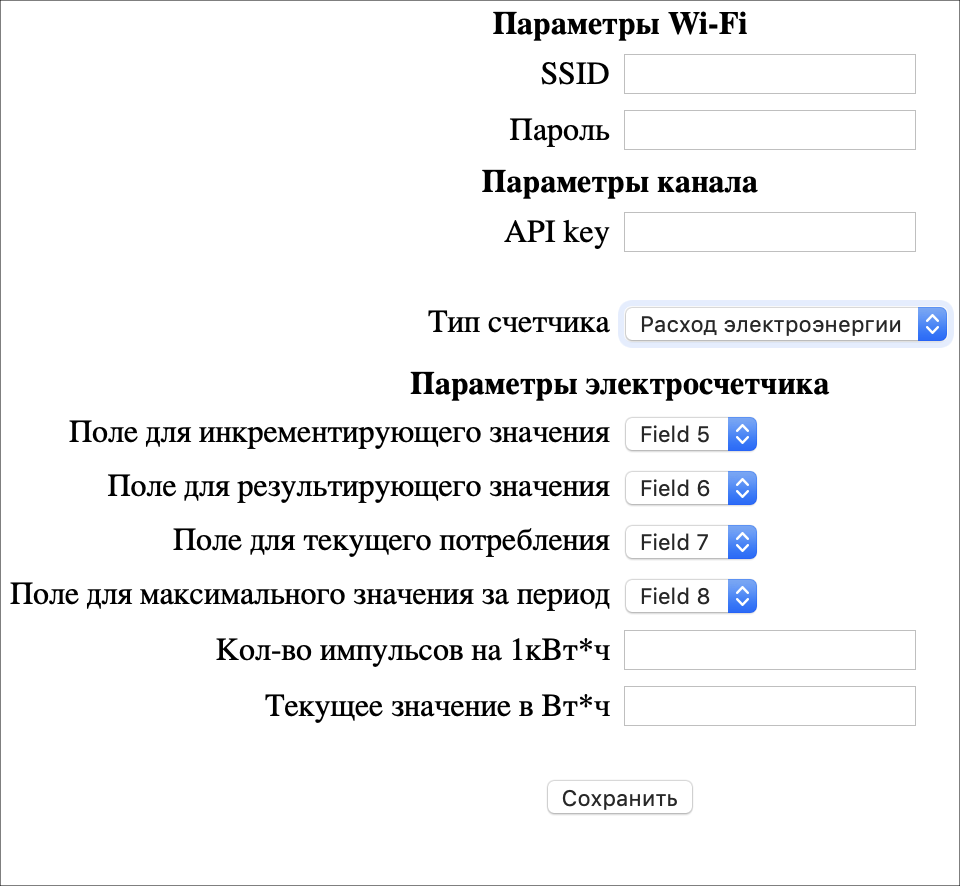
If you wish, you can combine everything and add something of your own. When debugging, I simultaneously connected 2 water meters, a leakage sensor and an LED.
In the mode of reading water meters, data is transmitted every 60 seconds, provided there have been any changes in the readings. In the metering mode, the data is transmitted every 20 seconds without any conditions. Data still being transmitted to thingspeak.com
Since in the new scheme there is no button to switch to the settings mode, it was decided to transfer the device to the settings mode for 60 seconds when loading. If within 60 seconds no one has connected to the device, then we start further the reading mode. If someone has connected, then exit the settings mode either by saving data on the page or by rebooting the device.
Completion of the application
The electricity meter readings needed to be transferred to a separate channel, so in the new version of the application I added the ability to add several channels. All data is stored in a local SQL database so that you can easily and quickly build graphs. Since I sent the data on the electric meter every 20 seconds. This affected the amount of data and, consequently, the speed of their receipt. For comparison, for all the time of reading the water meters about 72000 records have accumulated, and about 2.6 million for the electricity meter in about 7 months. After optimizing the queries to the database, we managed to increase the sampling speed several thousand times (I did not expect this increase).
In the new version were added:
- electric meter widget
- line charts
- the ability to share a widget or schedule with other people
- ability to work with multiple channels
- speed optimization
Total
After all the improvements, I can get the following information:
- current meter reading
- current consumption
- information on the consumption and consumption of electricity for a certain period of time
Of course, the question arises why I did not make the device autonomous (there are several articles on this topic on Habré). If you make the device autonomous, you need to transfer data several times a day, but I also wanted to see the data almost in real time.
The application can be used not only with my device, but also simply as a client to thingspeak.com to display any graphs or values. At the moment, the application beautifully displays the readings of water meters and electricity, if someone has other ideas that you can add, then write to me in a personal.
useful links
')
Source: https://habr.com/ru/post/428844/
All Articles