Proactive Oracle database performance optimization
The first thing we encounter when we talk about proactive optimization is that we don’t know what needs to be optimized. "Do this, I do not know what."
The main objectives of proactive optimization
The main tasks of proactive optimization are different from the tasks of reactive optimization and are as follows:
The last moment is the most important. In the case of reactive optimization, we do not have the task of reducing the consumption of resources as a whole, but only the task of reducing the response time of the functionality to the acceptable limits.
')
If you work with combat servers, then you have a good idea of what performance incidents mean. You need to drop everything and quickly solve the problem. RNKO "Payment Center" LLC works with many agents, and for them it is very important that such problems be as small as possible. Alexander Makarov on HighLoad ++ Siberia told what was done to significantly reduce the number of performance incidents. Proactive optimization came to the rescue. And why and how it is produced on the combat server, read below.

About Speaker: Alexander Makarov ( AL_IG_Makarov ) Lead Administrator of Oracle Database OOO NSC “Payment Center”. Despite the position, the administration, as such, is extremely limited, the main tasks are related to the maintenance of the complex and its development, in particular, the solution of performance problems.
Is optimization of the combat database proactive?
First, let's look at the terms that this report means by the words “proactive optimization of performance”. Sometimes you can meet the point of view that proactive optimization is when the analysis of problem areas is carried out before the application is launched. For example, we find out that some queries do not work optimally, because there is not enough index or an inefficient algorithm is used in the query, and this work is done on test servers.
Nevertheless, we in RNKO did this project on combat servers . Many times I have heard: “How so? You do it on a combat server - it means that this is not a proactive optimization of performance! ”Here we must remember the approach that is cultivated in ITIL. From the point of view of ITIL, we have:
In this sense, our actions are proactive. Despite the fact that we are solving a problem on the combat server, the problem itself has not yet arisen: the incident did not occur, we did not run and did not try to solve this problem in some short time.
So, in this report, proactiveity means precisely proactivity in the sense of ITIL , we solve the problem before a performance incident occurs.
Starting point
RNKO "Payment Center" serves 2 major systems:
The nature of the load on these systems is mixed (DSS + OLTP): there is something that works very quickly, there are reports, there are average loads.
We were faced with the fact that not very often, but with a certain frequency, there were performance incidents. Those who work with combat servers, imagine what it is. This means that you need to give up everything and quickly solve the problem, because at this time the client cannot receive the service, something either does not work at all, or works very slowly.
Since a lot of agents and clients are tied to our organization, this is very important for us. If we are not able to quickly eliminate performance incidents, then our customers will suffer in one way or another. For example, they will not be able to replenish a card or make a transfer. Therefore, we wondered what could be done to get rid of even these infrequent performance incidents. To work in a mode when it is necessary to drop everything and solve a problem is not quite right. We use sprints and make a work plan for the sprint. The presence of performance incidents is also a deviation from the work plan.
Need to do something with this!
Optimization approaches
We thought and came to understand the technology of proactive optimization. But before I talk about proactive optimization, I must say a few words about classical reactive optimization.
Reactive optimization
The script is simple, there is a combat server on which something happened: they started a report, clients receive extracts, at this time the current activity on the database is going on, and suddenly someone decided to update some voluminous reference book. The system starts to slow down. At this point, the client comes in and says: “I cannot do this and that” - we need to find the reason why he cannot do this.
Classic algorithm of actions:
Within the framework of the reactive approach, the main task is not so much to find the root cause itself and eliminate it as to make the system work normally. Elimination of the root causes can be addressed later. The main thing is to quickly restore the server to work so that the client can get the service.
The main objectives of reactive optimization
There are two main goals for reactive optimization:
1. Reduce response time .
An action, for example, the receipt of a report, statement, transaction, must be carried out for some regular time. It is necessary to make so that the time of receiving the service returns to acceptable for the client borders. Maybe the service is a little slower than usual, but for the client it is permissible. Then we consider that the performance incident has been resolved, and we start working on the root cause.
2. The increase in the number of processed objects per unit of time during batch processing .
When there is a batch transaction processing, you need to reduce the processing time for one object from the batch.
Pros of a reactive approach:
● A variety of tools and techniques is the main plus of the reactive approach.
We can use the monitoring tools to understand what the problem is: there is not enough CPU, threads, memory, or the disk system has slipped, or the logs are being slowly processed. There are a lot of tools and techniques for studying the current performance problem in the Oracle database.
● Desired response time is another plus point.
In the course of such work, we bring the situation to the permissible response time, that is, we do not try to reduce it to the minimum value, but reach a certain value and after this action we finish, because we consider that we have reached acceptable limits.
Cons reactive approach:
And how to work with performance incidents, if they have not happened yet? Let's try to formulate how to conduct proactive optimization to prevent such situations.
Proactive optimization
The first thing that we face is that it is not known what needs to be optimized. "Do this, I do not know what."
The main objectives of proactive optimization
The main tasks of proactive optimization are different from the tasks of reactive optimization and are as follows:
The last moment is the most important. In the case of reactive optimization, we do not have the task of reducing the consumption of resources as a whole, but only the task of reducing the response time of the functionality to the acceptable limits.
How to find bottlenecks in the database?
When we begin to think about this problem, immediately there are many subtasks. Need to hold:
If we try to simulate these problems on the test complex, we can face the fact that the problem that has arisen on the test server has nothing to do with the combat one. The reasons for this are many, starting with the fact that test servers are usually weaker. It is good if there is an opportunity to make a test server an exact copy of the combat one, but this does not guarantee that the load will be reproduced in the same way, because you need to accurately reproduce user activity and many more different factors that affect the final load. If you try to simulate this situation, then, by and large, no one guarantees that the exact same thing that happens on the battle server will be reproduced.
If in one case the problem arose because the new registry came, then in the other it may arise due to the fact that the user launched a huge report doing a large sort, due to which the temporary tablespace (temporary tablespace) was filled, and consequence, the system began to slow down. That is, the reasons may be different, and it is not always possible to predict them. Therefore, we have abandoned attempts to search for bottlenecks on test servers almost from the very beginning. We were repelled only from the combat server and from what was happening on it.
What to do in this case? Let's try to understand what resources in the first place, most likely, will be missed.
Reducing database resource consumption
Based on the industrial complexes we have at our disposal, the most frequent lack of resources is observed in disk readings and CPU . Therefore, first of all, we will look for weak spots in these areas.
The second important question: how to search for something?
The question is very non-trivial. We use Oracle Enterprise Edition with the Diagnostic Pack option and have found such a tool for ourselves - AWR reports (in other editions of Oracle, you can use STATSPACK reports ). In PostgreSQL there is an analogue - pgstatspack, there is pg_profile of Andrei Zubkov. The last product, as I understand it, appeared and began to develop only last year. For MySQL, I could not find similar tools, but I am not a MySQL specialist.
The approach itself is not tied to any particular kind of database. If there is an opportunity to get information on the system load from some report, then using the methodology I’m going to talk about now, you can perform work on proactive optimization on any base .
Optimization of top 5 operations
The technology of proactive optimization that we have developed and use in the NSCA “Payment Center” consists of four stages.
Step 1. Get the AWR report for the longest possible period.
The longest period of time is needed to average the load on different days of the week, as sometimes it is very different. For example, RBS-Retail Bank on Tuesday received registers for the last week, they begin to be processed, and all day we have a load above the average of about 2-3 times. On other days, the load is less.
If it is known that the system has some specificity - some days have more load, some days - less, then reports need to be received separately for these periods and work with them separately if we want to optimize specific time intervals . If you need to optimize the overall situation on the server, you can get a large report for the month, and see what really consumes server resources.
Sometimes there are very unexpected situations. For example, in the case of CFT-Bank, a request that checks the report server queue may fall into the top-10. Moreover, this request is official and does not execute any business logic, but only checks whether there is a report for execution or not.
Stage 2. We look at sections:
The remaining SQL sections of ordered by are examined as needed.
Step 3. Determine the parent operations and queries dependent on them.
The AWR report has separate sections where, depending on the version of Oracle, 15 or more top queries are shown in each of these sections. But these Oracle queries are mixed in the AWR report.
For example, there is a parent operation, inside it there can be 3 top queries. Oracle in the AWR report will show both the parent operation and all these 3 queries. Therefore, it is necessary to make an analysis of this list and see which operations specific requests belong to, group them.
Stage 4. We optimize the top 5 operations.
After such a grouping, the output is a list of operations from which you can choose the most difficult. We are limited to 5 operations (not requests, but operations). If the system is more complex, then you can take more.
Typical query design errors
During the application of this technique, we have compiled a small list of typical design errors. Some errors are so simple that it seems that they can not be.
● Missing index → Full scan
There are very incident cases, for example, with the absence of an index on the combat scheme. We had a concrete example, when the query worked for a long time quickly without an index. But there was a full scan, and as the size of the table gradually grew, the query began to work more slowly, and it took a little more time from quarter to quarter. In the end, we paid attention to it and it turned out that the index is not there.
● Large sample → Full scan
The second typical mistake is a large sample of data - a classic case of a full scan. Everyone knows that a full scan should be used only when it is truly justified. Sometimes there are cases when you get a full scan where you could do without it, for example, if you transfer the filtering conditions from the pl / sql-code to the query.
● Inefficient index → Long INDEX RANGE SCAN
Perhaps this is even the most common mistake, about which for some reason they say very little, the so-called inefficient index (long index scan, long INDEX RANGE SCAN). For example, we have a table by registry. In the request, we are trying to find all the registries of this agent, and ultimately add some filtering condition, for example, for a certain period, or with a certain number, or a specific client. In such situations, the index is usually built only across the "agent" field for reasons of universality of use. The result is the following picture: in the first year of work, say, the agent had 100 entries in this table, next year there were 1,000, in a year there could be 10,000 entries. Some time passes, these records become 100,000. Obviously, the request starts to work slowly, because not only the agent identifier itself should be added to the request, but also some additional filter, in this case by date. Otherwise it will turn out that the sample size will increase from year to year as the number of registries for this agent grows. This problem must be solved at the index level. If the data becomes too much, then you should already think in the direction of partitioning.
● Unnecessary distributive code branches
This is also a curious case, but, nevertheless, it happens. We look in the top queries, and we see there some strange queries. We come to the developers and say: "We found some queries, let's look at it and see what can be done with this." The developer thinks about it, then comes after a while and says: “In your system, this branch of the code should not be. You do not use this functionality. " Then the developer recommends enabling some special settings to work around this section of code.
Examples from practice
Now I would like to consider two examples from our real practice. When we deal with the top queries, of course, we first of all think that there must be something megatey, nontrivial, with complex operations. In fact, this is not always the case. Sometimes there are cases when very simple queries get to the top of operations.
Example 1
In this example, the query is from just two tables, and these are not heavy tables — just a few million entries. It would seem, what is easier? However, the request hit the top.
Let's try to figure out what's wrong with him.
Below is a picture of Enterprise Manager Cloud Control - data on the statistics of this query (Oracle has such a tool). It can be seen that there is a regular load on this request (the upper graph). The number 1 on the side indicates that on average, no more than one session is working. The green diagram shows that the query uses only the CPU , which is doubly interesting.

Let's try to figure out what is happening here?

Above table with statistics on request. Almost 700 thousand launches - this will not surprise anyone. But the time interval from First Load Time December 15th to Last Load Time December 22nd (see previous image) is one week. If you count the number of starts per second, it turns out that the request is on average every second .
We look further. Request execution time 0.93 seconds, i.e. less than a second, that's wonderful. You can be happy - the request is not heavy. Nevertheless, he hit the top, it means consumes a lot of resources. Where does it consume a lot of resources?
The table has a line on logical reads. We see that for one launch it requires almost 8 thousand blocks (usually 1 block is 8 KB). It turns out that the request, working once per second, loads approximately 64 MB of data from memory. Something is not right here, you need to understand.
Let's see the plan: there is a full scan. Well, let's go further.
In the rnko_dep_reestr_in_oper table, there are only 5 million lines and their average line length is 150 bytes. But it turned out that there is not enough index for the field that is connecting - the subquery connects to the request through the ean_rnko field, for which there is no index!
Moreover, even if it appears, in fact, the situation will not be very good. A long index scan will occur (long INDEX RANGE SCAN). ean_rnko is an internal agent identifier. Registers on the agent will accumulate, and every year the amount of data that this query will select will increase, and the query will slow down.
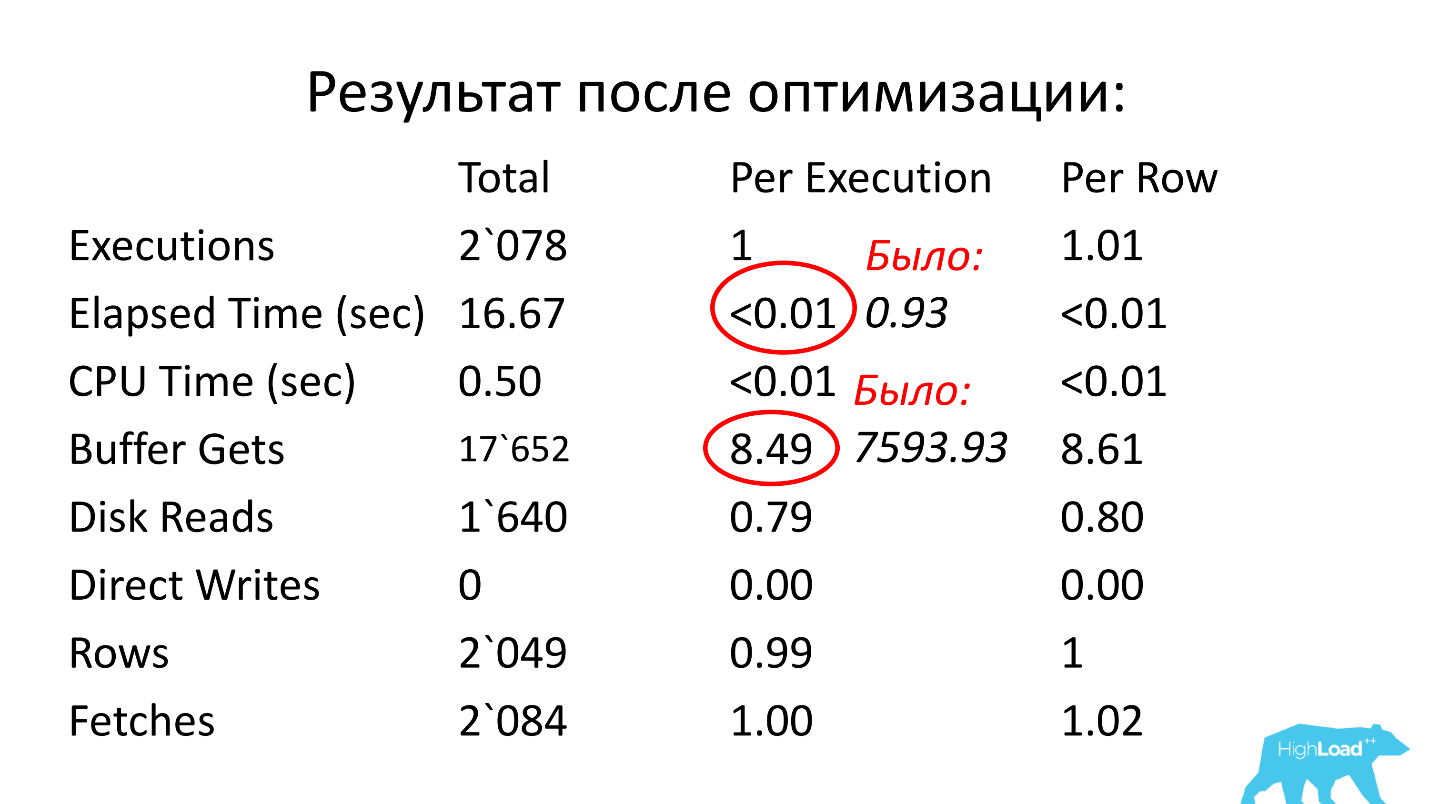
Solution: create an index on the ean_rnko and date_reg fields, ask the developers to limit the scanning depth by date in this query. Then you can at least to some extent guarantee that the query performance will remain approximately at the same boundaries, since the sample size will be limited to a fixed time interval and you will not need to read the entire table. This is a very important point, look what happened.
After optimization, the operating time was less than a hundredth of a second (it was 0.93), the number of blocks was on average 8.5 - less than 1000 times than it was.
Example 2
I started the story by saying that usually something difficult is expected in the top queries. Above is an example of a “complex” query that goes to one table (!), And it also hit the top of queries :) There is an index on the ID_PROCESSING field!
There are 3 IS NULL conditions in this query, and, as we know, such conditions are not indexed (you cannot use the index in this case). Plus, there are only two conditions of the equality type (by ID_PROCESSING and STATUS).
Probably, a developer who would look at this request would first of all suggest making an index on ID_PROCESSING and STATUS. But given the amount of data that will be selected (there will be a lot of them), this decision does not work.
However, the request consumes a lot of resources, which means that you need to do something to make it work faster. Let's try to understand the reasons.

The above statistics are for 1 day, from which it can be seen that the query runs every 5 minutes. The main resource consumption is CPU and disk read. Below on the graph with the statistics of the number of launches of the request, it is clear that, in general, everything is fine - the number of launches does not change much over time - a fairly stable situation.

And if you look further, it can be seen that the query's working time sometimes changes quite strongly - several times, which is already significant.
Let's understand further.
Oracle Enterprise Manager has a SQL-Monitoring utility. This utility can be viewed in real time consumption request resources.

Above report for problem query. First of all, we should be interested in the fact that INDEX RANGE SCAN (bottom line) in the Actual Rows column shows 17 million lines. Probably worth thinking about.
If you look further at the implementation plan, it turns out that after the next paragraph of the plan, out of these 17 million lines, only 1705 remain. The question is, why was 17 million chosen? In the final sample, approximately 0.01% remained, that is , the obviously ineffective, unnecessary work was performed . Moreover, this work is done every 5 minutes. Here is the problem! Therefore, this query is in the top queries.
Let's try to solve this non-trivial problem. The index, which suggests itself in the first place, is ineffective, so you need to come up with something tricky and defeat the IS NULL conditions.
New index
We conferred with the developers, thought, and came to this solution: we made a functional index, in which there is an ID_PROCESSING column, which was equal to the query condition, and all the other fields included this function as arguments:
This deterministic function, that is, on the same set of parameters, always produces the same answer. We have made it so that this function actually produces always one value — in this case, “U”. When all of these conditions are met, a “U” is issued; when not, NULL. Such a functional index makes it possible to effectively filter data.
The application of this index led to the following result:
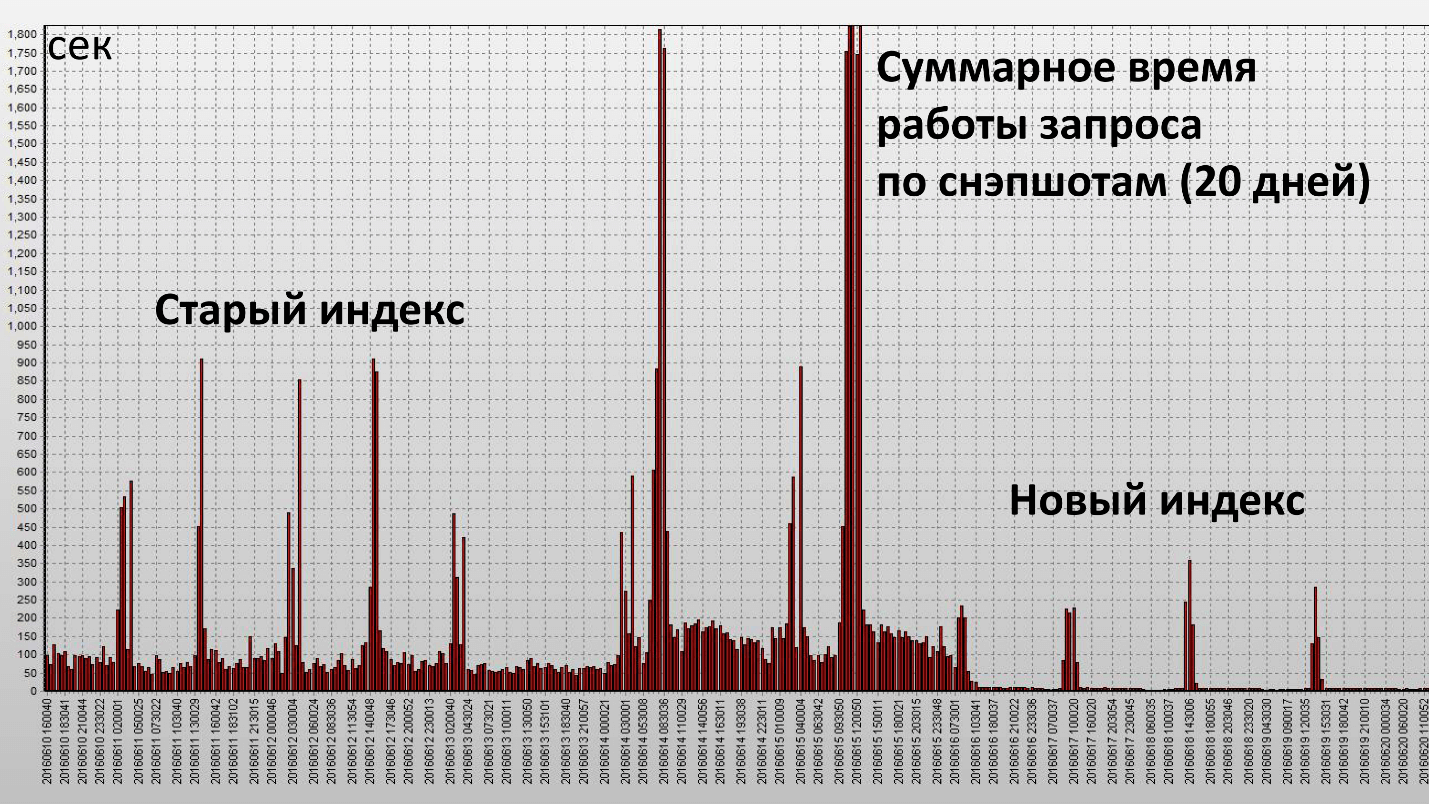
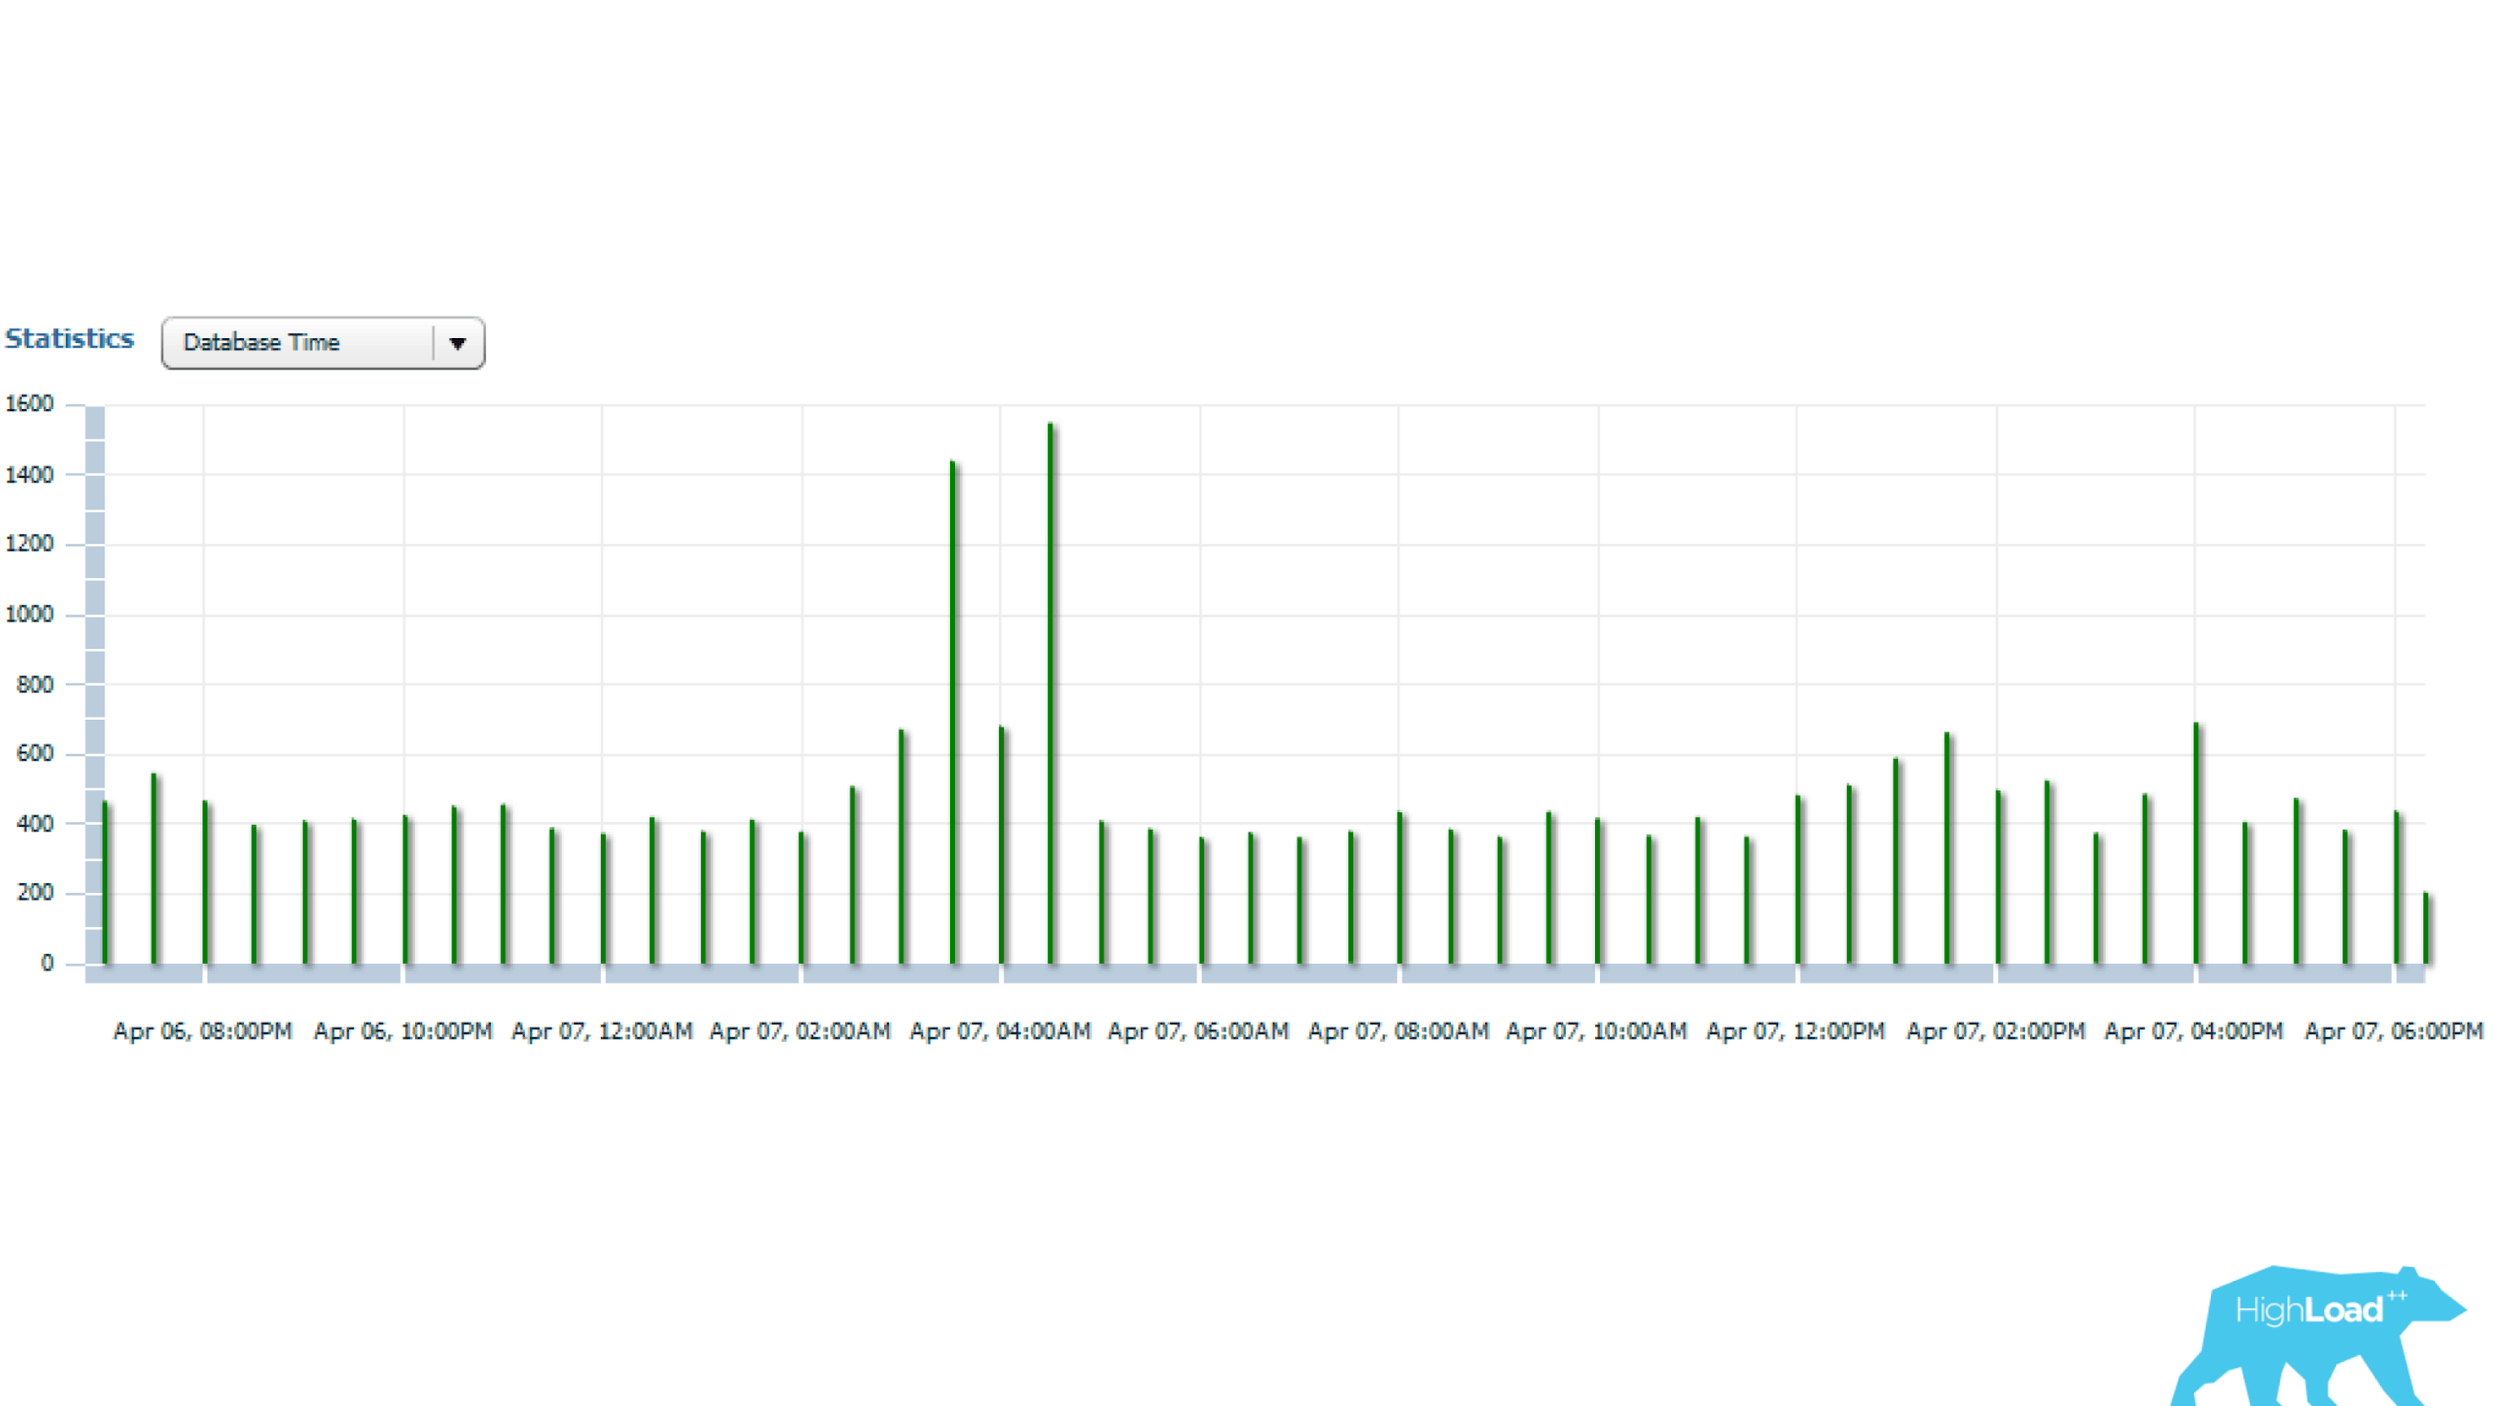
Here one column is one snapshot, they are made every half hour of the database operation. We achieved our goal and this index turned out to be really effective. Let's see the quantitative characteristics:
Operating time decreased 2.5 times, and resource consumption (Buffer Gets) - about 4. The number of data blocks read from the disk has decreased very significantly.
Results of applying proactive optimization
We got:
Performance incidents decreased 10 times . This is a subjective value, before the incidents occurred at the RBS-Retail Bank complex 1–2 times a month steadily, and now we have practically forgotten about them.
Then the question arises - and where does software performance incidents? We did not deal with them directly?
Let's return to the last schedule. If you remember, there was a full scan, it was required to store in memory a large number of blocks. Since the request was executed regularly, all these blocks were stored in the Oracle cache. In this case, it turns out that if a high load occurs in the database at this time, for example, someone will actively use the memory, a cache will be needed to store data blocks. Thus, part of the data for our request will be pushed, and therefore, will have to do physical readings. If you do physical readings, the query time will immediately increase enormously.
Logical reading is working with memory, it happens quickly, and any access to the disk is slow (if you look at the time, milliseconds). If you're lucky, and in the cache of the operating system or in the cache of the array there is this data, it will still be dozens of microseconds. Reading from the cache of Oracle itself is much faster.
When we got rid of the full scan, there was no need to keep such a large number of blocks in the cache (Buffer Cache). When there is a shortage of these resources, the query is more or less stable. No longer observed such large bursts, which were with the old index.
Results on proactive optimization:
There are a lot of tools for obtaining statistical data in the Oracle database:
Some of these tools work in the console, that is, they are not tied to Enterprise Manager.
Bonus: the specialists of NNKO “Payment Center” and CFT were well prepared for the conference in Novosibirsk, made several useful presentations, and also organized a real outbound radio. Two days later, experts, speakers, and organizers visited the radio of the CFT radio. You can move from the Siberian summer by including records, here are the links to the blocks: Kubernetes: pros and cons ; Data Science & Machine Learning ; DevOps .
- No classic algorithm.
- The problem has not yet arisen (unknown), and one can only guess where it may be.
- We need to find some potential weaknesses in the system.
- Try to optimize the work of requests in these places.
The main objectives of proactive optimization
The main tasks of proactive optimization are different from the tasks of reactive optimization and are as follows:
- getting rid of bottlenecks in the database;
- decrease in database consumption.
The last moment is the most important. In the case of reactive optimization, we do not have the task of reducing the consumption of resources as a whole, but only the task of reducing the response time of the functionality to the acceptable limits.
')
If you work with combat servers, then you have a good idea of what performance incidents mean. You need to drop everything and quickly solve the problem. RNKO "Payment Center" LLC works with many agents, and for them it is very important that such problems be as small as possible. Alexander Makarov on HighLoad ++ Siberia told what was done to significantly reduce the number of performance incidents. Proactive optimization came to the rescue. And why and how it is produced on the combat server, read below.
About Speaker: Alexander Makarov ( AL_IG_Makarov ) Lead Administrator of Oracle Database OOO NSC “Payment Center”. Despite the position, the administration, as such, is extremely limited, the main tasks are related to the maintenance of the complex and its development, in particular, the solution of performance problems.
Is optimization of the combat database proactive?
First, let's look at the terms that this report means by the words “proactive optimization of performance”. Sometimes you can meet the point of view that proactive optimization is when the analysis of problem areas is carried out before the application is launched. For example, we find out that some queries do not work optimally, because there is not enough index or an inefficient algorithm is used in the query, and this work is done on test servers.
Nevertheless, we in RNKO did this project on combat servers . Many times I have heard: “How so? You do it on a combat server - it means that this is not a proactive optimization of performance! ”Here we must remember the approach that is cultivated in ITIL. From the point of view of ITIL, we have:
- performance incidents are what have already happened;
- measures we take to prevent performance incidents from happening.
In this sense, our actions are proactive. Despite the fact that we are solving a problem on the combat server, the problem itself has not yet arisen: the incident did not occur, we did not run and did not try to solve this problem in some short time.
So, in this report, proactiveity means precisely proactivity in the sense of ITIL , we solve the problem before a performance incident occurs.
Starting point
RNKO "Payment Center" serves 2 major systems:
- RBS-Retail Bank;
- CFT Bank.
The nature of the load on these systems is mixed (DSS + OLTP): there is something that works very quickly, there are reports, there are average loads.
We were faced with the fact that not very often, but with a certain frequency, there were performance incidents. Those who work with combat servers, imagine what it is. This means that you need to give up everything and quickly solve the problem, because at this time the client cannot receive the service, something either does not work at all, or works very slowly.
Since a lot of agents and clients are tied to our organization, this is very important for us. If we are not able to quickly eliminate performance incidents, then our customers will suffer in one way or another. For example, they will not be able to replenish a card or make a transfer. Therefore, we wondered what could be done to get rid of even these infrequent performance incidents. To work in a mode when it is necessary to drop everything and solve a problem is not quite right. We use sprints and make a work plan for the sprint. The presence of performance incidents is also a deviation from the work plan.
Need to do something with this!
Optimization approaches
We thought and came to understand the technology of proactive optimization. But before I talk about proactive optimization, I must say a few words about classical reactive optimization.
Reactive optimization
The script is simple, there is a combat server on which something happened: they started a report, clients receive extracts, at this time the current activity on the database is going on, and suddenly someone decided to update some voluminous reference book. The system starts to slow down. At this point, the client comes in and says: “I cannot do this and that” - we need to find the reason why he cannot do this.
Classic algorithm of actions:
- Reproduce the problem.
- Localize the problem area.
- Optimize problem space.
Within the framework of the reactive approach, the main task is not so much to find the root cause itself and eliminate it as to make the system work normally. Elimination of the root causes can be addressed later. The main thing is to quickly restore the server to work so that the client can get the service.
The main objectives of reactive optimization
There are two main goals for reactive optimization:
1. Reduce response time .
An action, for example, the receipt of a report, statement, transaction, must be carried out for some regular time. It is necessary to make so that the time of receiving the service returns to acceptable for the client borders. Maybe the service is a little slower than usual, but for the client it is permissible. Then we consider that the performance incident has been resolved, and we start working on the root cause.
2. The increase in the number of processed objects per unit of time during batch processing .
When there is a batch transaction processing, you need to reduce the processing time for one object from the batch.
Pros of a reactive approach:
● A variety of tools and techniques is the main plus of the reactive approach.
We can use the monitoring tools to understand what the problem is: there is not enough CPU, threads, memory, or the disk system has slipped, or the logs are being slowly processed. There are a lot of tools and techniques for studying the current performance problem in the Oracle database.
● Desired response time is another plus point.
In the course of such work, we bring the situation to the permissible response time, that is, we do not try to reduce it to the minimum value, but reach a certain value and after this action we finish, because we consider that we have reached acceptable limits.
Cons reactive approach:
- Performance incidents remain - this is the biggest disadvantage of the reactive approach, because we cannot always reach the root cause. She could have stayed away somewhere and lay somewhere deeper, despite the fact that we achieved acceptable performance.
And how to work with performance incidents, if they have not happened yet? Let's try to formulate how to conduct proactive optimization to prevent such situations.
Proactive optimization
The first thing that we face is that it is not known what needs to be optimized. "Do this, I do not know what."
- No classic algorithm.
- The problem has not yet arisen (unknown), and one can only guess where it may be.
- We need to find some potential weaknesses in the system.
- Try to optimize the work of requests in these places.
The main objectives of proactive optimization
The main tasks of proactive optimization are different from the tasks of reactive optimization and are as follows:
- getting rid of bottlenecks in the database;
- decrease in database consumption.
The last moment is the most important. In the case of reactive optimization, we do not have the task of reducing the consumption of resources as a whole, but only the task of reducing the response time of the functionality to the acceptable limits.
How to find bottlenecks in the database?
When we begin to think about this problem, immediately there are many subtasks. Need to hold:
- load testing on the CPU;
- load testing by read / write;
- load testing by the number of active sessions;
- load testing on ... etc.
If we try to simulate these problems on the test complex, we can face the fact that the problem that has arisen on the test server has nothing to do with the combat one. The reasons for this are many, starting with the fact that test servers are usually weaker. It is good if there is an opportunity to make a test server an exact copy of the combat one, but this does not guarantee that the load will be reproduced in the same way, because you need to accurately reproduce user activity and many more different factors that affect the final load. If you try to simulate this situation, then, by and large, no one guarantees that the exact same thing that happens on the battle server will be reproduced.
If in one case the problem arose because the new registry came, then in the other it may arise due to the fact that the user launched a huge report doing a large sort, due to which the temporary tablespace (temporary tablespace) was filled, and consequence, the system began to slow down. That is, the reasons may be different, and it is not always possible to predict them. Therefore, we have abandoned attempts to search for bottlenecks on test servers almost from the very beginning. We were repelled only from the combat server and from what was happening on it.
What to do in this case? Let's try to understand what resources in the first place, most likely, will be missed.
Reducing database resource consumption
Based on the industrial complexes we have at our disposal, the most frequent lack of resources is observed in disk readings and CPU . Therefore, first of all, we will look for weak spots in these areas.
The second important question: how to search for something?
The question is very non-trivial. We use Oracle Enterprise Edition with the Diagnostic Pack option and have found such a tool for ourselves - AWR reports (in other editions of Oracle, you can use STATSPACK reports ). In PostgreSQL there is an analogue - pgstatspack, there is pg_profile of Andrei Zubkov. The last product, as I understand it, appeared and began to develop only last year. For MySQL, I could not find similar tools, but I am not a MySQL specialist.
The approach itself is not tied to any particular kind of database. If there is an opportunity to get information on the system load from some report, then using the methodology I’m going to talk about now, you can perform work on proactive optimization on any base .
Optimization of top 5 operations
The technology of proactive optimization that we have developed and use in the NSCA “Payment Center” consists of four stages.
Step 1. Get the AWR report for the longest possible period.
The longest period of time is needed to average the load on different days of the week, as sometimes it is very different. For example, RBS-Retail Bank on Tuesday received registers for the last week, they begin to be processed, and all day we have a load above the average of about 2-3 times. On other days, the load is less.
If it is known that the system has some specificity - some days have more load, some days - less, then reports need to be received separately for these periods and work with them separately if we want to optimize specific time intervals . If you need to optimize the overall situation on the server, you can get a large report for the month, and see what really consumes server resources.
Sometimes there are very unexpected situations. For example, in the case of CFT-Bank, a request that checks the report server queue may fall into the top-10. Moreover, this request is official and does not execute any business logic, but only checks whether there is a report for execution or not.
Stage 2. We look at sections:
- SQL ordered by Elapsed Time - SQL queries sorted by execution time;
- SQL ordered by CPU Time - by CPU usage;
- SQL ordered by Gets - by logical reads;
- SQL ordered by Reads - for physical reads.
The remaining SQL sections of ordered by are examined as needed.
Step 3. Determine the parent operations and queries dependent on them.
The AWR report has separate sections where, depending on the version of Oracle, 15 or more top queries are shown in each of these sections. But these Oracle queries are mixed in the AWR report.
For example, there is a parent operation, inside it there can be 3 top queries. Oracle in the AWR report will show both the parent operation and all these 3 queries. Therefore, it is necessary to make an analysis of this list and see which operations specific requests belong to, group them.
Stage 4. We optimize the top 5 operations.
After such a grouping, the output is a list of operations from which you can choose the most difficult. We are limited to 5 operations (not requests, but operations). If the system is more complex, then you can take more.
Typical query design errors
During the application of this technique, we have compiled a small list of typical design errors. Some errors are so simple that it seems that they can not be.
● Missing index → Full scan
There are very incident cases, for example, with the absence of an index on the combat scheme. We had a concrete example, when the query worked for a long time quickly without an index. But there was a full scan, and as the size of the table gradually grew, the query began to work more slowly, and it took a little more time from quarter to quarter. In the end, we paid attention to it and it turned out that the index is not there.
● Large sample → Full scan
The second typical mistake is a large sample of data - a classic case of a full scan. Everyone knows that a full scan should be used only when it is truly justified. Sometimes there are cases when you get a full scan where you could do without it, for example, if you transfer the filtering conditions from the pl / sql-code to the query.
● Inefficient index → Long INDEX RANGE SCAN
Perhaps this is even the most common mistake, about which for some reason they say very little, the so-called inefficient index (long index scan, long INDEX RANGE SCAN). For example, we have a table by registry. In the request, we are trying to find all the registries of this agent, and ultimately add some filtering condition, for example, for a certain period, or with a certain number, or a specific client. In such situations, the index is usually built only across the "agent" field for reasons of universality of use. The result is the following picture: in the first year of work, say, the agent had 100 entries in this table, next year there were 1,000, in a year there could be 10,000 entries. Some time passes, these records become 100,000. Obviously, the request starts to work slowly, because not only the agent identifier itself should be added to the request, but also some additional filter, in this case by date. Otherwise it will turn out that the sample size will increase from year to year as the number of registries for this agent grows. This problem must be solved at the index level. If the data becomes too much, then you should already think in the direction of partitioning.
● Unnecessary distributive code branches
This is also a curious case, but, nevertheless, it happens. We look in the top queries, and we see there some strange queries. We come to the developers and say: "We found some queries, let's look at it and see what can be done with this." The developer thinks about it, then comes after a while and says: “In your system, this branch of the code should not be. You do not use this functionality. " Then the developer recommends enabling some special settings to work around this section of code.
Examples from practice
Now I would like to consider two examples from our real practice. When we deal with the top queries, of course, we first of all think that there must be something megatey, nontrivial, with complex operations. In fact, this is not always the case. Sometimes there are cases when very simple queries get to the top of operations.
Example 1
select * from (select o.* from rnko_dep_reestr_in_oper o where o.type_oper = 'proc' and o.ean_rnko in (select l.ean_rnko from rnko_dep_link l where l.s_rnko = :1) order by o.date_oper_bnk desc, o.date_reg desc) where ROWNUM = 1 In this example, the query is from just two tables, and these are not heavy tables — just a few million entries. It would seem, what is easier? However, the request hit the top.
Let's try to figure out what's wrong with him.
Below is a picture of Enterprise Manager Cloud Control - data on the statistics of this query (Oracle has such a tool). It can be seen that there is a regular load on this request (the upper graph). The number 1 on the side indicates that on average, no more than one session is working. The green diagram shows that the query uses only the CPU , which is doubly interesting.
Let's try to figure out what is happening here?
Above table with statistics on request. Almost 700 thousand launches - this will not surprise anyone. But the time interval from First Load Time December 15th to Last Load Time December 22nd (see previous image) is one week. If you count the number of starts per second, it turns out that the request is on average every second .
We look further. Request execution time 0.93 seconds, i.e. less than a second, that's wonderful. You can be happy - the request is not heavy. Nevertheless, he hit the top, it means consumes a lot of resources. Where does it consume a lot of resources?
The table has a line on logical reads. We see that for one launch it requires almost 8 thousand blocks (usually 1 block is 8 KB). It turns out that the request, working once per second, loads approximately 64 MB of data from memory. Something is not right here, you need to understand.
Let's see the plan: there is a full scan. Well, let's go further.
Plan hash value: 634977963 ------------------------------------------------------------------- | Id | Operation | Name | ------------------------------------------------------------------- | 0 | SELECT STATEMENT | | |* 1 | COUNT STOPKEY | | | 2 | VIEW | | |* 3 | SORT ORDER BY STOPKEY | | | 4 | NESTED LOOPS | | | 5 | TABLE ACCESS BY INDEX ROWID| RNKO_DEP_LINK | |* 6 | INDEX UNIQUE SCAN | UK_RNKODEPLINK$S_RNKO | |* 7 | TABLE ACCESS FULL | RNKO_DEP_REESTR_IN_OPER | ------------------------------------------------------------------- Predicate Information (identified by operation id): 1 - filter(ROWNUM=1) 3 - filter(ROWNUM=1) 6 - access("L"."S_RNKO"=:1) 7 - filter(("O"."TYPE_OPER"='proc' AND "O"."EAN_RNKO"="L"."EAN_RNKO")) In the rnko_dep_reestr_in_oper table, there are only 5 million lines and their average line length is 150 bytes. But it turned out that there is not enough index for the field that is connecting - the subquery connects to the request through the ean_rnko field, for which there is no index!
Moreover, even if it appears, in fact, the situation will not be very good. A long index scan will occur (long INDEX RANGE SCAN). ean_rnko is an internal agent identifier. Registers on the agent will accumulate, and every year the amount of data that this query will select will increase, and the query will slow down.
Solution: create an index on the ean_rnko and date_reg fields, ask the developers to limit the scanning depth by date in this query. Then you can at least to some extent guarantee that the query performance will remain approximately at the same boundaries, since the sample size will be limited to a fixed time interval and you will not need to read the entire table. This is a very important point, look what happened.
After optimization, the operating time was less than a hundredth of a second (it was 0.93), the number of blocks was on average 8.5 - less than 1000 times than it was.
Example 2
select count(1) from loy$barcodes t where t.id_processing = :b1 and t.id_rec_out is null and not t.barcode is null and t.status = 'u' and not t.id_card is null I started the story by saying that usually something difficult is expected in the top queries. Above is an example of a “complex” query that goes to one table (!), And it also hit the top of queries :) There is an index on the ID_PROCESSING field!
There are 3 IS NULL conditions in this query, and, as we know, such conditions are not indexed (you cannot use the index in this case). Plus, there are only two conditions of the equality type (by ID_PROCESSING and STATUS).
Probably, a developer who would look at this request would first of all suggest making an index on ID_PROCESSING and STATUS. But given the amount of data that will be selected (there will be a lot of them), this decision does not work.
However, the request consumes a lot of resources, which means that you need to do something to make it work faster. Let's try to understand the reasons.
The above statistics are for 1 day, from which it can be seen that the query runs every 5 minutes. The main resource consumption is CPU and disk read. Below on the graph with the statistics of the number of launches of the request, it is clear that, in general, everything is fine - the number of launches does not change much over time - a fairly stable situation.
And if you look further, it can be seen that the query's working time sometimes changes quite strongly - several times, which is already significant.
Let's understand further.
Oracle Enterprise Manager has a SQL-Monitoring utility. This utility can be viewed in real time consumption request resources.
Above report for problem query. First of all, we should be interested in the fact that INDEX RANGE SCAN (bottom line) in the Actual Rows column shows 17 million lines. Probably worth thinking about.
If you look further at the implementation plan, it turns out that after the next paragraph of the plan, out of these 17 million lines, only 1705 remain. The question is, why was 17 million chosen? In the final sample, approximately 0.01% remained, that is , the obviously ineffective, unnecessary work was performed . Moreover, this work is done every 5 minutes. Here is the problem! Therefore, this query is in the top queries.
Let's try to solve this non-trivial problem. The index, which suggests itself in the first place, is ineffective, so you need to come up with something tricky and defeat the IS NULL conditions.
New index
We conferred with the developers, thought, and came to this solution: we made a functional index, in which there is an ID_PROCESSING column, which was equal to the query condition, and all the other fields included this function as arguments:
create index gc.loy$barcod_unload_i on gc.loy$barcodes (gc.loy_barcodes_ic_unload(id_rec_out, barcode, id_card, status), id_processing); function loy_barcodes_ic_unload( pIdRecOut in loy$barcodes.id_rec_out%type, pBarcode in loy$barcodes.barcode%type, pIdCard in loy$barcodes.id_card%type, pStatus in loy$barcodes.status%type) return varchar2 deterministic is vRes varchar2(1) := ''; begin if pIdRecOut is null and pBarcode is not null and pIdCard is not null and pStatus = 'U' then vRes := pStatus; end if; return vRes; end loy_barcodes_ic_unload; This deterministic function, that is, on the same set of parameters, always produces the same answer. We have made it so that this function actually produces always one value — in this case, “U”. When all of these conditions are met, a “U” is issued; when not, NULL. Such a functional index makes it possible to effectively filter data.
The application of this index led to the following result:
Here one column is one snapshot, they are made every half hour of the database operation. We achieved our goal and this index turned out to be really effective. Let's see the quantitative characteristics:
| Average statistics for the request | ||
| BEFORE | AFTER | |
| Elapsed Time, sec | 143.21 | 60.7 |
| CPU Time, sec | 33.23 | 45.38 |
| Buffer Gets, block | 6`288`237.67 | 1`589`836 |
| Disk Reads, block | 266`600.33 | 2`680 |
Operating time decreased 2.5 times, and resource consumption (Buffer Gets) - about 4. The number of data blocks read from the disk has decreased very significantly.
Results of applying proactive optimization
We got:
- reducing the load on the database;
- increase the stability of the database;
- significant reduction in incidents of software performance.
Performance incidents decreased 10 times . This is a subjective value, before the incidents occurred at the RBS-Retail Bank complex 1–2 times a month steadily, and now we have practically forgotten about them.
Then the question arises - and where does software performance incidents? We did not deal with them directly?
Let's return to the last schedule. If you remember, there was a full scan, it was required to store in memory a large number of blocks. Since the request was executed regularly, all these blocks were stored in the Oracle cache. In this case, it turns out that if a high load occurs in the database at this time, for example, someone will actively use the memory, a cache will be needed to store data blocks. Thus, part of the data for our request will be pushed, and therefore, will have to do physical readings. If you do physical readings, the query time will immediately increase enormously.
Logical reading is working with memory, it happens quickly, and any access to the disk is slow (if you look at the time, milliseconds). If you're lucky, and in the cache of the operating system or in the cache of the array there is this data, it will still be dozens of microseconds. Reading from the cache of Oracle itself is much faster.
When we got rid of the full scan, there was no need to keep such a large number of blocks in the cache (Buffer Cache). When there is a shortage of these resources, the query is more or less stable. No longer observed such large bursts, which were with the old index.
Results on proactive optimization:
- Initial query optimization should be performed on testing servers, look at how queries and their business logic work, so as not to do anything extra. These works remain.
- But periodically, once every few months, it makes sense to remove the reports on the full load from the server, search for top queries and operations in the database and optimize them.
There are a lot of tools for obtaining statistical data in the Oracle database:
- AWR Report (DBMS_WORKLOAD_REPOSITORY.awr_report_html);
- Enterprise Manager Cloud Control 12c (SQL Details);
- SQL Details Active Report (DBMS_PERF.report_sql);
- SQL Monitoring (tab in EMCC);
- SQL Monitoring Report (DBMS_SQLTUNE.report_sql_monitor *).
Some of these tools work in the console, that is, they are not tied to Enterprise Manager.
Oracle Performance Examples for Statistical Data Collection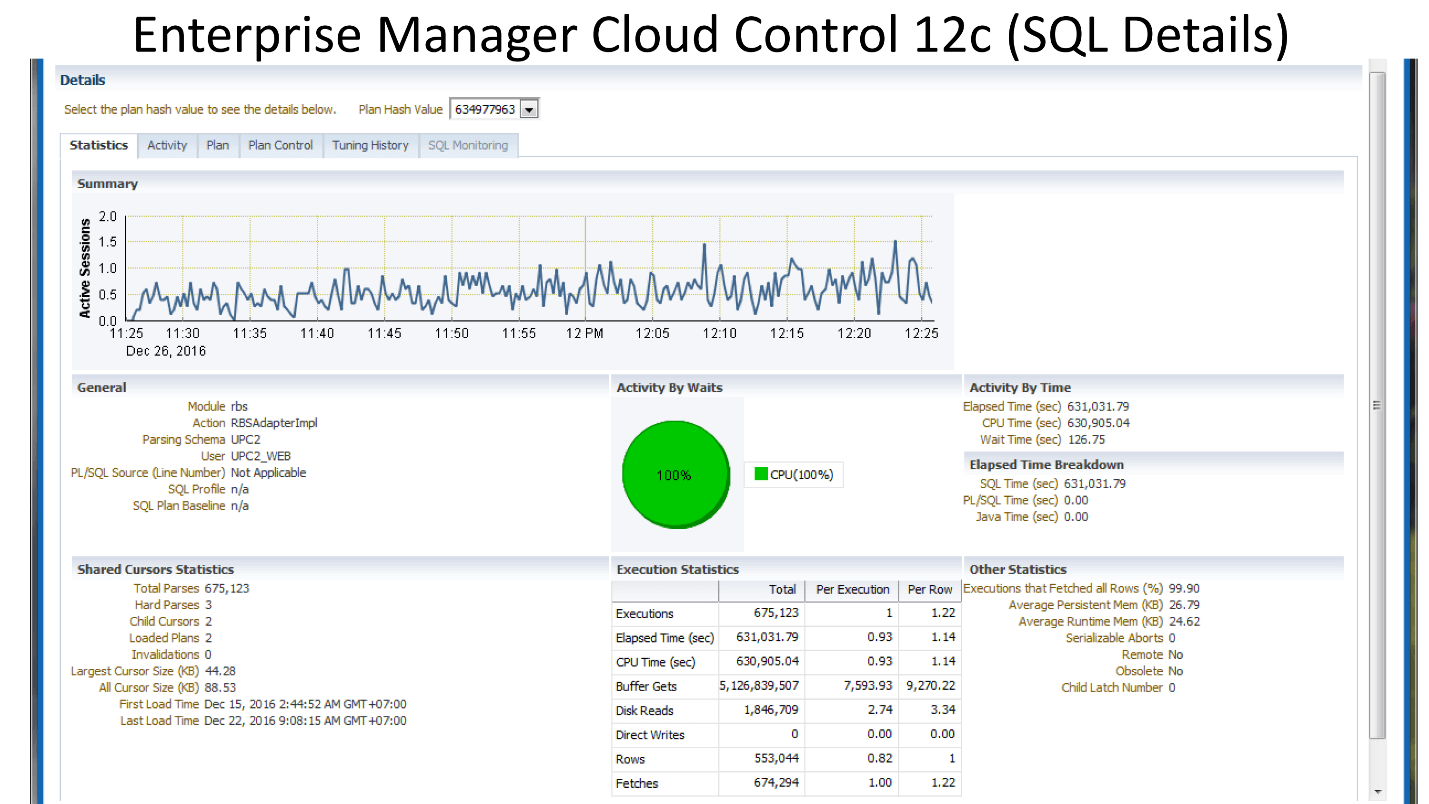

SQL-Monitoring shows how it all looks in real time (where the green gear is spinning, the query is working now).
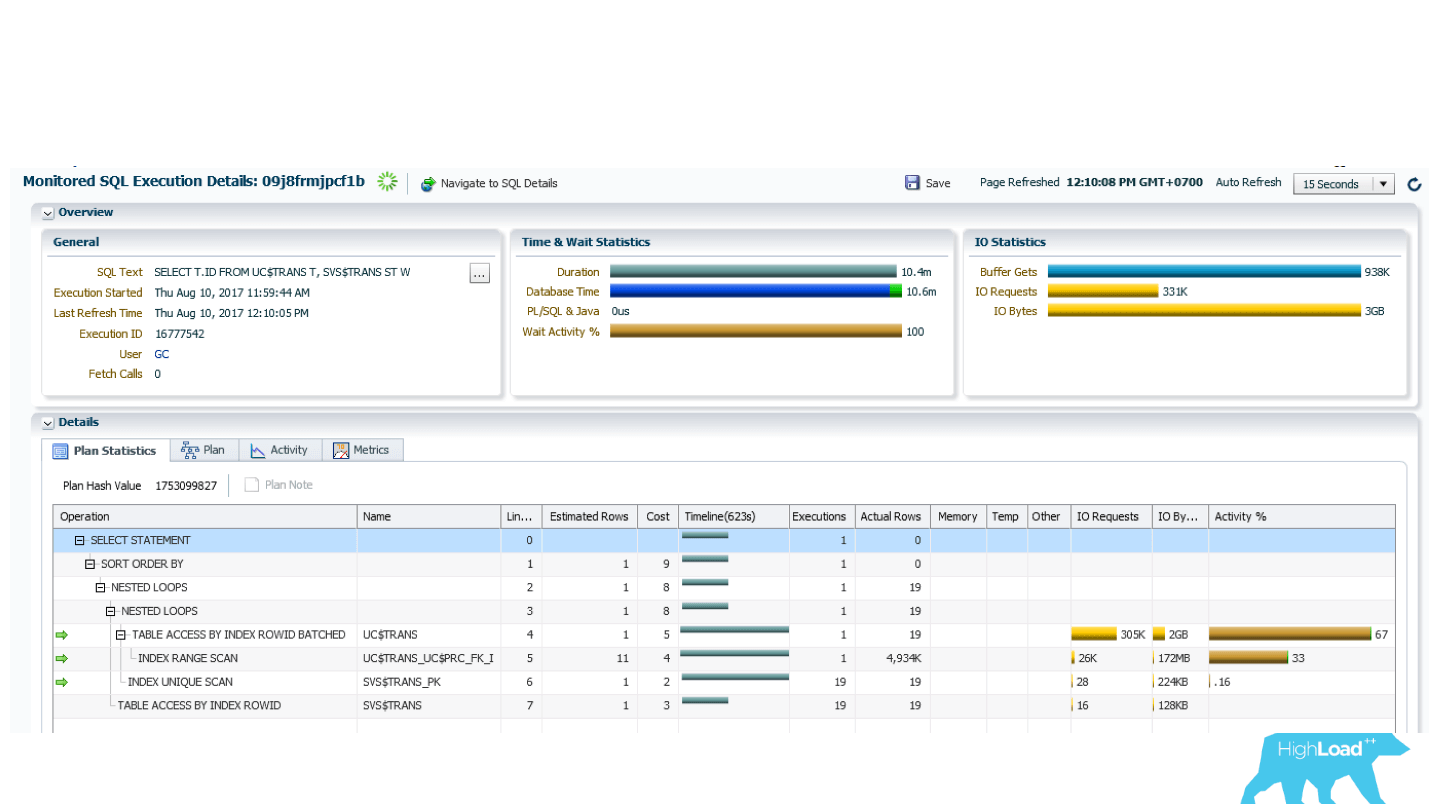
The above is the internal contents of the SQL-Monitoring report. It shows in real time which line of the query it performs and how many rows it reads (column Actual Rows). In this case, INDEX RANGE SCAN has already read 5 million.

SQL Monitoring Report text tool in which there is a piece of information (not all).
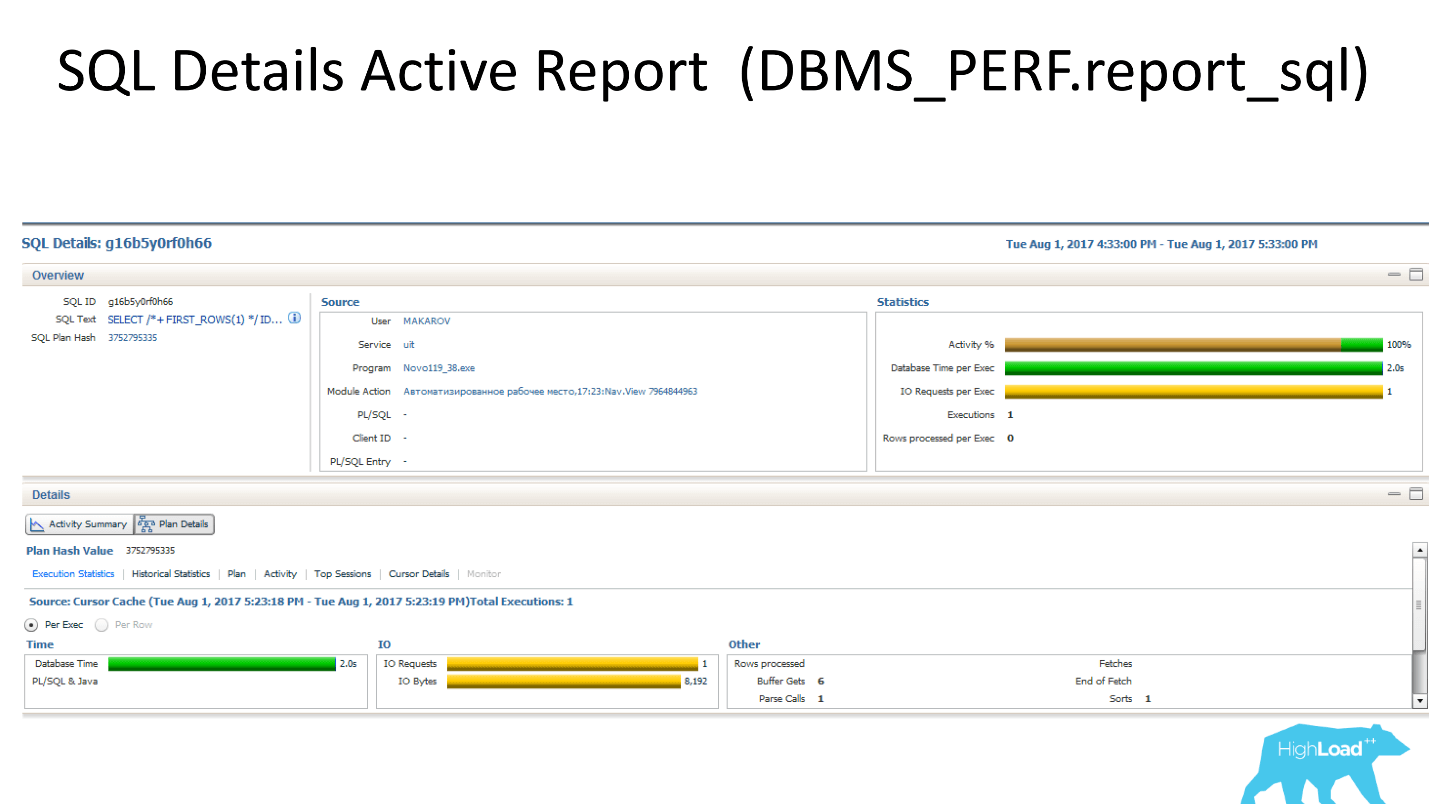
- The upper chart shows how many sessions are working with this request.
- The left block shows where this request is launched from, in which modules it is located.
- Bottom left - information on the use of the shared-pool.
- The diagram on the right shows wait events that are in the system. In this case, it is only the CPU.
- Bottom right - the most interesting - a plate with quality characteristics that are most important when analyzing performance problems.
SQL-Monitoring shows how it all looks in real time (where the green gear is spinning, the query is working now).
The above is the internal contents of the SQL-Monitoring report. It shows in real time which line of the query it performs and how many rows it reads (column Actual Rows). In this case, INDEX RANGE SCAN has already read 5 million.
SQL Monitoring Report text tool in which there is a piece of information (not all).
Bonus: the specialists of NNKO “Payment Center” and CFT were well prepared for the conference in Novosibirsk, made several useful presentations, and also organized a real outbound radio. Two days later, experts, speakers, and organizers visited the radio of the CFT radio. You can move from the Siberian summer by including records, here are the links to the blocks: Kubernetes: pros and cons ; Data Science & Machine Learning ; DevOps .
At HighLoad ++ in Moscow, which is already 8 and 9 November, there will be even more interesting. The program includes reports on all aspects of work on high-loaded projects, master classes, meetings and events from partners , who will share expert advice and find something to surprise. We will definitely write and let you know about the most interesting things in the mailing list , get connected!
Source: https://habr.com/ru/post/428491/
All Articles