A flexible system for testing and collecting metrics of programs on the example of LLVM test-suite
Introduction
Most developers have clearly heard about quite significant open-source developments such as the LLVM system and the clang compiler. However, LLVM is now not only directly the system itself to create compilers, but already a large ecosystem that includes many projects to solve various problems arising in the process of any stage of compiler creation (usually each such project has its own separate repository). Part of the infrastructure naturally includes tools for testing and benchmarking, because when developing a compiler, its efficiency is a very important indicator. One of such individual projects of the LLVM test infrastructure is the test suite ( official documentation ).
LLVM test suite
At first glance at the test-suite repository, it seems that this is just a set of benchmarks in C / C ++, but this is not quite so. In addition to the source code of the programs that will measure performance, the test suite includes a flexible infrastructure for building, running, and collecting metrics. By default, it collects the following metrics: compile time, execution time, link time, code size (by sections).
Test suite is naturally useful when testing and benchmarking compilers, but it can also be used for some other research tasks where some C / C ++ code base is needed. Those who once attempted to do something in the field of data analysis, I think, faced with the problem of lack and separation of the source data. A test-suite, though not composed of a huge number of applications, but has a unified data collection mechanism. It is very easy to add your own applications to the set, to collect the metrics necessary for your task. Therefore, in my opinion, the test suite (besides the main task of testing and benchmarking) is a good option for a basic project, on the basis of which you can build your data collection for tasks where you need to analyze some features of the program code or some characteristics of the programs.
LLVM test-suite structure
test-suite |----CMakeLists.txt // CMake , , | // .. | |---- cmake | |---- .modules // , | // API | |---- litsupport // Python, test-suite, | // lit ( LLVM) | |---- tools // : | // ( | // ), .. | | // | |---- SingleSource // , | // . . | |---- MultiSource // , | // . | // . | |---- MicroBenchmarks // , google-benchmark. | // , , | // | |---- External // , test-suite, | // , ( ) | // - The structure is simple and straightforward.
')
Principle of operation
As you can see, CMake and a special lit-test format are responsible for all the work on assembling, launching and collecting metrics.
If we consider it very abstract, it is clear that the process of benchmarking using this system looks simple and very predictable:

How does this look in more detail? In this article, I would like to focus on exactly what role CMake plays in the entire system and what is the only file you need to write if you want to add something to this system.
1. Building test applications.
As a build system, it is already used as a standard for C / C ++ CMake programs. CMake configures the project and generates make, ninja, etc., depending on the user's preferences. for direct construction.
However, in the test suite CMake not only generates rules for how to build applications, but also configures the tests themselves.
After launching CMake, another files will be written to the build directory (with the .test extension) with a description of how the application should be executed and checked for correctness.
An example of the most standard .test file
RUN: cd <some_path_to_build_directory>/MultiSource/Benchmarks/Prolangs-C/football ; <some_path_to_build_directory>/MultiSource/Benchmarks/Prolangs-C/football/football VERIFY: cd <some_path_to_build_directory>/MultiSource/Benchmarks/Prolangs-C/football ; <some_path_to_build_directory>/tools/fpcmp %o football.reference_output The file with the .test extension may contain the following sections:
- PREPARE - describes any actions that must be done before launching the application, very similar to the Before method that exists in different unit-testing frameworks;
- RUN - describes how to start the application;
- VERIFY - describes how to check the correctness of the application;
- METRIC - describes the metrics that need to be collected in addition to the standard.
Any of these sections may be omitted.
But since this file is automatically generated, it is in the CMake file for the benchmark that describes how to get the object files, how to assemble them into the application, and then what to do with this application.
For a better understanding of the default behavior and how it is described, consider an example of some CMakeLists.txt
list(APPEND CFLAGS -DBREAK_HANDLER -DUNICODE-pthread) # ( .. CMak, ) list(APPEND LDFLAGS -lstdc++ -pthread) # Flags can be set depending on the platform, the test-suite cmake modules include the DetectArchitecture file, which defines the target platform on which benchmarks are run, so you can simply use the data already collected. Other data is also available: operating system, byte order, etc.
if(TARGET_OS STREQUAL "Linux") list(APPEND CPPFLAGS -DC_LINUX) endif() if(NOT ARCH STREQUAL "ARM") if(ENDIAN STREQUAL "little") list(APPEND CPPFLAGS -DFPU_WORDS_BIGENDIAN=0) endif() if(ENDIAN STREQUAL "big") list(APPEND CPPFLAGS -DFPU_WORDS_BIGENDIAN=1) endif() endif() In principle, in this part there should be nothing new for people who at least once saw or write a simple CMake file. Naturally, you can use libraries, build them yourself, in general, use any means provided by CMake to describe the process of building your application.
And then you need to ensure the generation of the .test file. What tools does the tets-suite interface provide for this?
There are 2 basic macros, llvm_multisource and llvm_singlesource , which are enough for most trivial cases.
- llvm_multisource is used if the application consists of several files. If you do not pass the source code files as parameters when calling this macro in your CMake, then all source code files in the current directory will be used as the base for building. In fact, changes are currently taking place in the interface of this macro in the test suite, and the described method of transferring source files as macro parameters is the current version located in the master branch. Previously, there was another system: source code files should have been written to the Source variable (it was still in release 7.0), and the macro did not accept any parameters. But the basic logic of the implementation remained the same.
- llvm_singlesource assumes that each .c / .cpp file is a separate benchmark and for each compiles a separate executable file.
By default, both macros described above for launching a built application generate a command that simply invokes this application. A validation check is performed by comparing with the expected output found in the file with the extension .reference_output (also with possible suffixes .reference_output.little-endian, .reference_output.big-endian).
If this suits you, it is simply wonderful, one additional line (call llvm_multisource or llvm_singlesource) is enough for you to start the application and get the following metrics: code size (by sections), compile time, link time, execution time.
But naturally, rarely everything is so smooth. You may need to change one or more stages. And this is also possible with the help of simple actions. The only thing you need to remember is that if you override a certain stage, you need to describe all the others (even if the default algorithm suits them, which, of course, is a little upset).
In the API, there are macros to describe the actions at each stage.
For the preparatory stage, the llvm_test_prepare macro has nothing to write about, the commands that need to be executed are simply passed as a parameter.
What may be needed in the launch section? The most predictable case is that the application accepts some arguments, input files. For this, there is the macro llvm_test_run , which accepts only application launch arguments (without the name of the executable file) as parameters.
llvm_test_run(--fixed 400 --cpu 1 --num 200000 --seed 1158818515 run.hmm) To change actions at the stage of verification of correctness, the llvm_test_verify macro is used , which accepts any commands as parameters. Of course, to check the correctness it is better to use the tools included in the tools folder. They provide quite good opportunities for comparing the generated output with the expected one (there is a separate processing for comparing real numbers with a certain error, etc.). But you can somewhere and just check that the application has completed successfully, etc.
llvm_test_verify("cat %o | grep -q 'exit 0'") # %o - placeholder , lit. lit, , . lit ( , LLVM) ( <a href="https://llvm.org/docs/CommandGuide/lit.html"> </a>) And what if there is a need to collect some additional metrics? For this, there is a macro llvm_test_metric .
llvm_test_metric(METRIC < > <, >) For example, for dhrystone you can get a metric specific to it.
llvm_test_metric(METRIC dhry_score grep 'Dhrystones per Second' %o | awk '{print $4}') Of course, if you need to collect additional metrics for all tests, this method is somewhat inconvenient. You must either add the llvm_test_metric call to the high-level macros provided by the interface, or you can use TEST_SUITE_RUN_UNDER (CMake variable) and a specific script to collect metrics. The variable TEST_SUITE_RUN_UNDER is quite useful, and can be used, for example, to run on simulators, etc. In fact, a command is written to it that will accept an application with its arguments as input.
As a result, we get some CMakeLists.txt
# llvm_test_run(--fixed 400 --cpu 1 --num 200000 --seed 1158818515 run.hmm) llvm_test_verify("cat %o | grep -q 'exit 0'") llvm_test_metric(METRIC score grep 'Score' %o | awk '{print $4}') llvm_multisource() # llvm_multisource(my_application) The integration does not require additional efforts, if the application is already assembled using CMake, then in CMakeList.txt in the test suite you can enable an already existing CMake for building and add a few simple macro calls.
2. Running tests
As a result of his work, CMake generated a special test file according to the given description. But how is this file executed?
lit always uses some configuration file lit.cfg, which, respectively, exists in the test suite. This configuration file contains various settings for running tests, including the format of executable tests. Test suite uses its own format, which is located in the litsupport folder.
config.test_format = litsupport.test.TestSuiteTest() This format is described as a test class inherited from the standard lit-test and overrides the main interface method execute. Also important components of litsupport are the class with the description of the TestPlan test plan, which stores all the commands that must be executed at different stages and knows the order of the stages. To provide the necessary flexibility, the architecture also includes modules that should provide the mutatePlan method, within which they can modify the test plan, adding the description of collecting the necessary metrics, adding additional commands to measure the time to launch the application, etc. Due to the similar decision the architecture well extends.
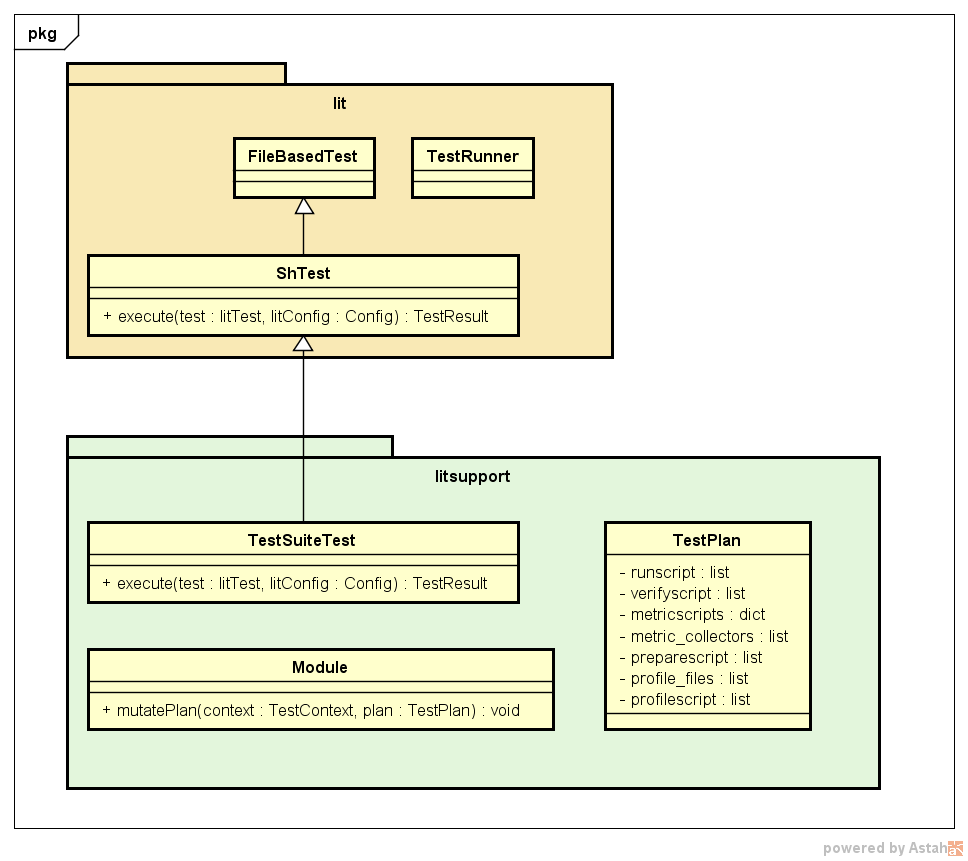
An approximate scheme of the test-suite test (except for details in the form of TestContext classes, various lit configurations and the tests themselves, etc.) is presented below.

Lit causes the execution of the test type specified in the configuration file. TestSuiteTest parses the generated CMake test file, getting a description of the main stages. Then all the found modules are called to change the current test plan, the launch is instrumented. Then the obtained test plan is executed: executed in the order of the preparation, launch, and validation stages. If necessary, profiling can be performed (added by one of the modules, if a variable is set during configuration that indicates the need for profiling). The next step is to collect metrics, functions for which collection were added by standard modules in the metric_collectors field in TestPlan, and then additional metrics are collected that are described by the user in CMake.
3. Run the test suite
Running the test suite is possible in two ways:
- Manual, i.e. sequential invocation of commands.
cmake -DCMAKE_CXX_COMPILER:FILEPATH=clang++ -DCMAKE_C_COMPILER:FILEPATH=clang test-suite # make # llvm-lit . -o <output> # - using LNT (another system from the LLVM ecosystem that allows you to run benchmarks, save the results in the database, analyze the results in the web interface). LNT, within its test run team, performs the same steps as in the previous paragraph.
lnt runtest test-suite --sandbox SANDBOX --cc clang --cxx clang++ --test-suite test-suite
The result for each test is displayed as
PASS: test-suite :: MultiSource/Benchmarks/Prolangs-C/football/football.test (m of n) ********** TEST 'test-suite :: MultiSource/Benchmarks/Prolangs-C/football/football.test' RESULTS ********** compile_time: 1.1120 exec_time: 0.0014 hash: "38254c7947642d1adb9d2f1200dbddf7" link_time: 0.0240 size: 59784 size..bss: 99800 … size..text: 37778 ********** The results from different launches can be compared without LNT (although this framework provides great opportunities for analyzing information using different tools, but it needs a separate review), using the script included in the test suite
test-suite/utils/compare.py results_a.json results_b.json An example of comparing the size of the code of the same benchmark from two launches: with the -O3 and -Os flags
test-suite/utils/compare.py -m size SANDBOX1/build/O3.json SANDBOX/build/Os.json Tests: 1 Metric: size Program O3 Os diff test-suite...langs-C/football/football.test 59784 47496 -20.6% Conclusion
The infrastructure for describing and launching benchmarks implemented in the test suite is easy to use and support, it scales well, and in principle, in my opinion, uses elegant solutions in its architecture, which, of course, makes test suite a very useful tool for developers compilers, as well as this system can be improved for use in some data analysis tasks.
Source: https://habr.com/ru/post/428421/
All Articles