We write the FPGA loader in LabVIEW. Part 1

Most "normal" programmers, to put it mildly, have an ambiguous attitude towards LabVIEW technology. Here you can argue long and to no avail. The situation is aggravated by the fact that there are a lot of examples of LabVIEW programs on the network, but all of them are focused on the beginner and come down to "oh, look how simple it is, connect the twist with the indicator, twist the handle, change the dial", or at best, the graph in the cycle a random number or a sine is displayed, all this is accompanied by a furious interface in the form of giant toggle switches, twists, and dial gauges. Personally, this conscious simplification annoys me. In a small series of articles I will try to acquaint the reader with the process of developing application software on LabVIEW. In order not to spend a lot of time on the subject area, we will use the described in detail algorithm for downloading the configuration file to FPGA via FTDI in MPSSE mode ( Downloading the configuration to FPGA via USB or parsing FTDI MPSSE ). In this article I will show how to implement the same FPGA loader, but in the LabVIEW language.
As mentioned above, the algorithm for loading the FPGA in the Serial Passive (SP) mode and the principle of operation of FTDI are well described in the previous article. I will not repeat. We believe that the algorithm has been tested and found valid. And yes, suppose the reader is at least superficially familiar with the concept of LabVIEW and is well versed in classical programming.
Although the process of creating a loader does not take much time, the description of the process could not fit in the volume of one article, so there will be a small series. Since the stage of experiments has already been completed, and I’m sure that the algorithm will work, I’ll allow myself to start development from the user interface. In the first article we will create the user interface of the loader, we will implement the structure of the program. In the second - through the dll of the FTDI driver we implement the loading of the * .rbf file into the FPGA.
For the productivity of the conversation is not superfluous to recall the terminology adopted in LabVIEW. In LabVIEW, an application program is called a Virtual Device, also known as a VP, or Virtual Instrument or abbreviated VI. The VI has two "sides": the front panel (Front Panel), where the controls and indicators are located, and the block diagram (Block Diagram), where these elements are interconnected and the functions and processing flows are implemented. As a rule, the VP has a hierarchical structure; all VPs in the composition of the top-level VIs are usually called a sub-instrument or SubVI.
User interface
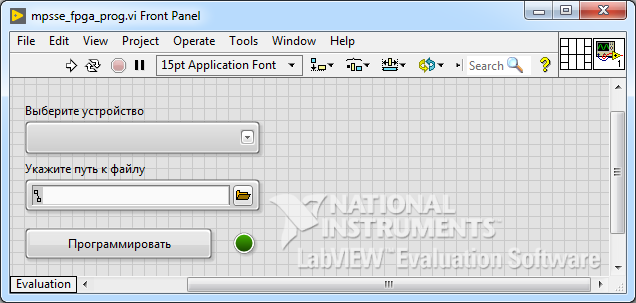
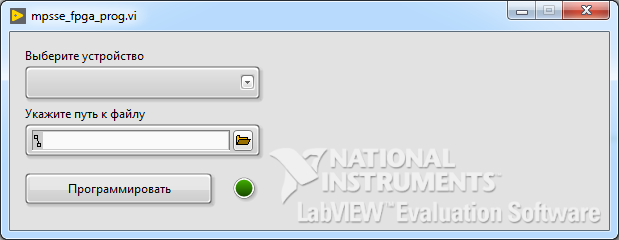
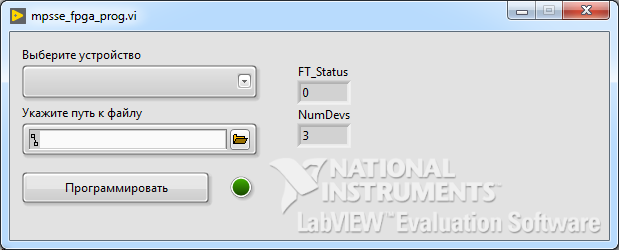
Our application must load the configuration file into the FPGA. In this case, we assume that several FTDI can be simultaneously connected to the computer, and some of them can potentially be used to configure the FPGA. I suggest choosing a device from a drop-down list, selecting a file through a button with a path output. To start the download, add the "program" button. A virtual LED indicator will display the status of the operation. Launch LabVIEW.
Add the required elements to the front panel (Front Panel). For decoration I will use the style "Silver". The figure below shows the result, all elements are in their original state. By name, if necessary, they are quite easy to find in the palette.
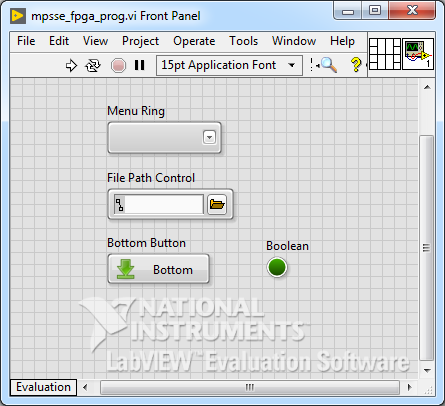
We edit elements: we transfer, we stretch, we add inscriptions - we bring in a necessary type. Here, in fact, requires the hand of a designer, but as I could:
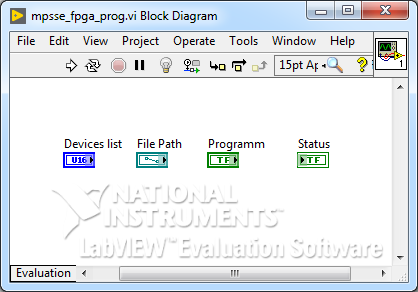
And block diagram:
Paying attention. Each element has two properties that define the name - this is Label and Caption.

The first property specifies the name of the element; under this name it will be displayed on the block diagram. Label, unlike Caption, cannot be changed during the execution of a VI. In connection with this feature, I recommend to hide Label in my IDs on the front panel and display Caption. For Label to come up with a meaningful name as a variable in a classical programming language, preferably in the Latin layout. For Caption, enter the already human-oriented name, it can be quite long, include spaces and, if necessary, in Russian. Using LabVIEW, you can customize the Caption display font. I must say that no one forces us to tinker with Caption: any inscription can be made directly on the FP in any free space.
The VP is implemented according to the classical scheme: While loop and event handler. Add a While loop to the block diagram (Programming -> Structures -> While Loop) and an event handler structure (Programming -> Structures -> Event Structure).
The structure waits for an event to occur, then executes the appropriate handler. The event structure has one or several subdiagrams — event handlers, so-called cases, one of which is executed when an event occurs. Using the terminal in the upper left corner, you can set the number of milliseconds during which the structure waits for an event. If during this time no event has occurred, then the "Timeout" subdiagram will be executed. The default value is minus 1, which means that the wait time never expires.
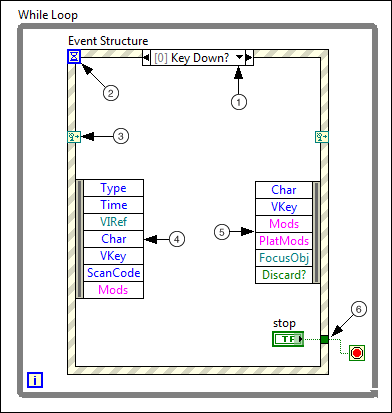
- The event selector label indicates which events trigger the execution of the current case. To view other handlers, you can click the down arrow next to the event name.
- The
timeoutterminal sets the number of milliseconds to wait for an event. If the value is different from -1, then the Timeout subdiagram must be implemented. - Terminal for entering dynamic events. This terminal is not displayed by default. To display it, select the item "Show Dynamic Event Terminals" in the context menu.
- Event data node When an event occurs LabVIEW generates data associated with this event. This node provides this data to the handler. Using the mouse, you can resize the node vertically and select the necessary elements. Some data, such as
TypeandTime, are common to all events, others, such asCharandVKey, depend on the type of event configured. - The event filter node defines event data that can be modified before the user interface processes this data. This node is displayed only in those handlers where filtering is available. You can connect and modify items from the event data node to the event filter node. You can also change these events by connecting new values to the node terminals. Can you completely cancel the interface's reaction to an event if you submit
trueto theDiscard?terminalDiscard?. If you do not connect the value to the filter element, then this data element remains unchanged. - Like the
Casestructure, the event structure supports tunnels. If you add a tunnel in one case, it will automatically be created for each handler. However, by default there is no need to connect the output tunnels of the event structure in each handler. All unconnected tunnels use the default for the tunnel data type. This can potentially lead to hard-to-find errors. You can return the mode in which the tunnel should be wired in all handlers, to do this, select "Use Default If Unwired" in the context menu.
First of all, we will take care of how the cycle will end and exit the program. The easiest way is to add a stop button, which will stop the cycle, but, in my opinion, the program is usually completed with a red cross in the upper corner of the window.
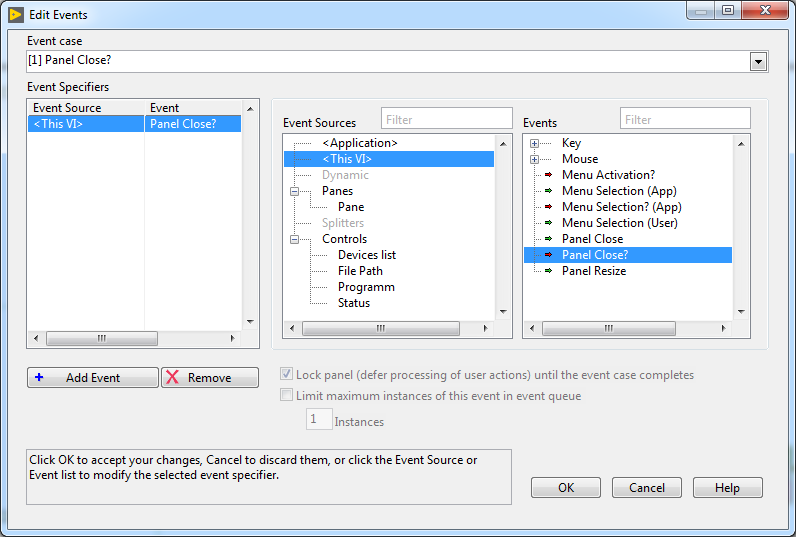
In the structure of the Event Structure add the appropriate handler. In the context menu, select "Add Event Case". As the source of the event, select "This VI", specify the event "Panel Close?"
Clickable image
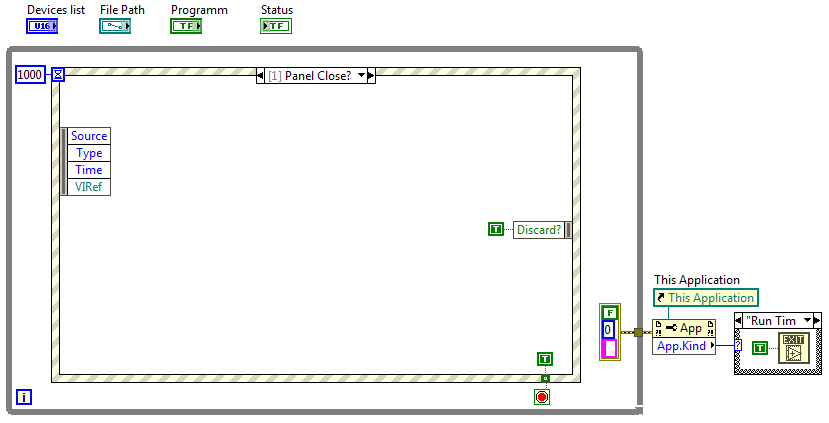
I draw your attention, if you select "Panel Close" (without a question), then this event without a filter can not be canceled. And if with a question, when you click on the cross, we can take control and correctly complete the program on our own. In the handler "Panel Close?" through the tunnel, we connect the true Boolean constant to the terminal of the stop of the while . At the entrance "Discard?" also served true .
Now it’s not an obvious nuance: if the current VI is launched not in the LabVIEW environment, but as a compiled application, pressing the cross will not close the window, but will stop the application, which we do not need. To solve this problem after the completion of the main cycle, let's check whether we are in the development environment or in the program mode, if we are still in the program mode, then we will terminate the application. In order to understand where the current VI is running, we use the properties node (Programming -> Application Control -> Property Node). This node provides access to the properties of an object by reference to this object. In this case, we should get a link to the entire application as a whole. We select the VI Server Reference constant from the same palette. After the constant is set on the block diagram, you need to change its type to This Application (left mouse button). We connect the resulting link with the properties node. Select the Application:Kind Property property Application:Kind Property - returns the type of LabVIEW system in which the current VI is running. The output of the property is connected to the selection structure (Case Structure), we add the case "Run Time System", where we complete the application ( Quit LabVIEW ). In order for this block to be executed after the cycle, and not before, the error in input terminal is connected to the cycle through the tunnel.
Clickable image
Now when you start the program, you can stop it by clicking on the cross of the window. The running program looks like this:

In my opinion, a lot of excess. Go to the properties VI (menu File -> VI Properties), select the category "Window Appearance", set Custom.
Turning off the menu display (in the edit mode the menu remains), turn off the scroll bar, hide the toolbar when the application is running (Show toolbar when running). We forbid to change the window size, we allow to minimize and minimize the window. That's much better:
Of course, it would be worthwhile to remove the inscription "National Instruments. LabVIEW Evaluation Software", but for the home computer I still don’t want to buy a license, accept the inscription and do a 45-day trial period.
Naturally, you can adjust the background color and each element, select fonts, but I'm not a designer, but something tells me that I will only make it worse.
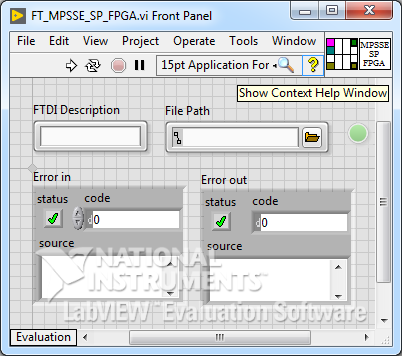
Instrument List
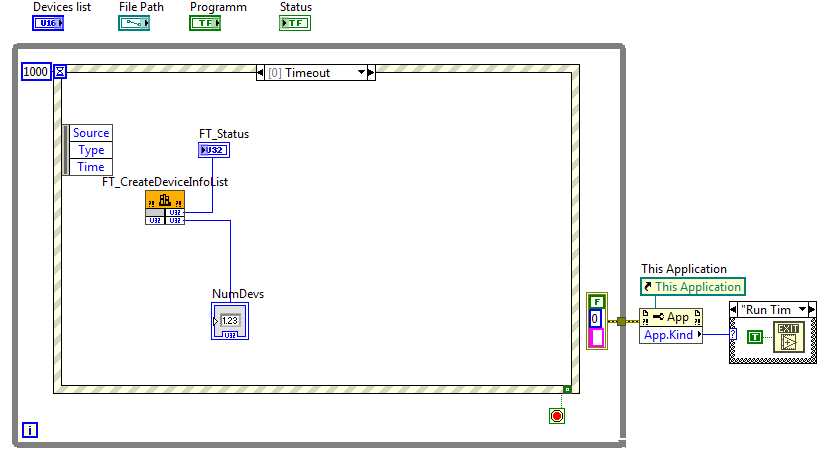
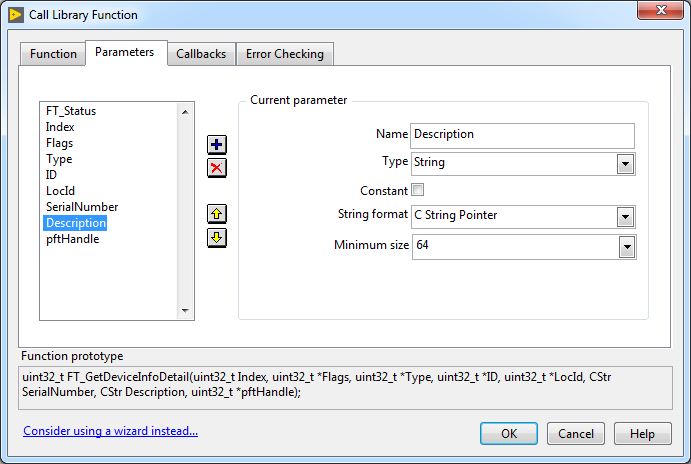
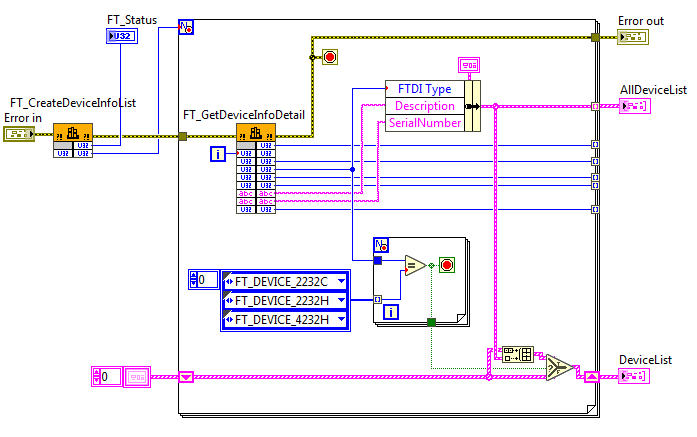
The VP must offer the user a list of devices connected to the computer suitable for the FPGA firmware in order for the user to select the right one. In the FTD2XX library, the functions FT_CreateDeviceInfoList and FT_GetDeviceInfoDetail are intended for this. As already discussed in a previous article , driver libraries can be used to use the FTD2XX API. LabVIEW has a convenient mechanism for interacting with dynamic libraries - the Call Library Function Node; you can find it in the "Connectivity -> Libraries & Executables" palette. The function call node should be configured: first, specify the path to the dll (the "Function" tab), after which the system scans the library and in the "Function Name" list will offer to choose the name of the function - select FT_CreateDeviceInfoList , calling convention (Calling convention) - select stdcall (winapi) . Secondly, on the "Parameters" tab, you need to enter a list of function parameters, where the first element of the list is the return value. Here before my eyes it would be nice to keep the documentation on the API, or the header file. When setting parameters, the prototype of the function being imported is displayed in the "Function prototype" area. When the signature from the documentation matches the configured prototype, click OK.
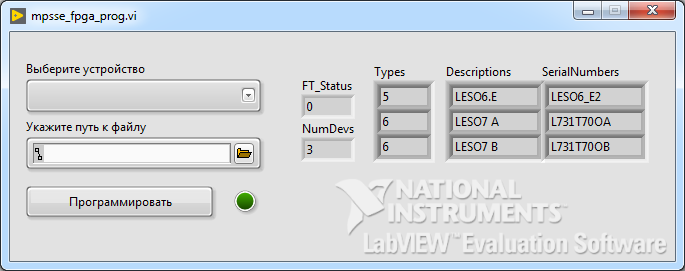
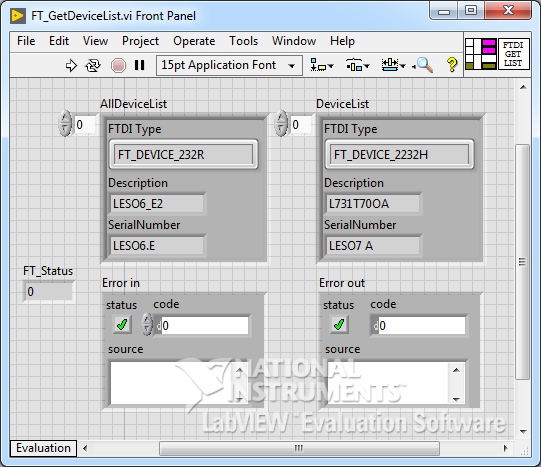
Suppose that the scan should be performed once per second. The call node is located in the structure of the event handler on the "Timeout" tab, the waiting time is set to 1000 ms. We add indicators to the node outputs, and if everything is done correctly, then when the VI is started, the number of connected devices with FTDI should be displayed:
The picture is clickable
Similarly, create a node for the function FT_GetDeviceInfoDetail . The function prototype is:
FTD2XX_API FT_STATUS WINAPI FT_GetDeviceInfoDetail( DWORD dwIndex, LPDWORD lpdwFlags, LPDWORD lpdwType, LPDWORD lpdwID, LPDWORD lpdwLocId, LPVOID lpSerialNumber, LPVOID lpDescription, FT_HAN When describing parameters, you should note that lpdwFlags , lpdwType , lpdwID , lpdwLocId are passed as pointers to uint32 . The lpSerialNumber and lpDescription are the essence of byte strings (arrays of type char with a null terminator). Parameters of this type in the call node can be styled in various ways, you can enter them into an array of 8-bit words, but I think it is most convenient to immediately indicate that this is a string and set the expected size. In this case, the output will immediately be a valid lably string and no additional transformations will be required.
Call Library Function
This function returns information on the dwIndex sequence number. If several FTDI are connected to the computer, in order to read the information for each converter, the function must be called in a loop. The number of loop iterations will be given to us by the previous function FT_CreateDeviceInfoList .

The picture is clickable
There is an unpleasant feature: all ports of the call site must be connected on at least one side. Therefore, a tunnel is made in the loop for those output terminals that we are not going to use.
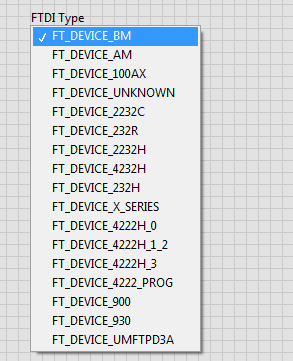
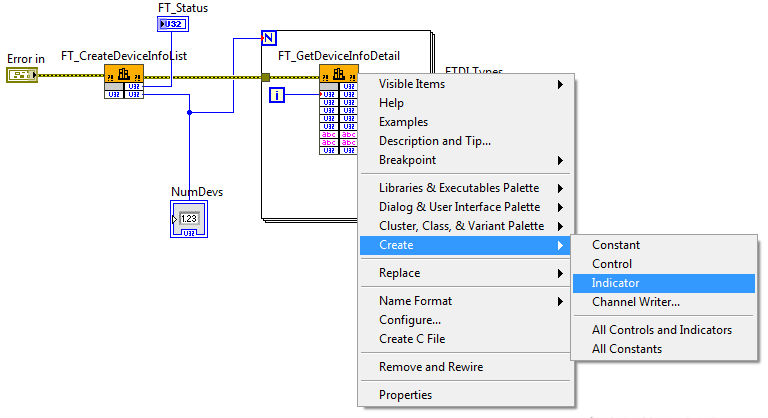
The Types array contains the types of FTDI chips, we need them in order to limit the choice only to those that support MPSSE and can potentially be used to program the FPGA. However, it is inconvenient to operate with “magic numbers” - I suggest arranging the FTDI types in the form of enum . Moreover, such an enum already in the ftd2xx.h header file. In LabVIEW, you can use two controls to create an enumeration: the “Text Ring” and the “Enum” itself. Both contain lists of strings with numeric values between which you can switch. The main difference is that Enum requires that numeric values be consecutive integers, while there is more freedom in the Text Ring — you can specify any values.
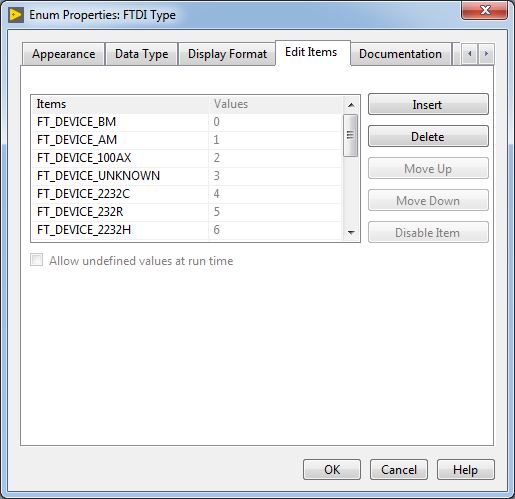
We manually enter the values, it is a pity that there is no function to import enum from C
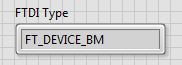
This type of indicator looks like this on the front panel.
The choice of value is carried out by the left mouse button
In order to link and synchronize all future instances of the created list, it is convenient to use the function "Make Type Def." (selection through the context menu of the element). This will create a custom data type. The new type is placed in a separate file with the extension * .ctl. Editing this file will change all instances of this item. I think you should not explain how it can be convenient. Access to the definition file can be obtained from the context menu of the instance by selecting "Open Type Def", in the same menu you should pay attention to the items "Auto-Update from Type Def." and "Disconnect from Type Def".
We change the Types indicator to the array of the FTDI Type indicators and as a result, when the VI is started, the type of the connected converter is displayed:
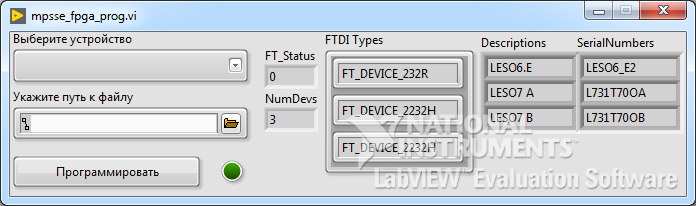
Three devices found
It is easy to see that the functionality of the resulting code in the Timeout case is complete, therefore it can be transferred to a separate SubVI. Select the elements that we want to transfer to the sub-device and in the main menu Edit select the item "Create SubVI".
All indicators remained, and in place of the call nodes, a new VI was formed with a standard icon.
The picture is clickable
Double click on the new subVI will launch its edit window. First of all we save it and give a meaningful name, for example "FT_GetDeviceInfo". Configure the I / O terminals. To do this, use the Connections Pane:
A panel is a set of terminals corresponding to controls and indicators VI.
If you select the terminal on the connections panel, the corresponding element on the front panel will be highlighted. If you select an empty terminal, and then click on the element on the front panel, the element will bind to the terminal, but before that it should not be assigned to some other terminal. In the context menu, you can individually or for all disconnect the terminals from the elements at once, you can change the pattern of the panel as a whole.
I don’t like how the terminals were assigned when creating the current subVI, so I select the "Disconnect All Terminals" option and mark it manually. I recommend the input terminals to be placed on the left, and the weekend on the right, optional input can be placed on top, and optional output below. This will ensure good code readability and visual order on the block diagram.
To control errors, create two additional elements Error in and Error out . The topic of error control in LabVIEW is very extensive and is beyond the scope of this article, therefore we limit ourselves to a minimum of explanations and will adhere to the principle “do as I do”. So, we create two terminals for errors - input and output.
Right mouse button on the terminal errors of any node:
In LabVIEW, the input terminal accepted errors on the connection panel to be placed on the left below, and the output one on the right below.
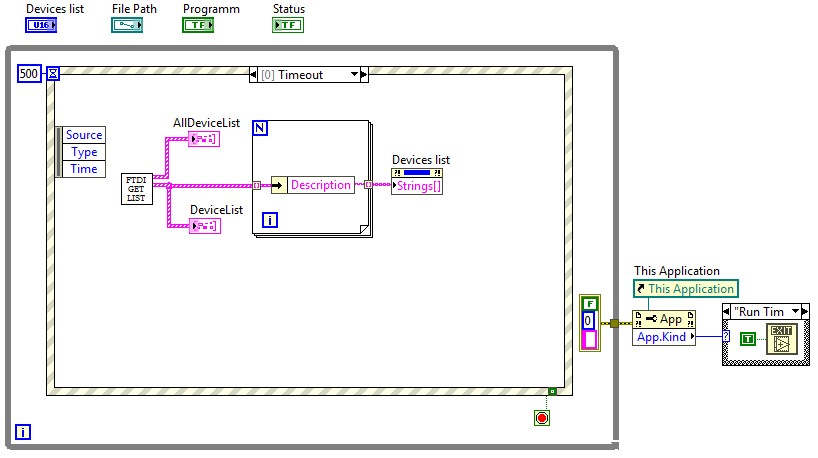
It will be more convenient to combine the output into a structure. For output, we will make two arrays: the first array will contain all the FTDI devices found, the second array - only those that can MPSSE and can theoretically be used to configure the FPGA.
The final touch when creating a sub-device is setting up an icon. Double click on the icon in the upper right corner of the window launches the editor. We try to create some kind of meaningful image that allows us to unambiguously interpret the purpose of the device on the block diagram.
Front Panel
Block diagram
And this is how the case "Timeout" looks after putting things in order:
The picture is clickable
Up to this point, the drop-down list with the name "Select device" was empty, we now have the data to fill it. Create a property node for the list with the property "Strings []" (context menu -> Create -> Property Node -> Strings []). Any property is available for writing and reading, the current mode is selected in the context menu of the Property Node. When creating a default node, properties are configured to be read. Change to write: "Change To Write".
From the array of structures, select the array with the description and feed it to the Strings[] . You can select an array using the For Loop .
After starting the VI, pressing the left button on the element "Select device", you can specify the device to configure. At the same time, the list of devices is updated twice a second. Of course, it would be possible to update the property only if the list was updated, but for the time being this will result in unnecessary blocking of the block diagram.
Front Panel
The picture is clickable
Earlier, I forgot to mention such an interesting feature; the For loop does not have to specify the number of iterations in an explicit form; it is enough to create an input tunnel of the array and the loop is executed for each element, this behavior resembles a foreach in C ++ 11. However, one must be careful when more than one array enters the loop input.
In the event structure, add the handler for pressing the "program" button. As long as we do not have a VI responsible for loading the file into the FPGA, we will make a sub-device "stub". Suppose that it takes as input the path to the configuration file and the FTDI descriptor, and returns the status of the firmware as a result of the work: successful or not. And in order to make it more interesting to test the interface of the program, we will make this status random.
Front Panel
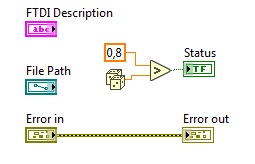
Block diagram
The FTDI descriptor is passed to the input of the stub through the list property (context menu -> Create -> Property Node -> Ring Text -> Text). To transfer the file path to the "File Path" element, create a local variable (context menu -> Create -> Local Variable) and configure it to read (Change To Read). And we will connect the status output directly to the Status indicator. The Programm button is dragged to the event handler. It is a good practice to place elements on which the event is configured in the handlers - now double clicking on this element on the front panel will show not only the corresponding element on the block diagram, but also the event handler associated with this element.
Now, by pressing the "Program" button, the indicator becomes either green (success) or dark green (not success). Not too visually. In the properties of the indicator, change the color "Off" to red. That's better. If the indicator is green, then we can state that the FPGA on the selected device is configured by the file, the path to which is specified in the window:

Front Panel
But this statement becomes false if we change the file or choose another device. At the same time, we cannot dye the indicator red, as programming errors did not occur. A convenient solution would be to change the file or device, emphasizing that the indicator value is not relevant - to darken it. For this, you can use the Disabled property of the indicator. This property can have three values. Enabled - normal display; the user can control the object; Disabled - the object is displayed on the front panel as usual, but the user cannot control the object; Disabled and Grayed Out - the object displayed on the front panel is darkened, and the user cannot control the object.
We create event handlers for the Devices list and File Path , and we dim the status indicator in them, and in the handler of the "Program" button we assign it to the Enabled property.
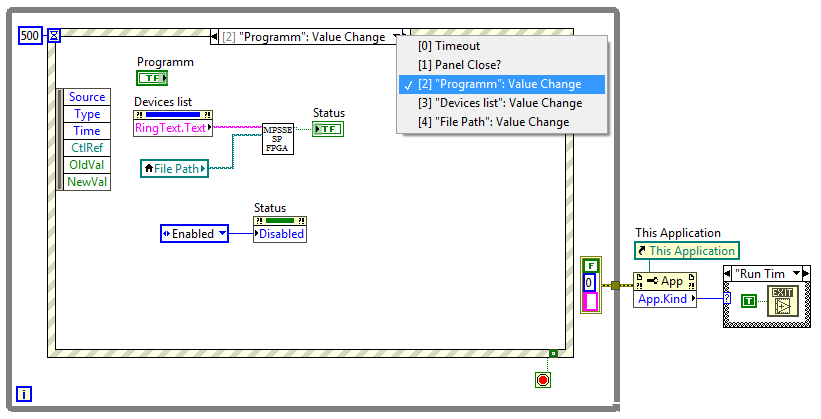
Programm handler: Value Change.
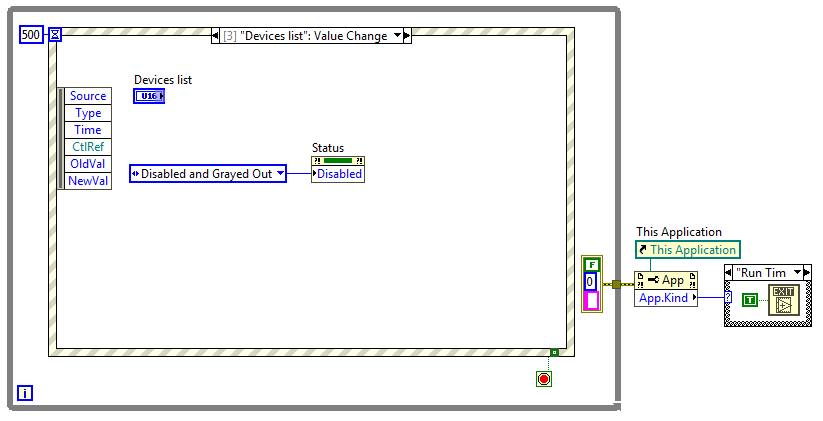
Devices list handler: Value Change

Here is the darkened indicator.
We will make it easy for the user to search for the configuration file - we will configure the file viewing window Go to the properties of the File Path element, on the "Browse Options" tab, fill in the Prompt, Pattern Label, specify the filter of the file type (Pattern) and the name for the button (Button Text).
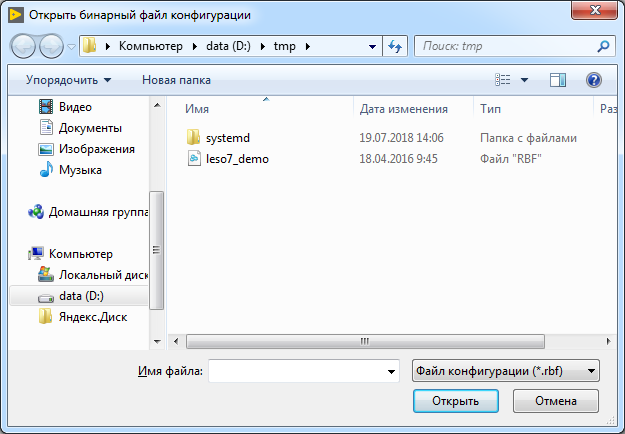
Only rbf files are displayed.

Creating a user interface can be considered complete.
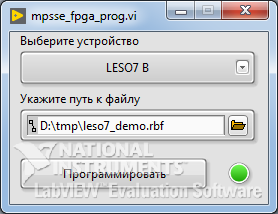
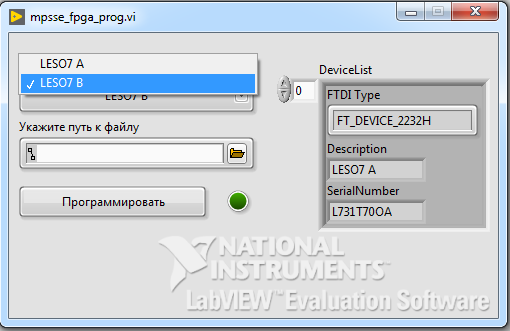
Running bootloader
What did you meet today?
In this article, using the example of creating a functionally complete application with a minimalist interface, I tried to show different approaches to working in LabVIEW.
As a result, we touched on:
- Setting the properties of the virtual device. .
- : .
- .
- .
- dll.
- .
API FTD2XX MPSSE. .
Materials on the topic
')
Source: https://habr.com/ru/post/427529/
All Articles