We are preparing hierarchical clustering or how I have identified specializations from resumes.
I work as a developer in hh.ru , and I want to go to datasayns, but so far there is not enough skills. Therefore, in my free time I study machine learning and try to solve practical problems from this area. Recently I was given a task to cluster our resumes. The post will be about how I solved it with the help of agglomerative hierarchical clustering. If you do not want to read, but the result is interesting, you can see the demo right away.
The labor market is constantly in dynamics, new professions arise, others disappear, and I want to have an up-to-date categorization of resume. On hh.ru, the catalog of professional oblasts and specializations has long been outdated: a lot of it is tied up on it, so the changes have not been made for a long time. It would be helpful to learn how to edit these categories painlessly. I attempt to automatically identify these categories. I hope that in the future it will help to solve the problem.
By clustering, I will understand the union of objects with the most similar features into one group. In my case, the object is considered a resume, and under the signs of the object - data summary: for example, the frequency of the word "manager" in the resume or salary. The similarity of objects is determined by a pre-selected metric. For now, you can think of it as a black box, to which two objects are fed to the input, and the output is a number that reflects, for example, the distance between objects in a vector space: the smaller the distance, the more similar the objects.
')
The approach I used can be called ascending agglomerative hierarchical clustering. The result of clustering is a binary tree, where there are separate elements in the leaves, and the root of the tree is the collection of all elements. It is called ascending because clustering starts from the lowest level of the tree, from the leaves, where each individual element is considered as a cluster.

Then you need to find the next two clusters and merge them into a new cluster. This procedure must be repeated until there is one cluster with all the objects inside. When clusters are merged, the distance between them is recorded. In the future, these distances can be used to determine where these distances are large enough to consider selected clusters as separate.
Most clustering methods assume that the number of clusters is known in advance, or they try to isolate the clusters on their own, depending on the algorithm and parameters of this algorithm. The advantage of hierarchical clustering is that you can try to determine the desired number of clusters by examining the properties of the resulting tree, for example, to allocate those subtrees to different groups, the distances between which are quite large. It is convenient to work with the resulting structure to search for clusters in it. Conveniently, such a structure is built once and does not need to be rebuilt when searching for the required number of clusters.
Among the shortcomings, I would mention that the algorithm is rather demanding of consumed memory. And even instead of assigning a particular class, I would like to have the probability that the summary of a class belongs to a class in order to look not at one nearest specialty, but at the totality.
The most important part in working with data is their preparation, selection and extraction of features. It is based on what signs will be obtained in the end, will it depend on whether there are patterns in them, whether these patterns will correspond to the expected result and whether this “expected result” is possible at all. Before feeding the data to any machine learning algorithm, you need to have an idea about each feature, whether there are gaps, what type is the feature, what properties does this type of feature have and what is the distribution of values in this feature. It is also very important to choose the algorithm by which the existing data will be processed.
I took resumes that were updated during the last six months. It turned out 2.7 million. From the data on the resume I chose the simplest signs, from which, it seemed to me, the membership of the resume should depend on this or that group. Looking ahead, I will say that the result of clustering all resumes at once did not satisfy me. Therefore, we had to first divide the summary of the already existing 28 professional oblasts.
For each feature, I plotted the distribution to get an idea of how the data looked. Perhaps they should somehow be converted or completely abandoned.
Region So that the values of this attribute could be compared with each other, I assigned the total number of summaries entering this region to each region and took the logarithm of this number to smooth the difference between very large and small cities.
Paul Transformed into a binary sign.
Date of birth . Recalculated in the number of months. Birthday is not specified at all. I filled the gaps with the average values of the age of the specialization to which this resume belongs.
Level of education This is a categorical feature. I coded it with LabelBinarizer .
The name of the position . I drove through TfidfVectorizer with ngram_range = (1,2), used stemmer .
Salary . Translated all values into rubles. Gaps filled in the same way as in age. Took from the logarithm value.
Work schedule . Encoded LabelBinarizer.
Employment rate Made binary, divided into two parts: full-time and all the rest.
Language proficiency . Chose the top most used. Each language is set as a separate feature. The levels of ownership compared the numbers from 0 to 5.
Key skills . Chased through TfidfVectorizer. As a stop word, I collected a small dictionary of general skills and words, which, it seemed to me, do not affect the specialty. All words missed through stemmer. Each key skill can consist not only of one word, but also of several. In the case of several words in the key skill, I sorted the words, and each word was additionally used as a separate attribute. This feature is good only in the “Information Technologies, Internet, Telecom” professional field, because people often indicate the skills relevant to their specialty. I did not use it in the other professional areas because of the abundance of common words in skills.
Specializations . Each of the user-supplied specializations I set as a binary sign.
Experience I took the logarithm of the number of months + 1, since there are people with no work experience.
As a result, each resume has become a vector of numbers-signs. The selected clustering algorithm is based on calculating the distance between objects. How to determine what contribution to this distance should make each sign? For example, there is a binary sign - 0 and 1, and another sign can take a lot of values from 0 to 1000.
Standardization comes to the rescue. I used StandardScaler . It converts each feature in such a way that its mean value is zero and the standard deviation from the mean is one. Thus, we try to bring all the data to the same distribution - the standard normal one. Of course, it is far from a fact that the data itself has the nature of a normal distribution. This is one of the reasons to build graphs of the distribution of its parameters and be glad that they look like Gaussians.
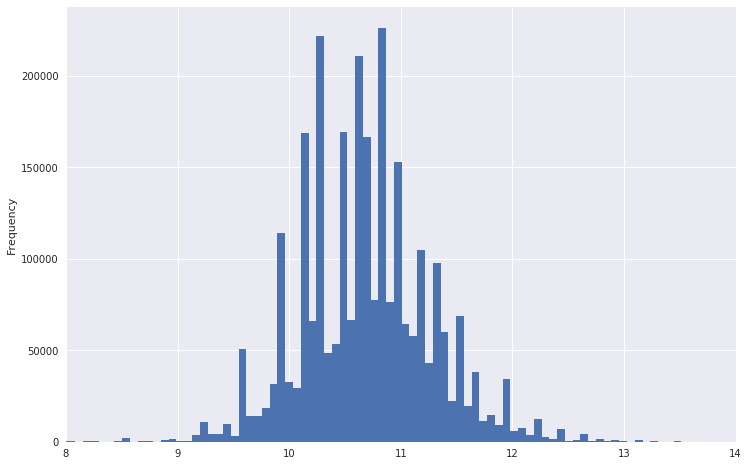
So, for example, the schedule of distribution of salaries looked.

It is evident that he has a very heavy tail. To make the distribution more like a normal one, you can take the logarithm from this data. At the same time, emissions will not be as strong.
Now it makes sense to transfer the data into a space of a smaller dimension so that the clustering algorithm can later digest them in reasonable time and memory. I used TruncatedSVD , because it can work with sparse matrices and, at the output, gives the usual dense-matrix, which we will need for further work. By the way, in TruncatedSVD also need to submit standardized data.
At the same stage, it is worth trying to visualize the resulting dataset, translating it into two-dimensional space using t-SNE . This is a very important step. If the structure of the resulting image does not show any structure, or, on the contrary, this structure looks very strange, then either there is no necessary pattern in your data, or an error is made somewhere.
I received a lot of very suspicious images before everything went well. For example, once there was such a beautiful image:
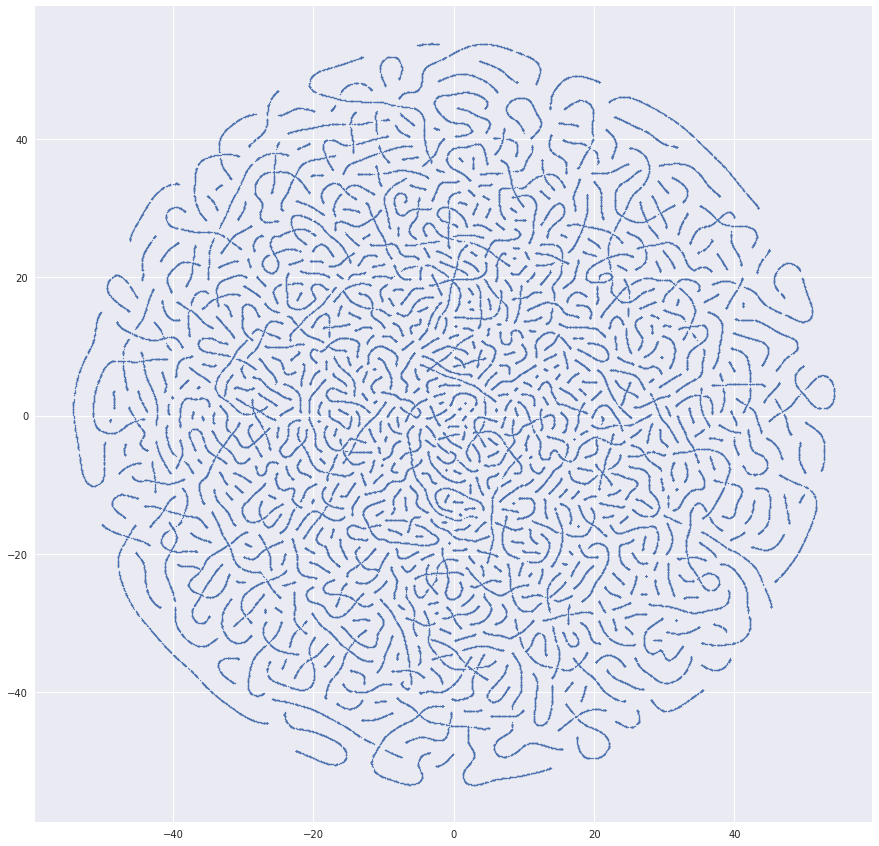
The reason of the turned out worms was hit in resume identifiers. And here is something that looks more like the truth:

If it seems that everything is in order with the data, then you can start clustering. I used the hierarchy clustering package from SciPy. It allows clustering using the linkage method . I tried all the distance metrics between clusters proposed in the algorithm. The best result was given by the Ward method .
The main problem I encountered is that the clustering algorithm considers the matrix of distances between all the elements, which means quadratic dependence on the number of elements in memory. For 2.7 million resumes, I did not succeed in this, because The amount of memory required is terabytes. All calculations were performed on a regular computer. I do not have so much RAM. Therefore, it seemed to me reasonable that you can first combine the resumes that are nearby, take the centers of the resulting groups and already cluster them with the necessary algorithm. I took MiniBatchKMeans , created with it 30,000 clusters and sent them to hierarchical clustering. It worked, but the result was so-so. Many brightest groups of resumes have stood out, but the details are not enough to find specializations at a good level.
In order to improve the quality of the received specializations, I have divided the data into professional fields. It turned out datasets from 400 000 resumes and less. At this point, it occurred to me that clustering a sample of data was better than using two algorithms in a row. Therefore, I refused MiniBatchKMeans and took up to 100,000 resumes for each specialization so that the linkage method could digest them. 32 Gb of RAM was not enough, so I allocated an extra 100 Gb for the swap. As a result, linkage provides a matrix with the distances between the clusters combined at each step and the number of elements in the resulting cluster.
The algorithm used a quality test to compare different dataset options and different methods for calculating the distance between clusters. The algorithm used the cophenetic correlation coefficient obtained from cophenet . This coefficient shows how well the resulting dendrogram reflects the dissimilarity of objects against each other. The closer the value is to one, the better.
The best way to validate the quality of clustering work was visualization. The dendrogram method draws the resulting dendrograms, where clusters can be distinguished by distance or level in the tree:

The following graph shows the dependence of the distance between clusters on the iteration step number, in which the two closest clusters merge into a new one. The green line shows how the acceleration varies - the speed of change of the distance between the clusters being merged.
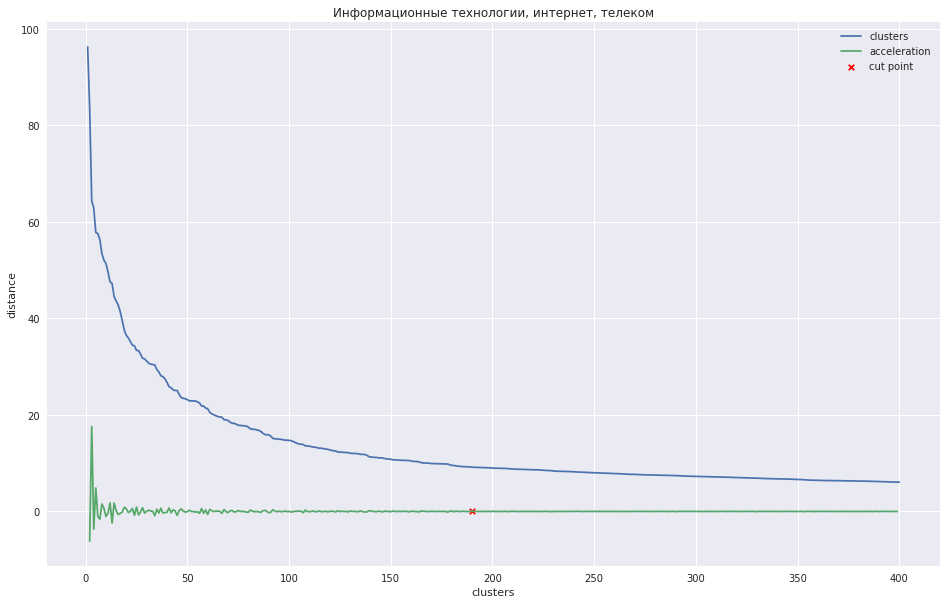
In the case of a small number of clusters, it would be possible to try to cut the tree at the point where the acceleration is maximum, that is, the distance at this point, when the two clusters merged was even larger, and the next step was less. In my case, everything is different - I have many clusters, and I assumed that it is better to cut the dendrogram at the point where the acceleration begins to decrease more monotonously, that is, the distance between the clusters at this level does not mean a separate group. On the chart, this place is approximately at the point where the green line stops dancing.
One could come up with some program method, but it turned out to be faster to mark these places with 28 hands for 28 trade unions and submit the desired number of clusters to the fcluster method, which will cut the tree in the right place.
I saved the data obtained earlier from t-SNE, and noted on them the resulting clusters. It looks pretty good:

In the end, I made a web interface where you can see a summary from each cluster, its position on the chart and give a meaningful name. For convenience, the most frequent title of the summary is derived - it often characterizes the name of the cluster well.
Look at the result of clustering here .
I concluded for myself that the system turned out to be working. Although the division into imperfect clusters and some groups are very similar to each other, some could, on the contrary, be divided into parts, but the main trends of the market of specialties are clearly visible. You can also see how new groups are formed. Resume uploading was done in the summer, so drivers, for example, who want to work at the World Cup , stood out. If you learn how to match each other clusters from launch to launch, you can observe how the main areas of specialization change over time. In fact, ideas for improving quality and development are still full. If I can find in myself the necessary motivation, I will develop further.
Video about agglomerative hierarchical clustering from a course about structure search in data
About scaling and normalization of signs
Tutorial on hierarchical clustering from the SciPy library, which I took as the basis of my task
Comparison of various types of clustering using the example of sklearn libraries
A small bonus. I thought that people wondered how someone was working on a task. I want to say that in some matters I pumped well, while I was doing this project. I tried different options, studied, pondered how this or that thing works. In many places, the lack of a good mathematical base was compensated for by resourcefulness and a large number of attempts. And I would like to share a leaflet with Evernote , in which I made notes, while working on the task. Reflections in it were intended only for me, there are a lot of heresy and incomprehensibility, but I think that this is normal.
UPD: Laid out laptops with data preparation and clustering code. The code did not plan to spread, so sorry for the quality.
Prerequisites
The labor market is constantly in dynamics, new professions arise, others disappear, and I want to have an up-to-date categorization of resume. On hh.ru, the catalog of professional oblasts and specializations has long been outdated: a lot of it is tied up on it, so the changes have not been made for a long time. It would be helpful to learn how to edit these categories painlessly. I attempt to automatically identify these categories. I hope that in the future it will help to solve the problem.
About the selected approach and clustering
By clustering, I will understand the union of objects with the most similar features into one group. In my case, the object is considered a resume, and under the signs of the object - data summary: for example, the frequency of the word "manager" in the resume or salary. The similarity of objects is determined by a pre-selected metric. For now, you can think of it as a black box, to which two objects are fed to the input, and the output is a number that reflects, for example, the distance between objects in a vector space: the smaller the distance, the more similar the objects.
')
The approach I used can be called ascending agglomerative hierarchical clustering. The result of clustering is a binary tree, where there are separate elements in the leaves, and the root of the tree is the collection of all elements. It is called ascending because clustering starts from the lowest level of the tree, from the leaves, where each individual element is considered as a cluster.
Then you need to find the next two clusters and merge them into a new cluster. This procedure must be repeated until there is one cluster with all the objects inside. When clusters are merged, the distance between them is recorded. In the future, these distances can be used to determine where these distances are large enough to consider selected clusters as separate.
Most clustering methods assume that the number of clusters is known in advance, or they try to isolate the clusters on their own, depending on the algorithm and parameters of this algorithm. The advantage of hierarchical clustering is that you can try to determine the desired number of clusters by examining the properties of the resulting tree, for example, to allocate those subtrees to different groups, the distances between which are quite large. It is convenient to work with the resulting structure to search for clusters in it. Conveniently, such a structure is built once and does not need to be rebuilt when searching for the required number of clusters.
Among the shortcomings, I would mention that the algorithm is rather demanding of consumed memory. And even instead of assigning a particular class, I would like to have the probability that the summary of a class belongs to a class in order to look not at one nearest specialty, but at the totality.
Data collection and preparation
The most important part in working with data is their preparation, selection and extraction of features. It is based on what signs will be obtained in the end, will it depend on whether there are patterns in them, whether these patterns will correspond to the expected result and whether this “expected result” is possible at all. Before feeding the data to any machine learning algorithm, you need to have an idea about each feature, whether there are gaps, what type is the feature, what properties does this type of feature have and what is the distribution of values in this feature. It is also very important to choose the algorithm by which the existing data will be processed.
I took resumes that were updated during the last six months. It turned out 2.7 million. From the data on the resume I chose the simplest signs, from which, it seemed to me, the membership of the resume should depend on this or that group. Looking ahead, I will say that the result of clustering all resumes at once did not satisfy me. Therefore, we had to first divide the summary of the already existing 28 professional oblasts.
For each feature, I plotted the distribution to get an idea of how the data looked. Perhaps they should somehow be converted or completely abandoned.
Region So that the values of this attribute could be compared with each other, I assigned the total number of summaries entering this region to each region and took the logarithm of this number to smooth the difference between very large and small cities.
Paul Transformed into a binary sign.
Date of birth . Recalculated in the number of months. Birthday is not specified at all. I filled the gaps with the average values of the age of the specialization to which this resume belongs.
Level of education This is a categorical feature. I coded it with LabelBinarizer .
The name of the position . I drove through TfidfVectorizer with ngram_range = (1,2), used stemmer .
Salary . Translated all values into rubles. Gaps filled in the same way as in age. Took from the logarithm value.
Work schedule . Encoded LabelBinarizer.
Employment rate Made binary, divided into two parts: full-time and all the rest.
Language proficiency . Chose the top most used. Each language is set as a separate feature. The levels of ownership compared the numbers from 0 to 5.
Key skills . Chased through TfidfVectorizer. As a stop word, I collected a small dictionary of general skills and words, which, it seemed to me, do not affect the specialty. All words missed through stemmer. Each key skill can consist not only of one word, but also of several. In the case of several words in the key skill, I sorted the words, and each word was additionally used as a separate attribute. This feature is good only in the “Information Technologies, Internet, Telecom” professional field, because people often indicate the skills relevant to their specialty. I did not use it in the other professional areas because of the abundance of common words in skills.
Specializations . Each of the user-supplied specializations I set as a binary sign.
Experience I took the logarithm of the number of months + 1, since there are people with no work experience.
Standardization
As a result, each resume has become a vector of numbers-signs. The selected clustering algorithm is based on calculating the distance between objects. How to determine what contribution to this distance should make each sign? For example, there is a binary sign - 0 and 1, and another sign can take a lot of values from 0 to 1000.
Standardization comes to the rescue. I used StandardScaler . It converts each feature in such a way that its mean value is zero and the standard deviation from the mean is one. Thus, we try to bring all the data to the same distribution - the standard normal one. Of course, it is far from a fact that the data itself has the nature of a normal distribution. This is one of the reasons to build graphs of the distribution of its parameters and be glad that they look like Gaussians.
So, for example, the schedule of distribution of salaries looked.
It is evident that he has a very heavy tail. To make the distribution more like a normal one, you can take the logarithm from this data. At the same time, emissions will not be as strong.
Dimension reduction
Now it makes sense to transfer the data into a space of a smaller dimension so that the clustering algorithm can later digest them in reasonable time and memory. I used TruncatedSVD , because it can work with sparse matrices and, at the output, gives the usual dense-matrix, which we will need for further work. By the way, in TruncatedSVD also need to submit standardized data.
At the same stage, it is worth trying to visualize the resulting dataset, translating it into two-dimensional space using t-SNE . This is a very important step. If the structure of the resulting image does not show any structure, or, on the contrary, this structure looks very strange, then either there is no necessary pattern in your data, or an error is made somewhere.
I received a lot of very suspicious images before everything went well. For example, once there was such a beautiful image:
The reason of the turned out worms was hit in resume identifiers. And here is something that looks more like the truth:
Clustering
If it seems that everything is in order with the data, then you can start clustering. I used the hierarchy clustering package from SciPy. It allows clustering using the linkage method . I tried all the distance metrics between clusters proposed in the algorithm. The best result was given by the Ward method .
The main problem I encountered is that the clustering algorithm considers the matrix of distances between all the elements, which means quadratic dependence on the number of elements in memory. For 2.7 million resumes, I did not succeed in this, because The amount of memory required is terabytes. All calculations were performed on a regular computer. I do not have so much RAM. Therefore, it seemed to me reasonable that you can first combine the resumes that are nearby, take the centers of the resulting groups and already cluster them with the necessary algorithm. I took MiniBatchKMeans , created with it 30,000 clusters and sent them to hierarchical clustering. It worked, but the result was so-so. Many brightest groups of resumes have stood out, but the details are not enough to find specializations at a good level.
In order to improve the quality of the received specializations, I have divided the data into professional fields. It turned out datasets from 400 000 resumes and less. At this point, it occurred to me that clustering a sample of data was better than using two algorithms in a row. Therefore, I refused MiniBatchKMeans and took up to 100,000 resumes for each specialization so that the linkage method could digest them. 32 Gb of RAM was not enough, so I allocated an extra 100 Gb for the swap. As a result, linkage provides a matrix with the distances between the clusters combined at each step and the number of elements in the resulting cluster.
The algorithm used a quality test to compare different dataset options and different methods for calculating the distance between clusters. The algorithm used the cophenetic correlation coefficient obtained from cophenet . This coefficient shows how well the resulting dendrogram reflects the dissimilarity of objects against each other. The closer the value is to one, the better.
Visualization
The best way to validate the quality of clustering work was visualization. The dendrogram method draws the resulting dendrograms, where clusters can be distinguished by distance or level in the tree:
The following graph shows the dependence of the distance between clusters on the iteration step number, in which the two closest clusters merge into a new one. The green line shows how the acceleration varies - the speed of change of the distance between the clusters being merged.
In the case of a small number of clusters, it would be possible to try to cut the tree at the point where the acceleration is maximum, that is, the distance at this point, when the two clusters merged was even larger, and the next step was less. In my case, everything is different - I have many clusters, and I assumed that it is better to cut the dendrogram at the point where the acceleration begins to decrease more monotonously, that is, the distance between the clusters at this level does not mean a separate group. On the chart, this place is approximately at the point where the green line stops dancing.
One could come up with some program method, but it turned out to be faster to mark these places with 28 hands for 28 trade unions and submit the desired number of clusters to the fcluster method, which will cut the tree in the right place.
I saved the data obtained earlier from t-SNE, and noted on them the resulting clusters. It looks pretty good:
In the end, I made a web interface where you can see a summary from each cluster, its position on the chart and give a meaningful name. For convenience, the most frequent title of the summary is derived - it often characterizes the name of the cluster well.
Look at the result of clustering here .
I concluded for myself that the system turned out to be working. Although the division into imperfect clusters and some groups are very similar to each other, some could, on the contrary, be divided into parts, but the main trends of the market of specialties are clearly visible. You can also see how new groups are formed. Resume uploading was done in the summer, so drivers, for example, who want to work at the World Cup , stood out. If you learn how to match each other clusters from launch to launch, you can observe how the main areas of specialization change over time. In fact, ideas for improving quality and development are still full. If I can find in myself the necessary motivation, I will develop further.
Additional materials
Video about agglomerative hierarchical clustering from a course about structure search in data
About scaling and normalization of signs
Tutorial on hierarchical clustering from the SciPy library, which I took as the basis of my task
Comparison of various types of clustering using the example of sklearn libraries
A small bonus. I thought that people wondered how someone was working on a task. I want to say that in some matters I pumped well, while I was doing this project. I tried different options, studied, pondered how this or that thing works. In many places, the lack of a good mathematical base was compensated for by resourcefulness and a large number of attempts. And I would like to share a leaflet with Evernote , in which I made notes, while working on the task. Reflections in it were intended only for me, there are a lot of heresy and incomprehensibility, but I think that this is normal.
UPD: Laid out laptops with data preparation and clustering code. The code did not plan to spread, so sorry for the quality.
Source: https://habr.com/ru/post/427477/
All Articles