Infrastructure for microservices. K8s and all
I once wrote here about moving from Asia to Europe , and now I want to write what I do in this Europe. There is such a profession - DevOps , or rather not, but it turned out that this is exactly what I am doing now. Now for the orchestration of everything that runs in docker, we use the rancher , which I also wrote about . But a terrible thing happened, rancher 2.0 came out and moved to kubernetes (just k8s), and since k8s is now really a standard for managing a cluster, there was a desire to build the entire infrastructure again with blackjack and librarian. What else adds piquancy is that the company constantly hires different specialists from different countries and with different traditions and someone brings puppet , someone ansible who is nicer, and someone generally thinks that Makefile + bash is our everything. Therefore, there is no single opinion how everything should work, but I really want to.
Pre-assembled such a zoo technology and tools:
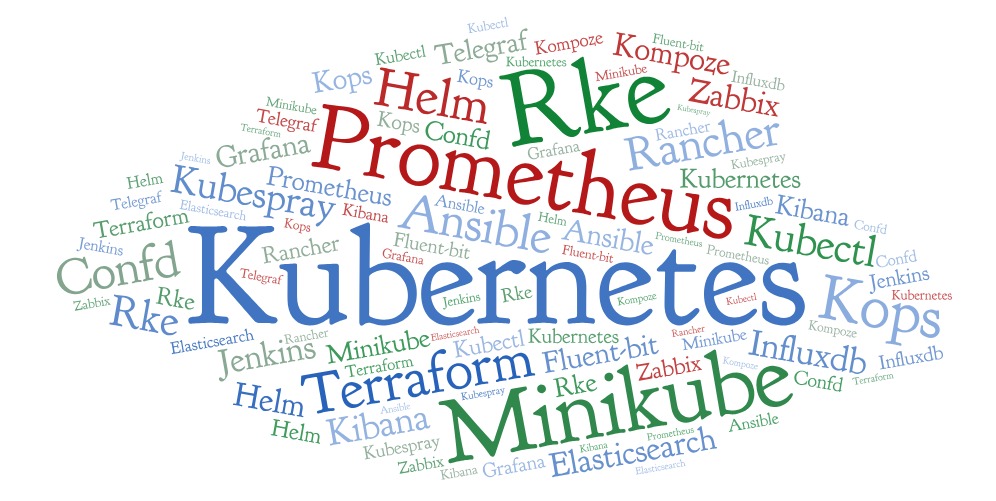
Infrastructure Management
- Minikube
- Rke
- Terraform
- Kops
- Kubespray
- Ansible
Application Management
- Kubernetes
- Rancher
- Kubectl
- Helm
- Confd
- Kompose
- Jenkins
Logging and monitoring
- Elasticsearch
- Kibana
- Fluent bit
- Telegraf
- Influxdb
- Zabbix
- Prometheus
- Grafana
- Kapacitor
Then I will try to briefly describe each item of this zoo, describe why it is necessary and why this particular solution was chosen. In fact, almost any item can be replaced by a dozen analogs and we are still not completely sure of the choice, so if anyone has an opinion or recommendation, I’ll be happy to read in the comments.
The center of everything will be kubernetes because now it really is a solution to which there are simply no alternatives, which are supported by all providers from Amazon and Microsoft to mail.ru. How alternatives were considered
Swarm- which never took offNomad- which strangers seem to have written for predatorsCattle- the engine from the rancher 1.x, on which we live now, basically suits everything, but the rancher has already refused it in favor of k8s so there will be no development.
Creation of infrastructure
First we need to create an infrastructure, and deploy a k8s cluster on it. There are several options, they all work and therefore it is difficult to choose the best one.
Minikube is a great option for running a cluster on a developer’s machine for testing purposes.
Rke - Rancher kubernetes engine, simple as the door; the minimum config for creating a cluster looks like
nodes: - address: localhost role: [controlplane,worker,etcd] And that's all, this is enough to start the cluster on a local machine, while allowing you to create production ready HA clusters, change the configuration, upgrade the cluster, dump etcd the database and much more.
Kops - allows not only to create a cluster, but also to pre-create instances in aws or gce. Also allows you to generate a configuration for terraform. An interesting tool, but we have not yet taken root. It is completely replaced by terraform + rke while being simpler and more flexible.
Kubespray - in fact, it’s just the ansible role that creates the k8s cluster, damn powerful, flexible, configurable. This is practically the default solution for deploying k8s.
Terraform is a tool for building infrastructure in aws, azure, or a bunch of other places. Flexible, stable - I recommend.
Ansible is not exactly about k8s, but we use it everywhere and here too: fix configs, install / update software, distribute certificates. Cheap and angry.
Application Management
So, we have a cluster, now we need to run something useful on it, the only question left is how to do it.
Option one: use naked k8s all deployed with kubectl . In principle, this option has the right to life. Kubectl is a powerful enough tool that allows you to do everything we need, including deployment, upgrading, controlling the current state, changing the configuration on the fly, viewing logs and connecting to specific containers. But sometimes you want everything to be a little more convenient, so go ahead.
Rancher
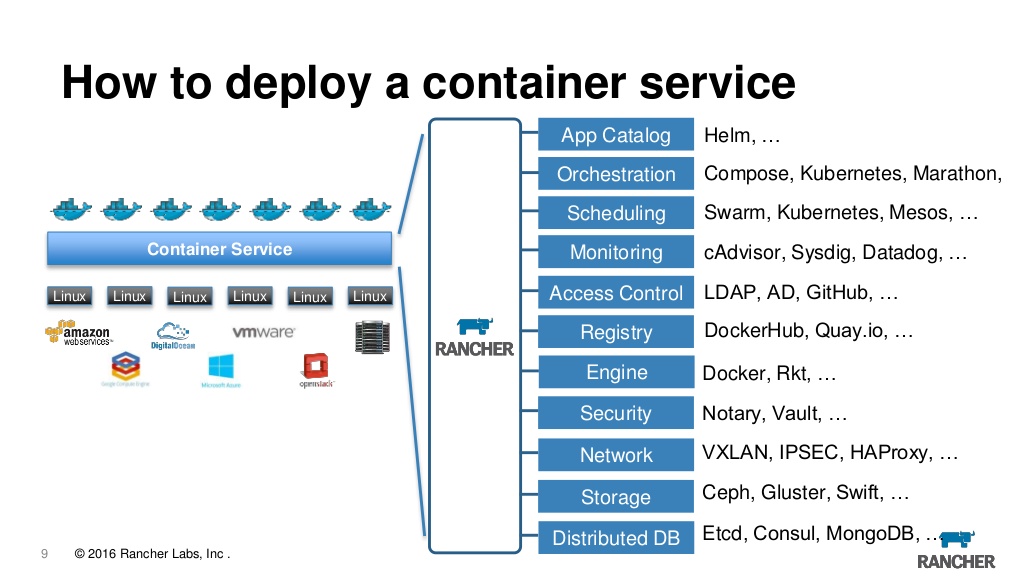
In fact, now rancher is a web muzzle for managing k8s and at the same time a lot of small buns that add convenience. Here you can view logs, access the console and configure and upgrade applications and access control based on roles and the built-in metadata server, alarms, log redirection, secret management and much more. We have been using the rancher of the first version for several years now and are completely satisfied with it, although it must be admitted that when switching to k8s, the question arises whether we really need it. It's nice that you can import any previously created cluster into the rancher, and from any provider, that is, you can import a cluster from EKS from azure and created locally into one server and steer them from one place. Moreover, if you suddenly get bored, you can simply demolish the rancher server and continue using the cluster directly through kubeclt or any other tool.
Now a very correct concept is popular, all as code. For example, infrastructure as code is implemented using terraform , assembly as code is implemented through the jenkins pipeline . Now it's the turn of the application. The installation and configuration of the application must also be described in some manifesto and stored in the gita. Rancher versions 1.x used the standard docker-compose.yml and everything was fine, but when moving to k8s they switched to helm charts . Helm - from my point of view, a completely awful thing with strange logic and architecture. This is one of those projects from which the feeling remains that it was written by predators for strangers or vice versa. The only problem is that in the world of k8s chelm there are simply no alternatives, and this is de facto the standard. Therefore, we will stab at crying, but continue to use helm. In version 3.x, the developers promise to rewrite it almost from scratch, throwing out all the oddities from it and simplifying the architecture. It is then that we will live, but for now we will eat what we have.
You should at least mention jenkins here, it doesn’t relate directly to the topic of cubernetis, but it is with its help that applications are deployed in a cluster. He is, he works and he is a topic for a separate article.
Monitoring
Now we have a cluster and even some application is spinning in it, it would seem - you can breathe out, but in fact everything is just beginning. How stable is our application? How fast? Does he have enough resources? What happens in a cluster at all?
Yes, the next topic is monitoring and logging. There are only three unambiguous answers. Keep logs in elasticsearch , watch them through kibana to draw graphics in grafana . For all other questions there are ten correct answers.
Grafana
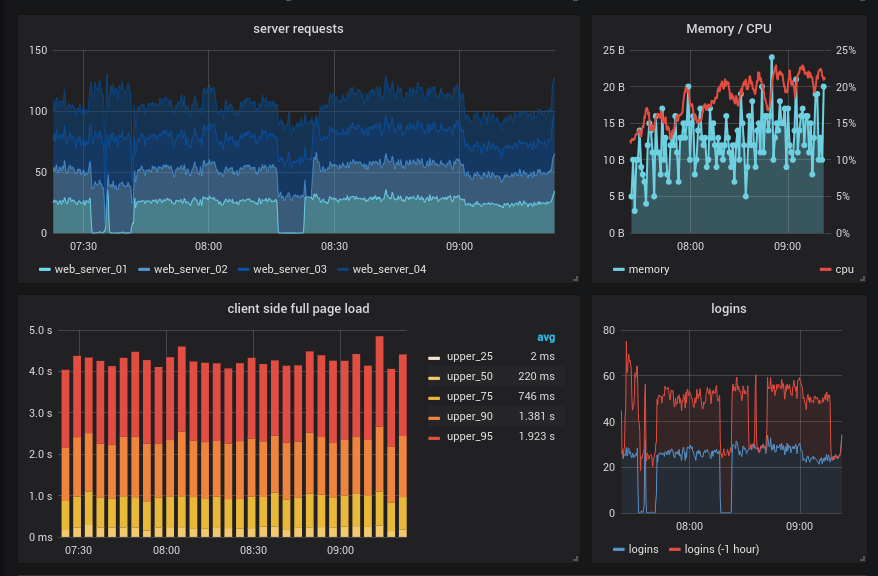
Here we will start with grafana by itself, it does almost nothing, but you can attach it as a beautiful face to any of the systems described below and get beautiful and sometimes vivid graphics, besides you can also set up alarms, but it is better to use other solutions for this, such as prometheus alertmanager and ElastAlert .
fluent-bit
From my point of view at the moment it is the best aggregator and logger of logs, besides it has k8s support right out of the box. There is still Fluentd but it is written in Ruby and pulls along too much legacy of code, which makes it much less attractive. So if you need a specific module from a fluentd which is not yet ported to fluent-bit, use it, in all the others, a bit is the best choice. It is faster, more stable, consumes less memory. Allows you to collect logs from all or selected containers, filter them, enrich them by adding data specific to the cubernetis and send it all to elasticsearch or to many other repositories. If you compare it with traditional logstash + docker-bit + file-bit this solution is definitely better in all respects. Historically, we still use logspout + logstash but fluent-bit definitely wins.
Prometheus
Monitoring system written specifically for microservice architecture. The de facto standard in the industry, moreover, there is a project called Prometheus Operator , written specifically for k8s. Everyone decides what to choose, but it is better to start from bare prometheus, just to understand the logic of his work, it is quite different from the usual systems. We should also mention the node-exporter which allows collecting machine-level metrics and prometheus-rancher-exporter which allows collecting metrics via rancher api. In general, if you have a cluster on kubernetes, then prometheus is a must have.
It could have stopped here, but historically, we still have several monitoring systems. First of all, this zabbix very convenient to see all the problems of the entire infrastructure on one panel. The presence of auto discovery allows on the fly to find and add to the monitoring of new networks, nodes, services and in general almost anything, this makes it more than a convenient tool for monitoring dynamic infrastructures. In addition, in version 4.0, zabbiks added a collection of metrics from exporters of prometheus and it turns out that all this can be very nicely integrated into one system. Although there is not yet a definite answer whether it is necessary to drag zabbix to the k8s cluster, but it is definitely interesting to try.
It is also easy as an option to use TIG (telegraf + influxdb + grafana) is simple, works stably, allows you to aggregate metrics, by containers, applications, nodes, etc., but essentially completely duplicates the prometheus functionality, and "only one should remain".
And this is how it turns out that, before launching anything useful, you need to install and configure a strapping from a couple of dozen support services and tools. At the same time, the article did not raise issues of managing permanent data, secrets and other strange things, each of which can pull on a separate publication.
How do you see the perfect infrastructure for yourself?
If you have an opinion, please write in the comments, or maybe even join our team and help collect it all on the spot.
')
Source: https://habr.com/ru/post/427323/
All Articles