Slow Windows, Part 2: Creating Processes

Windows has long been reproached for the slowness of file operations and creating processes. Have you ever tried to make them even slower? This article will show the technician how to gradually slow down the creation of processes in Windows (to infinity) imperceptibly for most users!
And of course, the article will also tell you how to detect and avoid this problem.
')
This is a real problem that I encountered at the beginning of the year, and the article explains how I discovered it and found a workaround. Previous articles about slowing down Windows:
- Slow Windows, Part 0: Arbitrary Slowdown VirtualAlloc
- Slow Windows, Part 1: File Access
Something is wrong
I'm not looking for trouble, but it seems I found them. Maybe because I’m collecting Chrome from source a hundred times over the weekend or I’m not lucky in my life. I think we will never know. Anyway, this article describes the fifth serious problem that I encountered in Windows when building Chrome.
- Unplanned serialization, which leads to a full UI hang: "24-core processor, and I can not move the cursor . "
- Process handle leak in one of the Microsoft add-ons for Windows: "Zombie processes eat up your memory . "
- Long-standing error in Windows file cache: “Compiler error? Linker Error? Windows kernel bug .
- Performance failure when using file notifications incorrectly: "Slow Windows, Part 1: File Access . "
- And this: a strange architectural solution, which over time slows down the creation of processes.
Tracking rare crash
Computers must be reliable and predictable, and I am annoyed otherwise. If I collect Chrome several hundred times in a row, I would like to see every build successful. So when our distributed compilation process (gomacc.exe) sometimes crashes, I want to investigate it. I have configured automatic dumping of crash dumps , so I see that crashes occur when heap damage is detected. A simple way to check is to turn on the pageheap so that a bunch of Windows put each memory allocation on a separate page. This means that use-after-free and buffer overflows result in instant failure instead of difficult-to-diagnose damage. I already wrote about the inclusion of pageheap using App Verifier .
App Verifier slows down the program for two reasons: memory allocation slows down, and page-aligned allocation almost deactivates the processor’s cache. Thus, a slight slowdown in the assembly was predictable, and it did.
But when I entered later, the assembly seemed to stop altogether. After about 7,000 assembly steps, there was no progress.
O (n ^ 2) - this is usually not good
It turns out that Application Verifier likes to create log files. It does not matter that no one watches these files, he creates them just in case. And these files must have unique names. I'm sure it seemed like a good idea to just give the logs numerical names in ascending order, such as gomacc.exe.0.dat, gomacc.exe.1.dat, and so on.
To get numerical names in ascending order, you need to determine which number to use next. The easiest way is to try possible names / numbers until you find one that has not yet been used. That is, try to create a new file called gomacc.exe.0.dat, and if it already exists, try gomacc.exe.1.dat and so on.
What can go wrong?
In fact, at worst everything is pretty bad.
It turns out that if you perform a linear search for an unused file name when creating a process, then the launch of N processes takes O (N ^ 2) operations. Common sense dictates that O (N ^ 2) algorithms are too slow if you cannot guarantee that N always remains relatively small.
How bad the situation will be depends on how long it takes to check for the existence of a file. I took measurements and found that in Windows it takes about 80 microseconds (80 μs or 0.08 ms). The launch of the first process is fast, but the launch of the 1000th process requires scanning 1000 already created log files. It takes 80 ms, and then even more.
A typical Chrome build requires running the compiler about 30,000 times. Each compiler run requires scanning N previously created log files, 0.08 ms to check each file. A linear search for the next available log file name means that (N ^ 2) / 2 file existence checks are required to run N processes, that is, 30,000 * 30,000 / 2, which is 450 million. Since each file existence check takes 0.08 ms, it is 36 million milliseconds, or 36,000 seconds. That is, the build time of Chrome, which usually ranges from five to ten minutes, will increase by another ten hours.
Pancake.
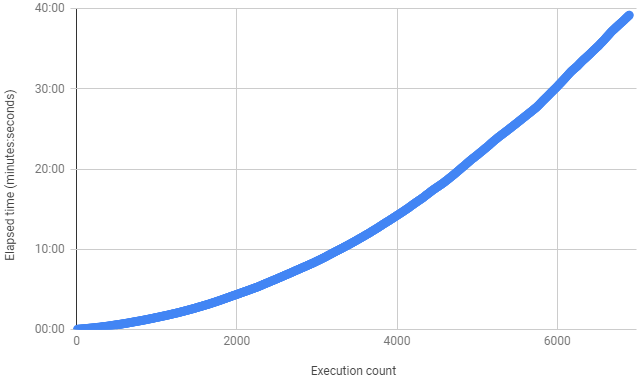
When writing this article, I reproduced the error by running an empty executable file about 7000 times - and I saw a clear O (n ^ 2) curve like this:
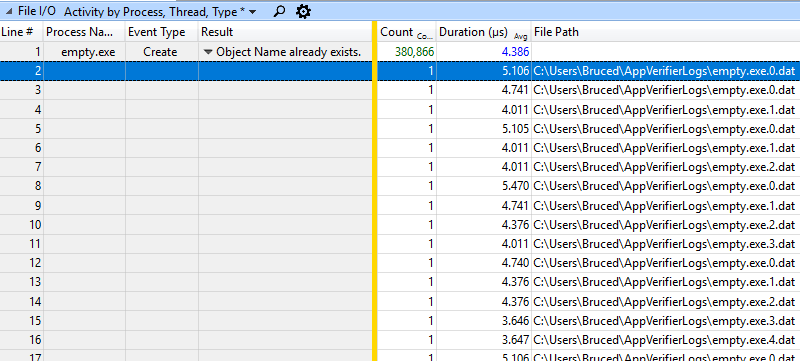
Strangely enough, if you take the ETW trace and look at the average call time for CreateFile, then for almost all files the result is less than five microseconds (an average of 4.386 μs in the example below):
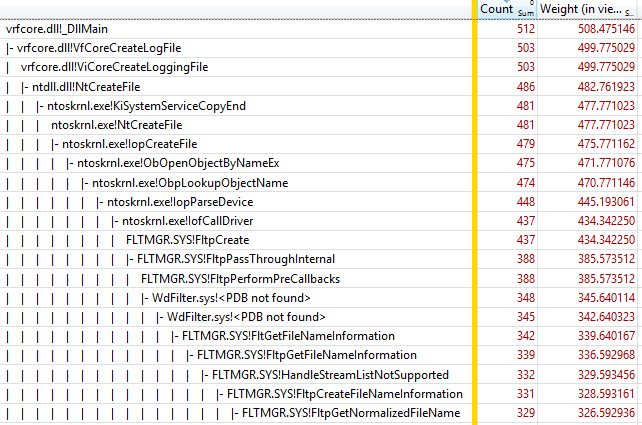
It looks like the simple ETW limit on file I / O tracing is shown here. File I / O events track only the lowest level of the file system, and there are many more levels above Ntfs.sys, including FLTMGR.SYS and ntoskrnl.exe. However, the slowdown can not be completely hidden - the use of CPU can be seen on the graph of CPU Usage. The screenshot below shows the time interval of 548 ms, which is the creation of a single process. Basically, all the time is spent only on scanning about 6850 possible log file names:
Will a more productive disk help?
Not.
The amount of data processed is small, and the amount of writing to disk is even smaller. During my tests for playing the bug, the disk was almost completely idle. This problem is related to the CPU, since all the corresponding disk data is cached. And even if overheads were reduced by an order of magnitude, they would still be too large. You can not improve the algorithm O (N ^ 2).
Detection
This particular problem can be detected by performing a search in% userprofile% \ appverifierlogs for .dat files. In general, you can detect a slowdown in creating processes by examining the ETW trace, and now you know what to look for.
Decision
The simplest solution is to disable logging. It will also stop filling the disk with gigabytes of logs. It is disabled by the following command:
appverif.exe -logtofile disableAfter turning off logging, I found that my processes started about three times faster (!) Than at the beginning of the test, and the slowdown completely disappeared. 7000 Application Verifier monitored processes are created in 1.5 minutes, not 40 minutes. With my simple batch file for tests and a simple process, I see these speeds for creating processes:
- usually 200 per second (5 ms per process)
- 75 per second with Application Verifier enabled, but logging disabled (13 ms per process)
- 40 per second with Application Verifier enabled and journaling enabled, at first ... (25 ms per process, time gradually increases to infinity)
- 0.4 per second after a single Chrome build
Microsoft can fix this problem by abandoning the monotonous increase in the numbers of log files. If they used the current date and time as a file name (up to a millisecond or higher resolution), they would get more semantically meaningful log names, which are created very quickly with almost no search logic for a unique file.
But Application Verifier is no longer supported, and log files are still useless, so just turn them off.
Auxiliary information
Batch files and a script to recreate the bug after enabling Application Verifier for empty.exe can be found here .
ETW tracing from about the end of the experiment - here .
Other links:
Raw timing data used to create graphics
Reddit Talk
Hacker News Talk
For examples of other O (n ^ 2) algorithms that go peddling, see the Accidentally Quadratic.
For a more mundane pleasure, see a video of my 19 different ways to get to work in September — I was too busy to continue the experiment this month.
Source: https://habr.com/ru/post/427303/
All Articles