10 tricks for advanced dashboarding in Splunk. Part 1

Good day!
Today we want to share with you an insider with the annual large-scale event Splunk .conf18, which took place in early October. Splunk .conf is the place where experts and Splunk developers share their experience, various features and useful tools for work.
')
In two articles we will talk about 10 life hacking dashboards developers that were proposed at the conference. Why are we talking about this? Because the better the application looks, the better the information in it is perceived. In order to make really good dashboards, there are already many built-in or easily integrable tools, though not everyone knows where and how to find them. In more detail about them and how to use them, look under a cat.
In order to engage in the development of advanced dashboards in Splunk, it is advisable to at least to some extent be familiar with the following things:
- Simple xml
- Javascript
- CSS
- jQuery
But even if you are not familiar, for not very complicated things (but still going beyond the basic automatic visualization), you can find examples, presets, or rather quickly figure it out yourself.
0. Splunk Dashboard Examples
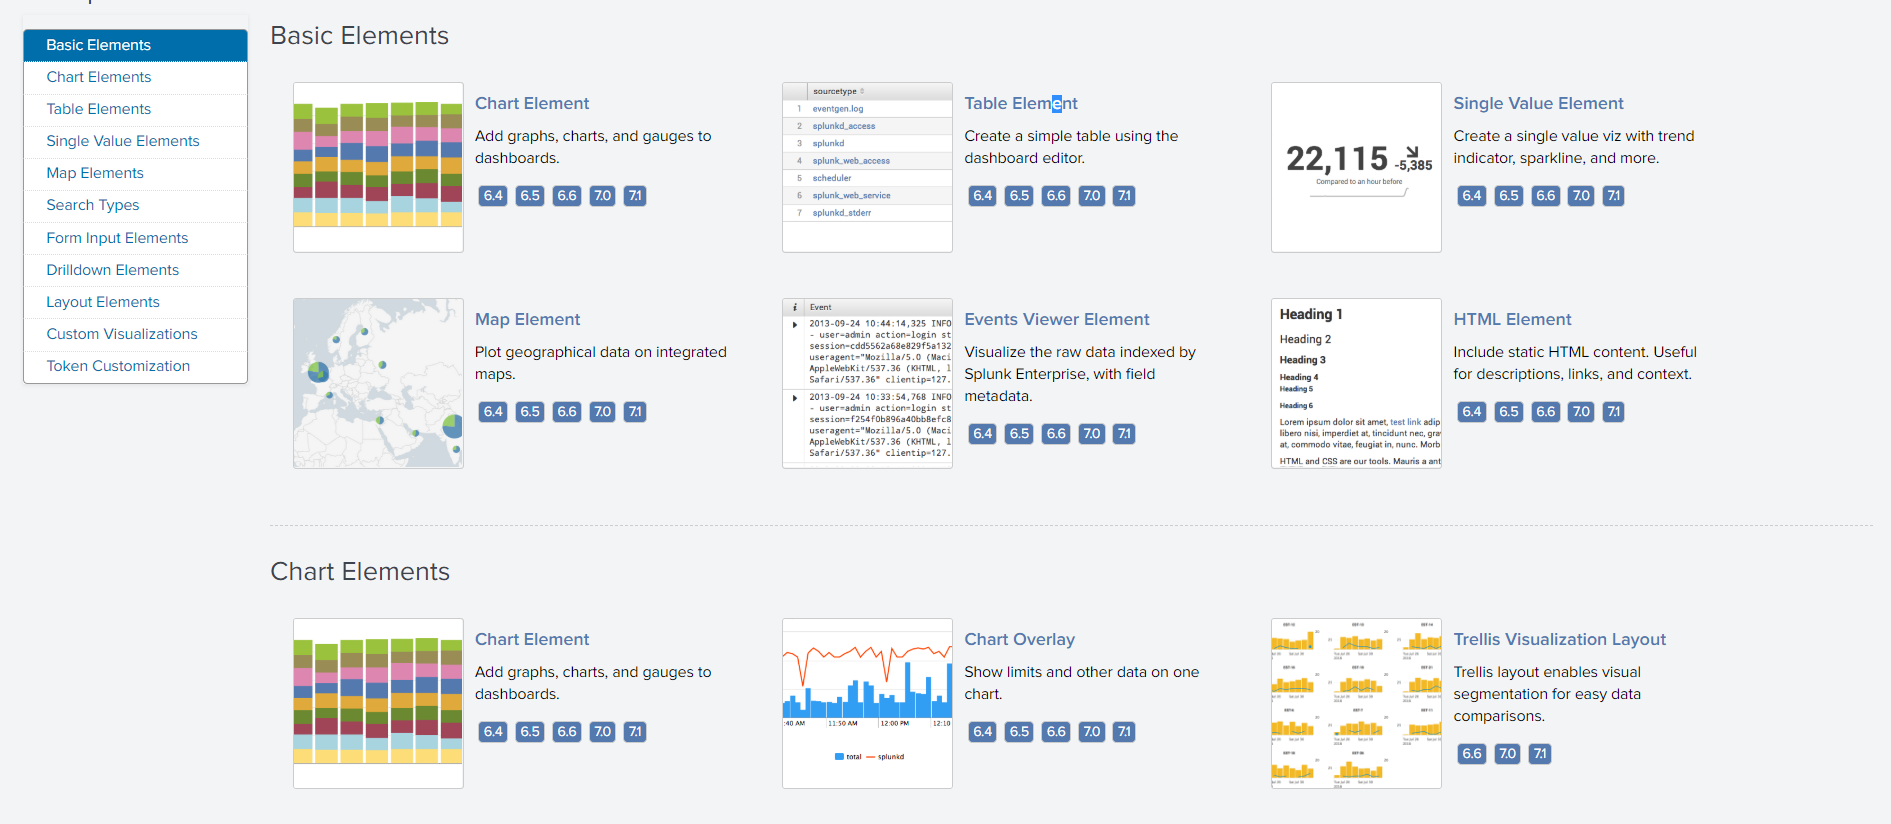
Before proceeding to specific chips, it should be noted that there is a special application with examples of dashboards of varying complexity, as well as scripts that are behind these dashboards. Having looked through this application, you can gather ideas, see how this or that graph is implemented, find the templates for the sss and js scripts, in general, a useful thing.

You can download the link .
1. Development mode
To avoid many bugs in the development of dashboards, especially when testing ss and js, it is recommended to make changes in the caching and updating process.
Web.conf
You need to create (or change) the configuration file /etc/system/local/web.conf, adding the following settings:
[settings]
minify_js = False
minify_css = False
js_no_cache = True
cacheEntriesLimit = 0
cacheBytesLimit = 0
enableWebDebug = True
Browser
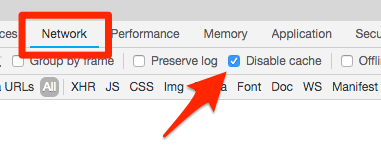
Disable browser caching.
For example, for Google Chrome, this can be done in the “Page Code” section:
Selective update
It should be noted that Splunk can be restarted not only through the command line or the web interface, but also through the URL:
http://localhost:8000/en-US/debug/refreshAs a result, you will receive a report that has been updated about 100 items (sometimes it takes a long time)
Report
Entity refresh control page
===========================
'''
Forces a refresh on splunkd resources

This method calls a splunkd refresh on all registered EAI handlers that
advertise a reload function. Alternate entities can be specified by appending
them via URI parameters. For example,

http://localhost:8000/debug/refresh?entity=admin/conf-times&entity=data/ui/manager

will request a refresh on only 'admin/conf-times' and 'data/ui/manager'.

1) not all splunkd endpoints support refreshing.
2) auth-services is excluded from the default set, as refreshing that system will
logout the current user; use the 'entity' param to force it
'''

Refreshing admin/conf-times OK
Refreshing data/ui/manager OK
Refreshing data/ui/nav OK
Refreshing data/ui/views OK
Refreshing admin/MonitorNoHandle OK
Refreshing admin/WinEventLog OK
Refreshing admin/WinHostMon OK
Refreshing admin/WinNetMon OK
Refreshing admin/WinPrintMon OK
Refreshing admin/WinRegMon OK
Refreshing admin/alert_actions OK
Refreshing admin/applicense OK
Refreshing admin/clusterconfig OK
Refreshing admin/collections-conf OK
Refreshing admin/commandsconf OK
Refreshing admin/conf-checklist OK
Refreshing admin/conf-deploymentclient OK
Refreshing admin/conf-inputs OK
Refreshing admin/conf-times OK
Refreshing admin/conf-wmi OK
Refreshing admin/cooked OK
Refreshing admin/crl ResourceNotFound Invalid action for this internal handler (handler: crl, supported: list|_reload, wanted: list).
Refreshing admin/datamodel-files OK
Refreshing admin/datamodelacceleration OK
Refreshing admin/datamodeledit OK
Refreshing admin/dataset_consolidation_datamodeleditOK
Refreshing admin/deploymentserver OK
Refreshing admin/distsearch-peer OK
Refreshing admin/eventtypes OK
Refreshing admin/fields OK
Refreshing admin/fvtags OK
Refreshing admin/health-report-config OK
Refreshing admin/http OK
Refreshing admin/index-archiver OK
Refreshing admin/indexer-discovery-configOK
Refreshing admin/indexes OK
Refreshing admin/limits OK
Refreshing admin/livetail OK
Refreshing admin/localapps OK
Refreshing admin/lookup-table-files OK
Refreshing admin/macros OK
Refreshing admin/manager OK
Refreshing admin/messages-conf OK
Refreshing admin/metrics-reload OK
Refreshing admin/modalerts OK
Refreshing admin/modinput_eventgen OK
Refreshing admin/monitor OK
Refreshing admin/msftapps_winfra_configuredOK
Refreshing admin/nav OK
Refreshing admin/nginx_status OK
Refreshing admin/panels OK
Refreshing admin/passwords OK
Refreshing admin/pools OK
Refreshing admin/powershell OK
Refreshing admin/powershell2 OK
Refreshing admin/proxysettings OK
Refreshing admin/quickstart OK
Refreshing admin/raw OK
Refreshing admin/remote_eventlogs OK
Refreshing admin/remote_indexes BadRequest The following required arguments are missing: repositoryLocation.
Refreshing admin/remote_monitor OK
Refreshing admin/remote_perfmon OK
Refreshing admin/remote_raw OK
Refreshing admin/remote_script OK
Refreshing admin/remote_udp OK
Refreshing admin/savedsearch OK
Refreshing admin/scheduledviews OK
Refreshing admin/script OK
Refreshing admin/search-head-bundles OK
Refreshing admin/serverclasses OK
Refreshing admin/shclusterconfig OK
Refreshing admin/sourcetypes OK
Refreshing admin/splunktcptoken OK
Refreshing admin/ssl OK
Refreshing admin/syslog OK
Refreshing admin/tcpout-default OK
Refreshing admin/tcpout-group OK
Refreshing admin/tcpout-server OK
Refreshing admin/telemetry OK
Refreshing admin/transforms-extract OK
Refreshing admin/transforms-lookup OK
Refreshing admin/transforms-reload OK
Refreshing admin/transforms-statsd OK
Refreshing admin/udp OK
Refreshing admin/ui-prefs OK
Refreshing admin/ui-tour OK
Refreshing admin/views OK
Refreshing admin/viewstates OK
Refreshing admin/visualizations OK
Refreshing admin/vix-indexes OK
Refreshing admin/vix-providers OK
Refreshing admin/win-admon OK
Refreshing admin/win-event-log-collectionsOK
Refreshing admin/win-eventlogs OK
Refreshing admin/win-perfmon OK
Refreshing admin/win-regmon OK
Refreshing admin/win-wmi-collections OK
Refreshing admin/workflow-actions OK
DONE
But it is not always necessary to update everything, so in the case of an update via / debug / refresh, you can specify specific elements that need to be rebooted.
An example URL address that will allow only navigation files and dashboards themselves to be reloaded:
http://localhost:8000/en-US/debug/refresh?entity=data/ui/views&entity=data/ui/navReport:
Entity refresh control page
===========================
'''
Forces a refresh on splunkd resources

This method calls a splunkd refresh on all registered EAI handlers that
advertise a reload function. Alternate entities can be specified by appending
them via URI parameters. For example,

http://localhost:8000/debug/refresh?entity=admin/conf-times&entity=data/ui/manager

will request a refresh on only 'admin/conf-times' and 'data/ui/manager'.

1) not all splunkd endpoints support refreshing.
2) auth-services is excluded from the default set, as refreshing that system will
logout the current user; use the 'entity' param to force it
'''

Refreshing data/ui/views OK
Refreshing data/ui/nav OK
DONE
2. Dynamic content
Often, the data is not homogeneous, so not always all the graphs are relevant in constant mode. How to make it so as not to look, for example, on an empty card? (Or any other chart for which at some point there is not enough information)

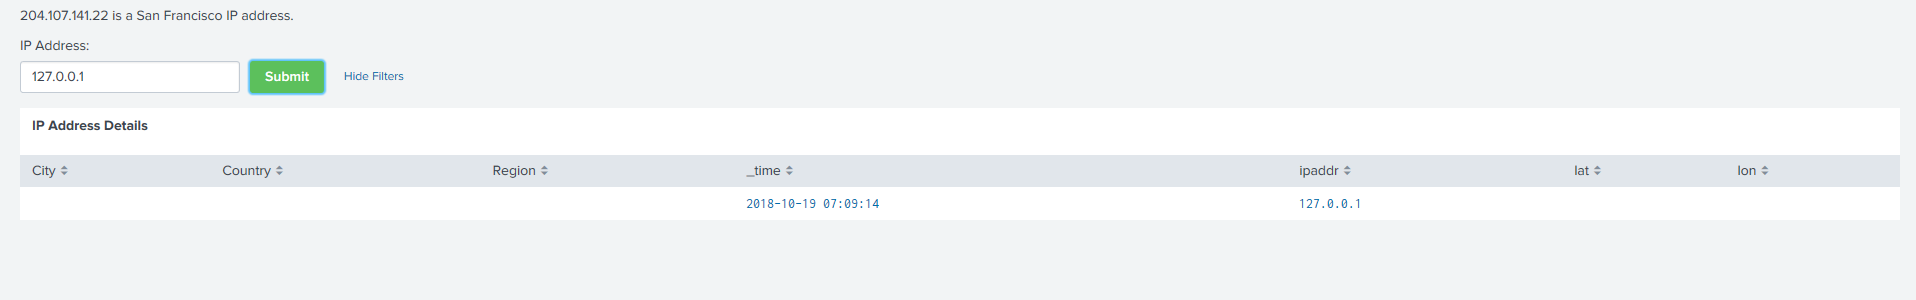
This example is based on the iplocation command, which by IP address gives latitude and longitude, which are then mapped. But if suddenly our search will be based on a “gray” IP address, for example, 127.0.0.1, then the command will not give us the result and there will be nothing on the map.
To avoid looking at an empty card, tokens will come to the rescue.
We impose the condition that if the value of the lat field (latitude) is empty, then there will be no token, and if the value is present, then we will set the token to some value.
<search id="map_search"> <query> | makeresults | eval ipaddr="$ipaddr$" | iplocation ipaddr </query> <progress> <condition match='$result.lat$!=""'> <set token="show_map">true</set> </condition> <condition> <unset token="show_map"></unset> </condition> </progress> </search> And then we set the dependence of the panel with the card on this token.
<panel depends="$show_map$"> <map> <title>The map shows up if geostats can determine lat and lon</title> <search base="map_search"> <query>geostats count by ipaddr</query> </search> </map> </panel> Here's what happened:

Tokens are a very powerful tool for creating dynamic dashboards. Read more about them at the link.
3. Bootstrap
Bootstrap is a free set of tools for creating websites and web applications. Includes HTML and CSS design templates for typography, web forms, buttons, tags, navigation blocks, and other web interface components, including JavaScript extensions.
With it, you can just get a lot of cool features out of the box for your dashboards. Moreover, Bootstrap is recognized by Splunk itself as a tool for working with its dashboards.
For example, using the template, add a dialog box to our dashboards.

To do this, we will add a button that brings up a dialog box with the following code:
<panel> <html> <!-- Button trigger modal --> <button type="button" class="btn btn-primary" data-toggle="modal" data-target="#exampleModal"> Launch demo modal </button> <!-- Modal --> <div class="modal fade" id="exampleModal" tabindex="-1" role="dialog" aria-labelledby="exampleModalLabel" aria-hidden="true"> <div class="modal-dialog" role="document"> <div class="modal-content"> <div class="modal-header"> <h5 class="modal-title" id="exampleModalLabel">Modal title</h5> <button type="button" class="close" data-dismiss="modal" aria-label="Close"> <span aria-hidden="true"/> </button> </div> <div class="modal-body"> 204.107.141.22 is a San Francisco IP address. </div> <div class="modal-footer"> <button type="button" class="btn btn-primary" data-dismiss="modal">Close</button> </div> </div> </div> </div> </html> </panel> Find this code on the website getbootstrap.com.
Be careful that the code works correctly and the elements appear on the dashboard, the code must be inside the panel, and you also need to indicate that it is html.
<panel> <html> … </html> </panel> In addition to the dialog boxes, there is still a lot of interesting things. We advise you to carefully study the site getbootstrap.com and all the tools presented.
4. Static sources
What are static sources? These are different pictures, icons, styles, scripts that you can place or use on dashboards.
They should be stored in the file system:
$SPLUNK_HOME/etc/apps/<your_app>/appserver/static/<your_resource>Access can also be obtained via the URL:
http://splunk_adress :splunk_port/static/app/<your_app>/<your_resource>For example, add an icon to the table header.
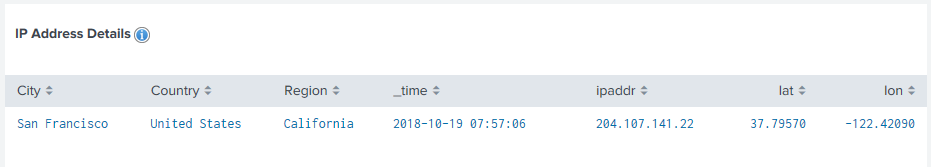
To do this, convert the panel title to html and use the title tag and add an icon there using an image tag.
<panel> <html> <h3 class="dashboard-element-title">IP Address Details <img src="/static/app/dashboard_tips/info.png"/> </h3> </html> <table> <search base="map_search"></search> </table> </panel> You can also add a picture / icon, text, code, etc. to the empty panel:

<panel> <html> <p> <img src="/static/app/dashboard_tips/info.png"/> This image lives here on the file system: <code>$SPLUNK_HOME/etc/apps/APP_NAME/appserver/static</code> </p> </html> </panel> 5. Splunk Style Guide
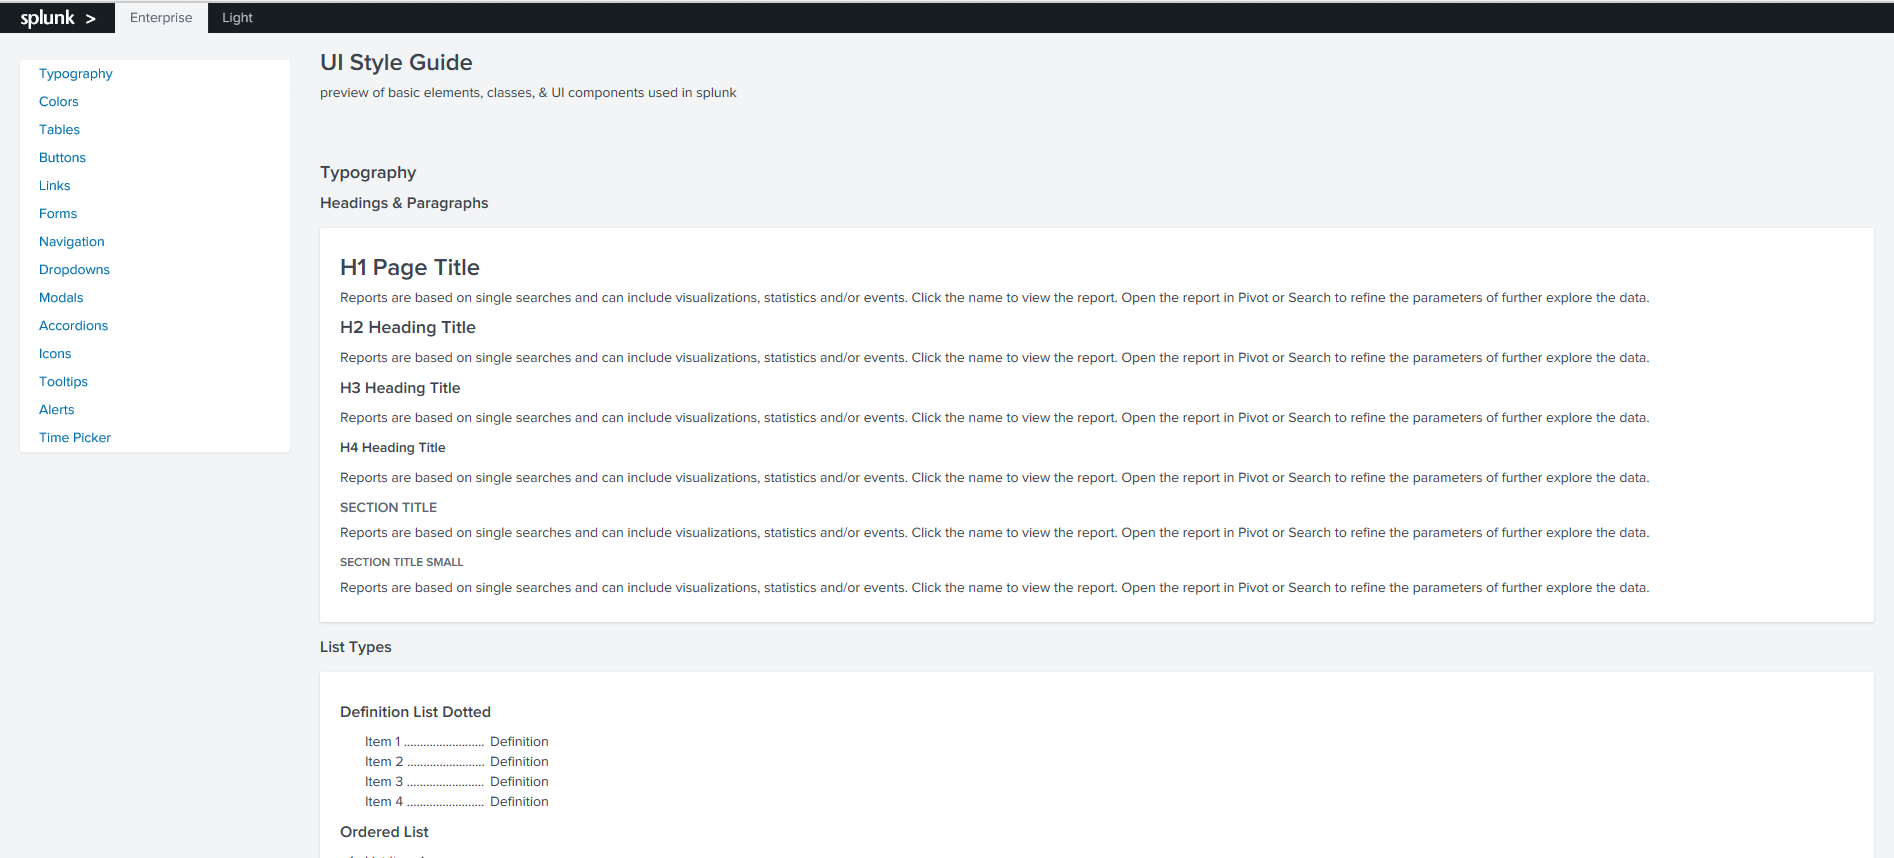
This is a guide to colors, icons, font sizes, etc., which can be used for Splunk dashboards, so as not to stand out from the general design. Elements can be referred to as a class and used in their dashboards.
You can find the Style Guide at the following URL:
http:// splunk_adress:splunk_port /en-US/static/docs/style/style-guide.html

Let's add the user icon from the Style Guide to the dashboards, additionally changing its size and color.

For this we use the following code:
<panel> <html> <p> Check it out: <br /> <i class="icon-user"></i> </p> <p> Change the font size: <br /><br /> <i class="icon-user" style="font-size:3em"></i> </p> <p> Change the color: <br /><br /> <i class="icon-user" style="font-size:3em; color: #5CC05C"></i> </p> </html> </panel> In this article, we looked at simple examples of how to adjust the dynamics on the dashboard, put different elements there, how to find and add different templates. In the next article, we will move on implementing more complex things using JavaScript.
The application with the examples shown can be found on GitHub .
If you have not tried Splunk yet, then it's time to start, the free version up to 500MB per day is available to everyone. And if you have questions or problems with Splunk - you can ask them to us , and we will help.
We are the official Premier Splunk Partner .

Source: https://habr.com/ru/post/426981/
All Articles