Installing kubernetes via kubespray (local-storage, installing Elasticsearch + Fluentd + Kibana, prometheus)
How to raise the High-Availability Kubernetes cluster and not to blow up the brain? Use Kubespray, of course.
Kubespray is a set of Ansible roles for the installation and configuration of the orchestration system with Kubernetes containers.
Kubernetes is an open source project designed to manage a cluster of Linux containers as a single system. Kubernetes manages and runs containers on a large number of hosts, and also provides co-location and replication of a large number of containers.
Carefully, under the cat 4 screenshots of elasticsearch and 9 screenshots of prometheus!
Training
There are 3 Centos 7 nodes with 8GB of memory.
We perform the following on each node.
We connect the disks which sizes are necessary to us.
For elastic, you need 3 PV over 30GB (data.persistence.size) and 2 PV over 4GB (master.persistence.size).
To do this, on each node we create 2 disks of the sizes we need.
The size of the disk depends on the number of your data - you need to check it experimentally.
Disk /dev/vdb: 21.5 GB Disk /dev/vdc: 53.7 GB Through fdisk we create on each 1 section
In / mnt / disks create a folder with the name of our new disk
mkdir -p /mnt/disks/vdb1 mkdir -p /mnt/disks/vdc1 Create FS on these disks
mkfs.xfs -f /dev/vdb1 mkfs.xfs -f /dev/vdc1 Mount disks in this folder
mount /dev/vdb1 /mnt/disks/vdb1 mount /dev/vdc1 /mnt/disks/vdc1 Check
mount | grep mnt /dev/vdb1 on /mnt/disks/vdb1 type xfs (rw,relatime,attr2,inode64,noquota) /dev/vdc1 on /mnt/disks/vdc1 type xfs (rw,relatime,attr2,inode64,noquota) Turning off the Firewall on all nodes (I think this is a crutch, but so far)
systemctl stop firewalld iptables -F Download kubespray and run the installation of kubernetes
git clone https://github.com/kubernetes-incubator/kubespray.git cd kubespray sudo pip install -r requirements.txt We bring inventory / sample / hosts.ini to the following form (replace the names of the nodes with your own)
[k8s-cluster:children] kube-master kube-node [all] test-tools-kuber-apatsev-1 ansible_host=ip-- ip=ip-- test-tools-kuber-apatsev-2 ansible_host=ip-- ip=ip-- test-tools-kuber-apatsev-3 ansible_host=ip-- ip=ip-- [kube-master] test-tools-kuber-apatsev-1 test-tools-kuber-apatsev-2 test-tools-kuber-apatsev-3 [kube-node] test-tools-kuber-apatsev-1 test-tools-kuber-apatsev-2 test-tools-kuber-apatsev-3 [etcd] test-tools-kuber-apatsev-1 test-tools-kuber-apatsev-2 test-tools-kuber-apatsev-3 [calico-rr] [vault] test-tools-kuber-apatsev-1 test-tools-kuber-apatsev-2 test-tools-kuber-apatsev-3 Change the values below in the inventory / sample / group_vars / k8s-cluster / addons.yml file
helm_enabled: true # helm local_volume_provisioner_enabled: true # local volume provisioner ingress_nginx_enabled: true # ingress controller Add to the end of the inventory / sample / group_vars / k8s-cluster.yml file
docker_dns_servers_strict: no # 'no', DNS 3 Run the installation
Before installing, read the documentation kubespray https://github.com/kubernetes-incubator/kubespray
ansible-playbook -u 'user who has sudo on nodes' -i inventory / sample / hosts.ini cluster.yml -b
Checking the availability of StorageClass
kubectl get storageclass NAME PROVISIONER AGE local-storage kubernetes.io/no-provisioner 18m Check PV
kubectl get pv local-pv-26b51a64 49Gi RWO Delete Available local-storage 11m local-pv-5bec36e4 19Gi RWO Delete Available local-storage 14m local-pv-81c889eb 49Gi RWO Delete Available local-storage 13m local-pv-aa880f42 19Gi RWO Delete Available local-storage 10m local-pv-b6ffa66b 19Gi RWO Delete Available local-storage 11m local-pv-d465b035 49Gi RWO Delete Available local-storage 10m Initiate Helm
helm init --service-account tiller Run the installation of elasticsearch
helm install stable/elasticsearch --namespace logging --name elasticsearch --set data.persistence.storageClass=local-storage,master.persistence.storageClass=local-storage Wait 5 minutes for the elasticsearch to install.
We find the service that will connect kibana and fluentd. In its name usually has elasticsearch-client
kubectl get services --namespace logging | grep elasticsearch elasticsearch-client ClusterIP 10.233.60.173 <none> 9200/TCP 19s elasticsearch-discovery ClusterIP None <none> 9300/TCP 19s The name elasticsearch-client is specified when installing fluentd-elasticsearch
helm install stable/fluentd-elasticsearch --namespace logging --set elasticsearch.host=elasticsearch-client The name elasticsearch-client is specified when installing kibana
helm install --namespace logging --set ingress.enabled=true,ingress.hosts[0]=kibana.mydomain.io --set env.ELASTICSEARCH_URL=http://elasticsearch-client:9200 stable/kibana We look that all pods have the status of running
kubectl get pod --namespace=logging If there is an error, we look at the logs.
kubectl logs - --namespace logging Add to DNS or to file / etc / hosts
IP-- kibana.mydomain.io IP-- kibana.mydomain.io IP-- kibana.mydomain.io Note: if you want to send logs to an external Elasticsearch, you should start the installation with elasticsearch.host = dns-name of your-external-elasticsearch
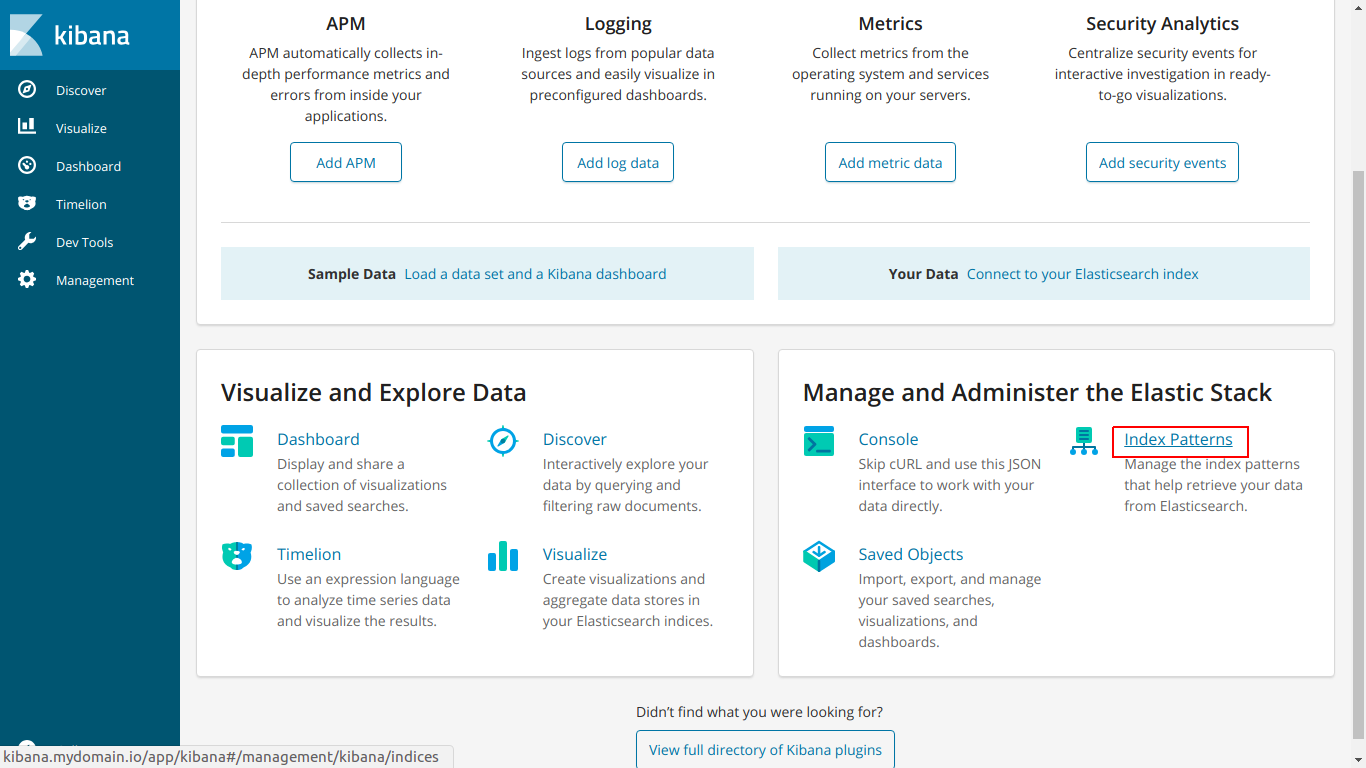
Go to kibana.mydomain.io
Click Index Pattern
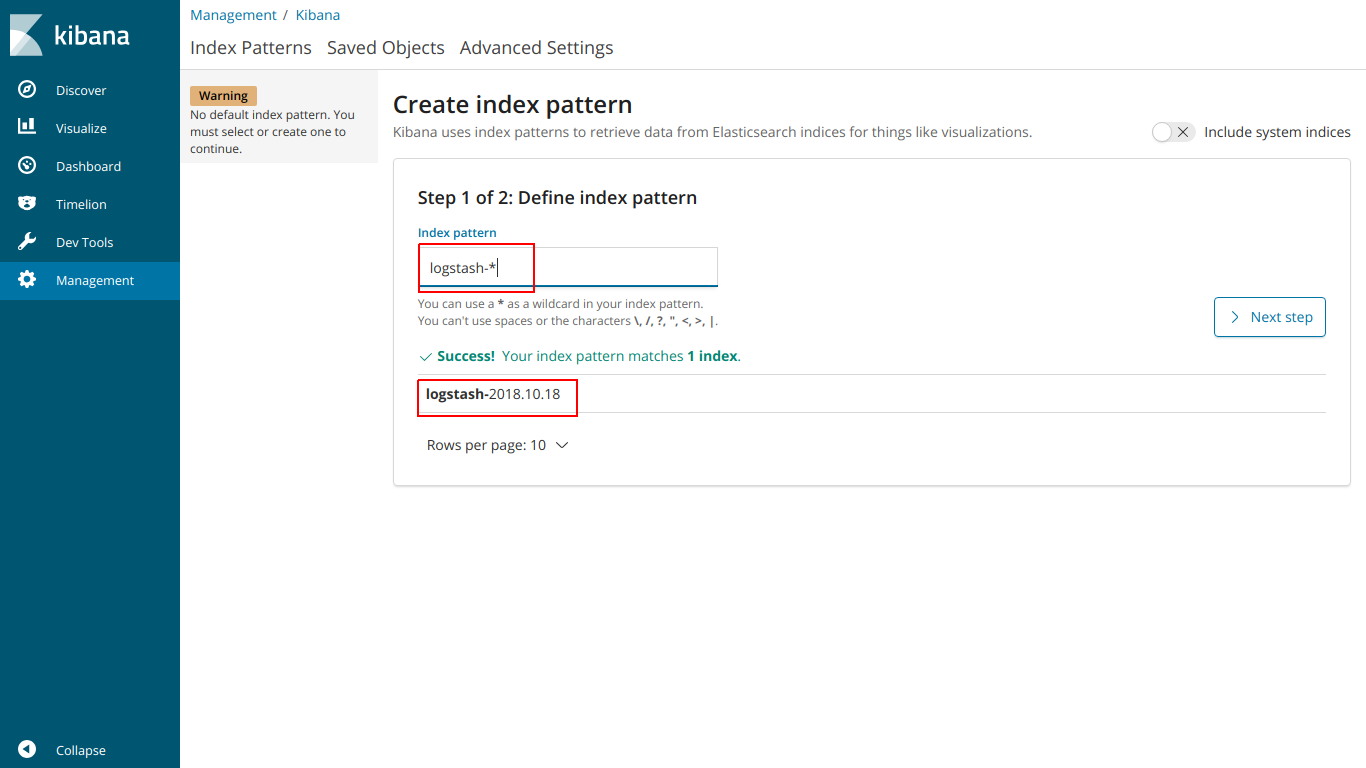
Enter the name of the index so that it matches the index below.
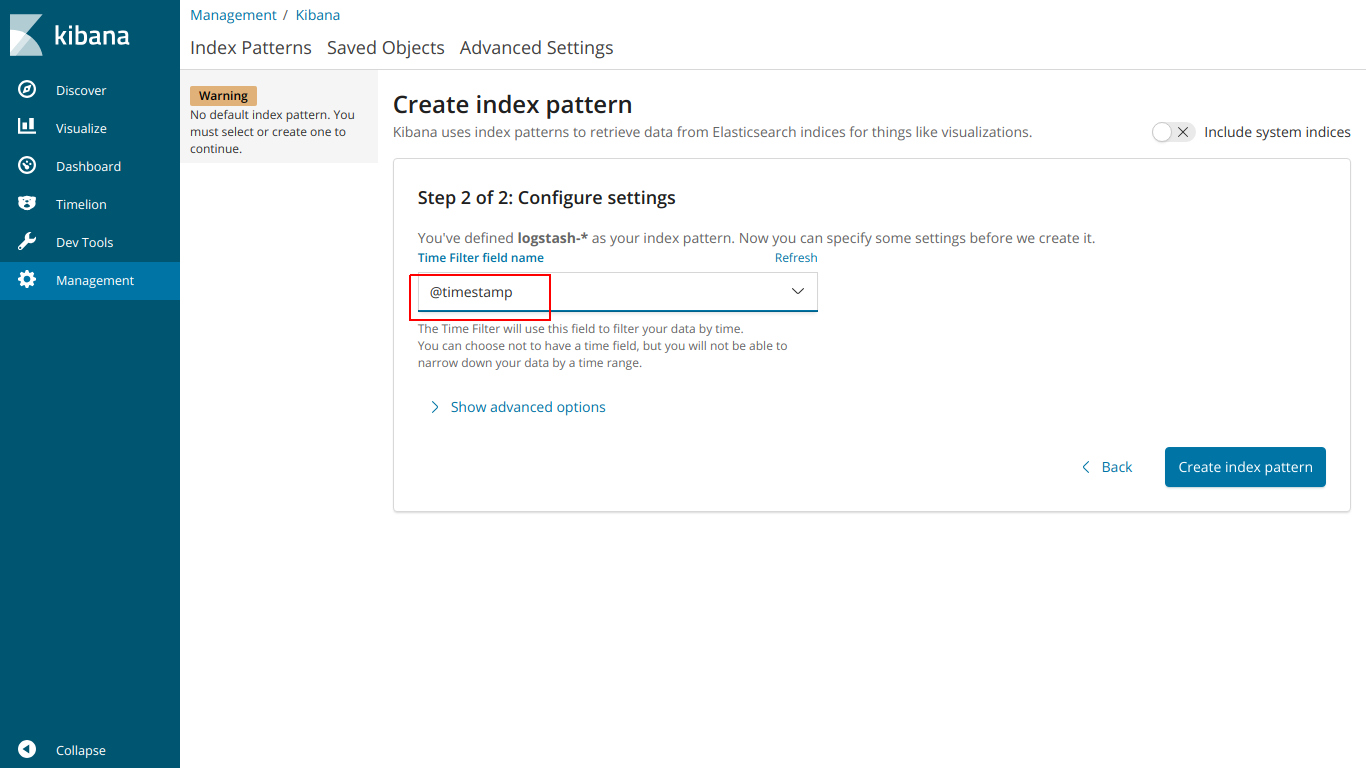
select @ timestamp
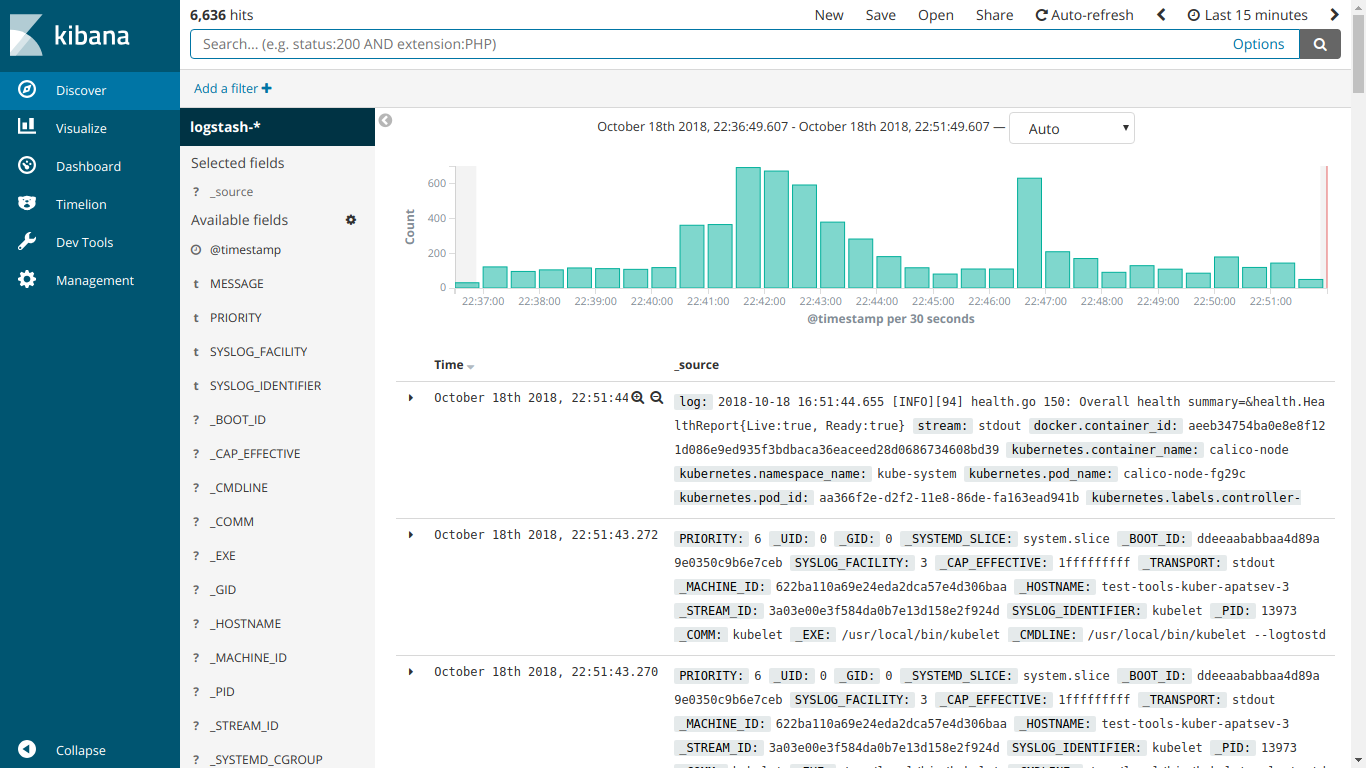
And here EFK works
Run the installation of kube-prometheus
Download prometheus-operator
git clone https://github.com/coreos/prometheus-operator.git Go to the folder kube-prometheus
cd prometheus-operator/contrib/kube-prometheus Run the installation according to the instructions on the site
kubectl create -f manifests/ || true until kubectl get customresourcedefinitions servicemonitors.monitoring.coreos.com ; do date; sleep 1; echo ""; done until kubectl get servicemonitors --all-namespaces ; do date; sleep 1; echo ""; done kubectl create -f manifests/ 2>/dev/null || true Create an ingress-grafana-prometheus.yml file
apiVersion: extensions/v1beta1 kind: Ingress metadata: name: test namespace: monitoring spec: rules: - host: grafana.mydomain.io http: paths: - backend: serviceName: grafana servicePort: 3000 Create an ingress resource
kubectl create -f ingress-grafana-prometheus.yml add to DNS or to file / etc / hosts
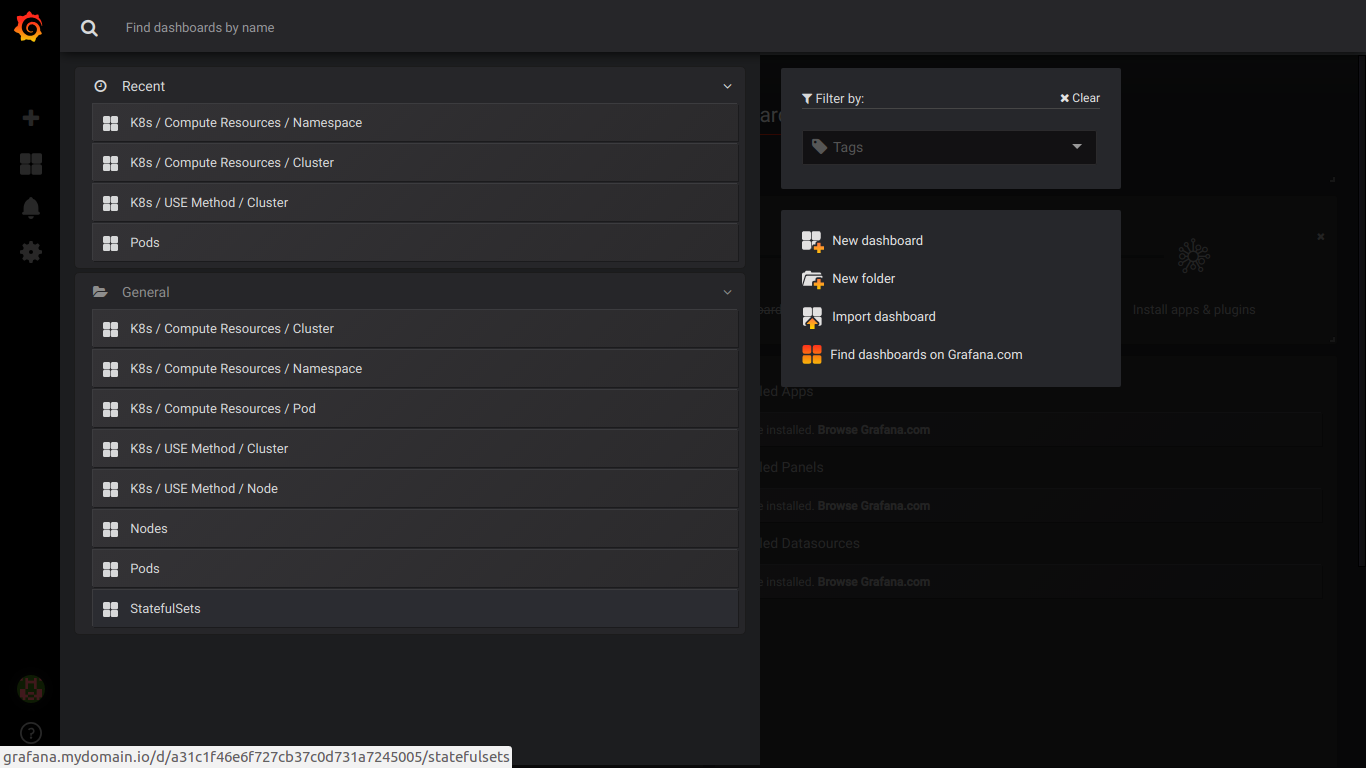
IP-- grafana.mydomain.io IP-- grafana.mydomain.io IP-- grafana.mydomain.io Go to grafana.mydomain.io. Enter standard login / password: admin / admin
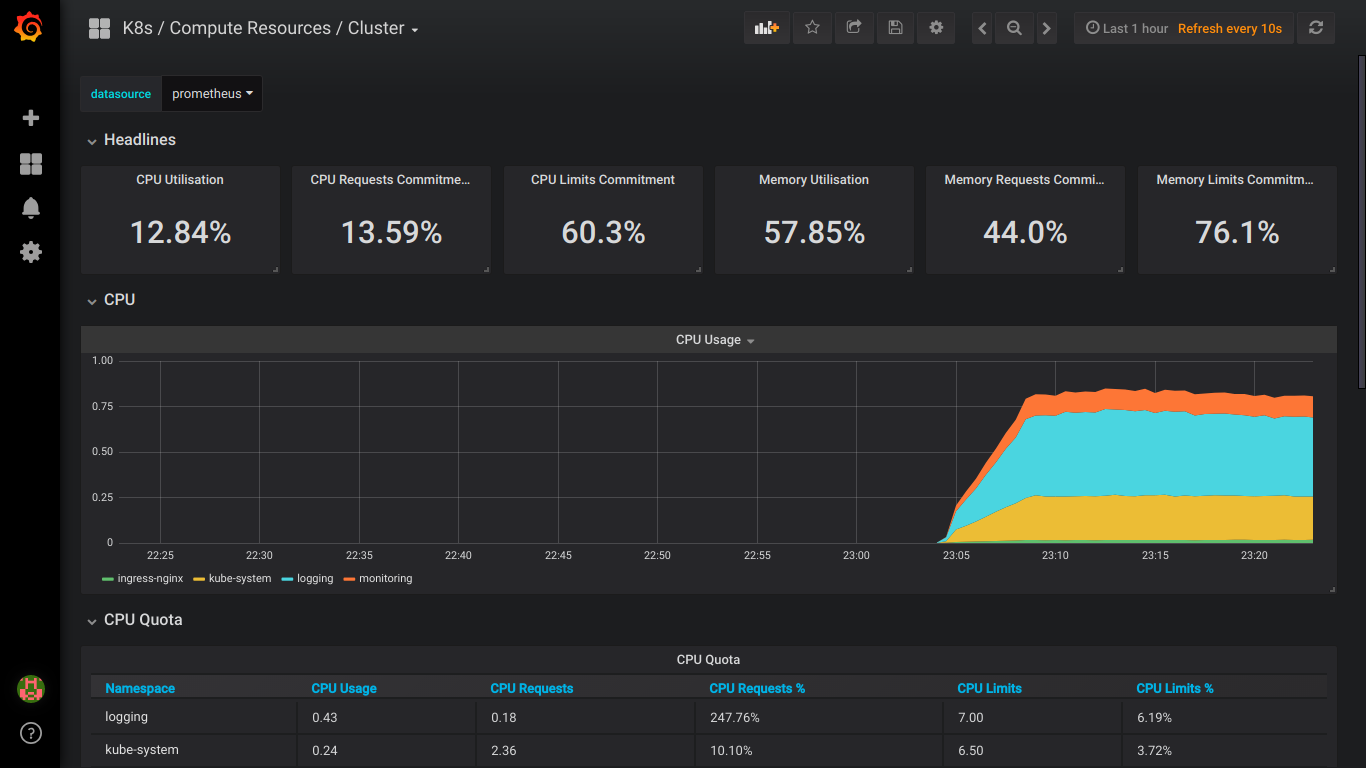
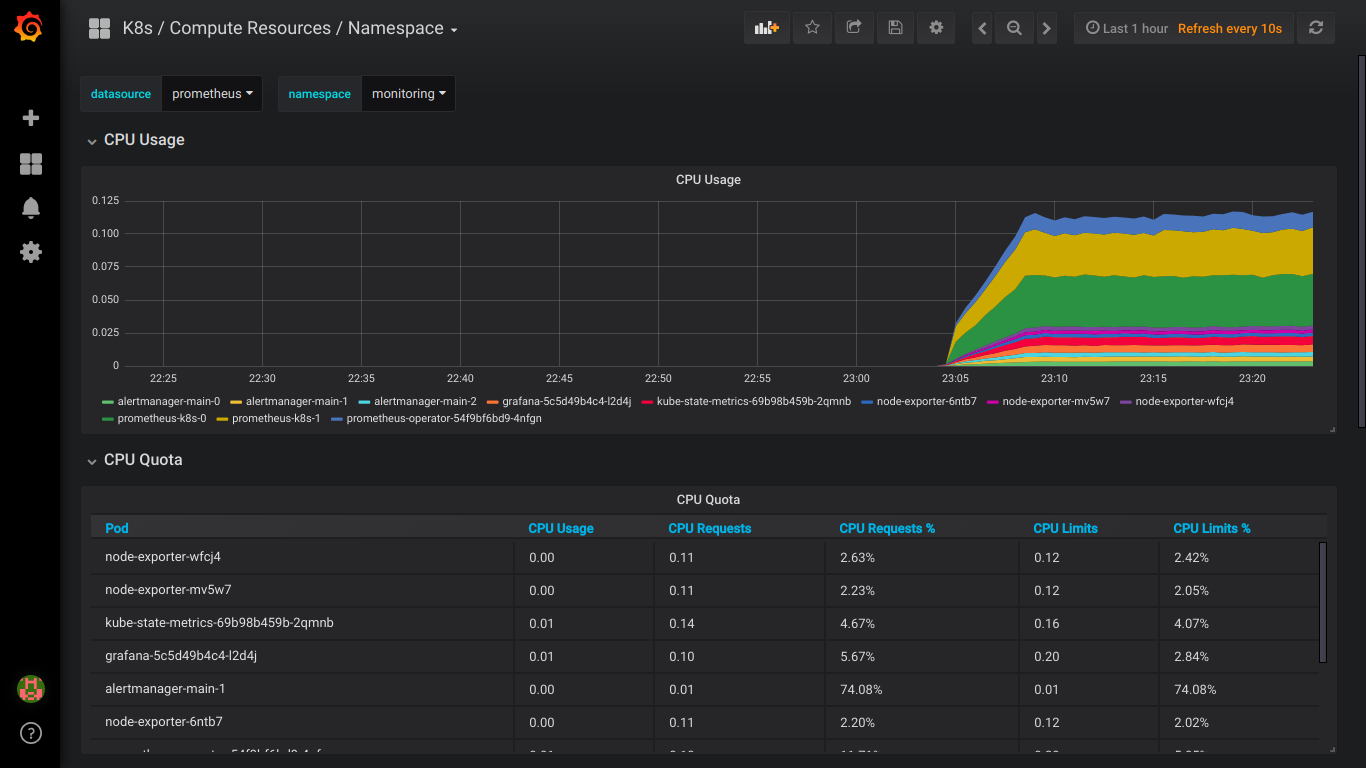
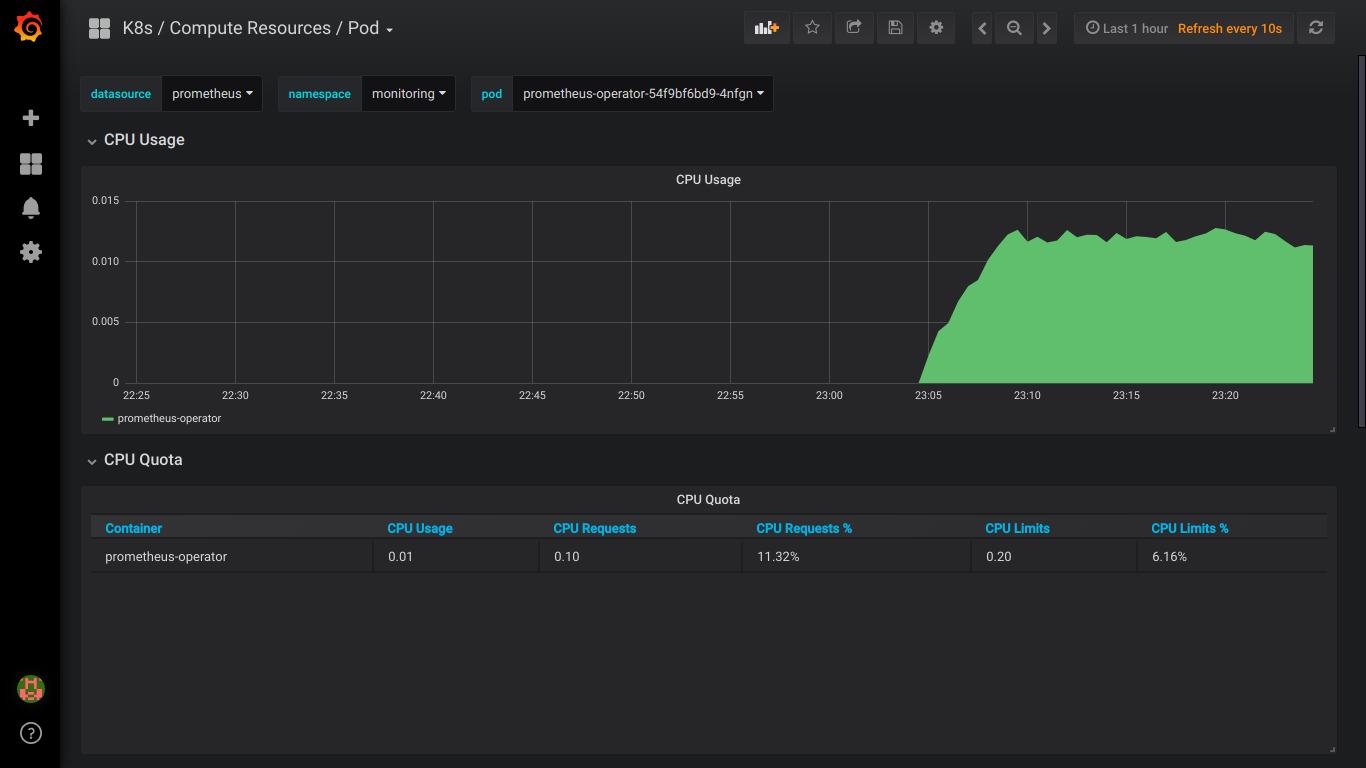
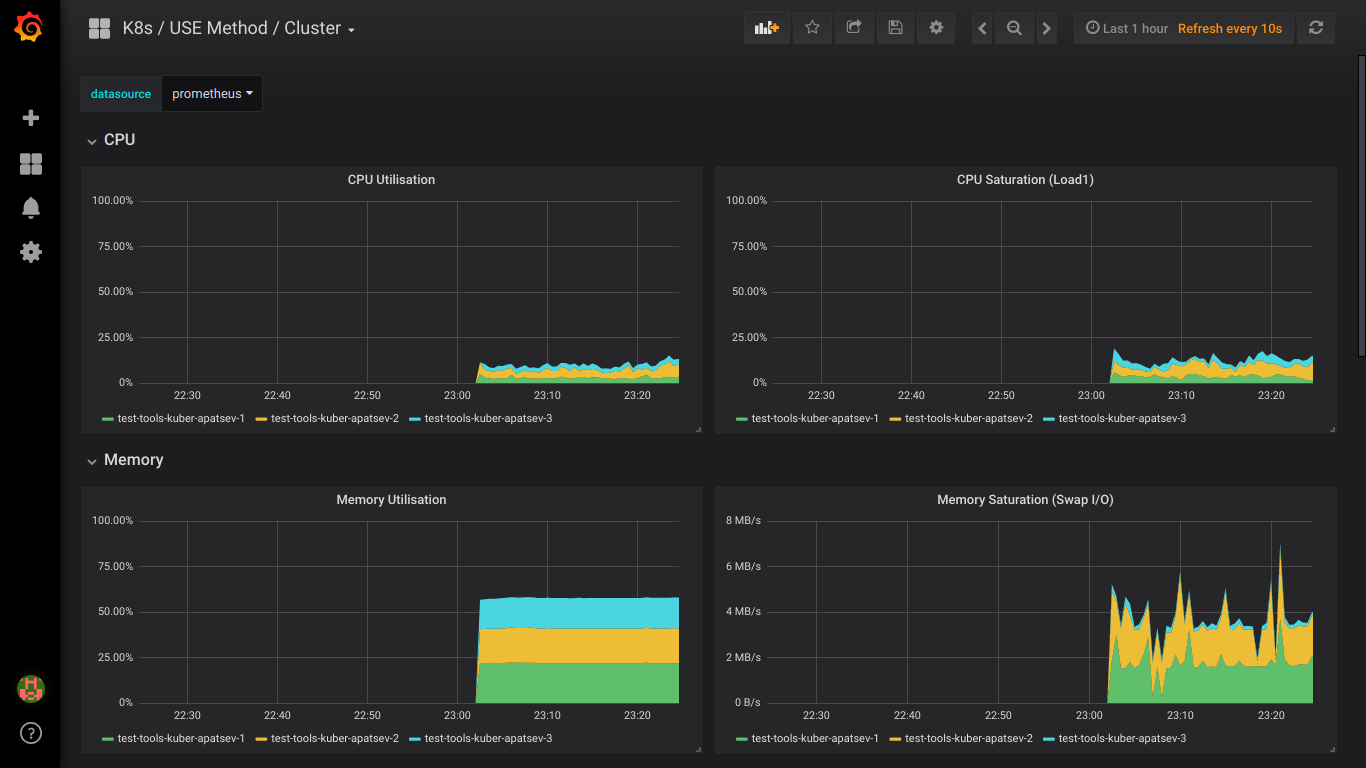
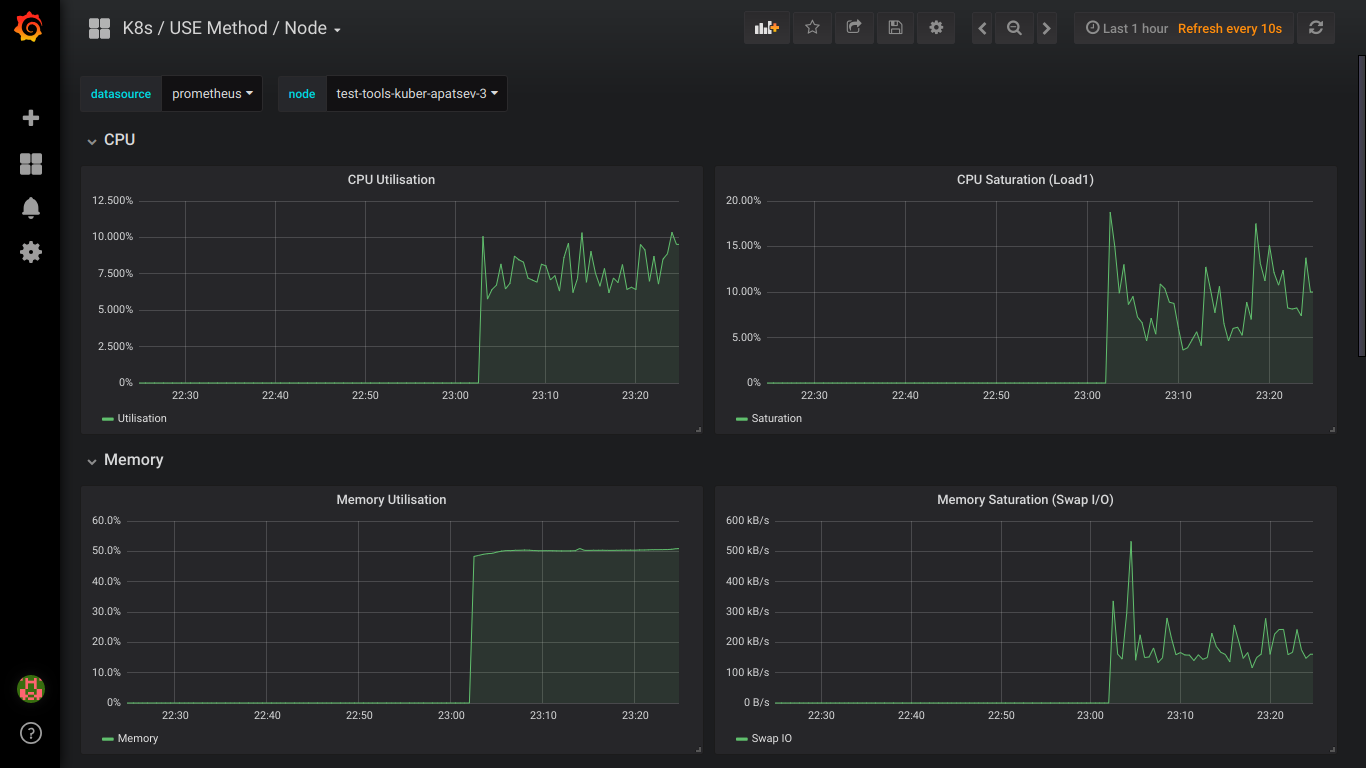
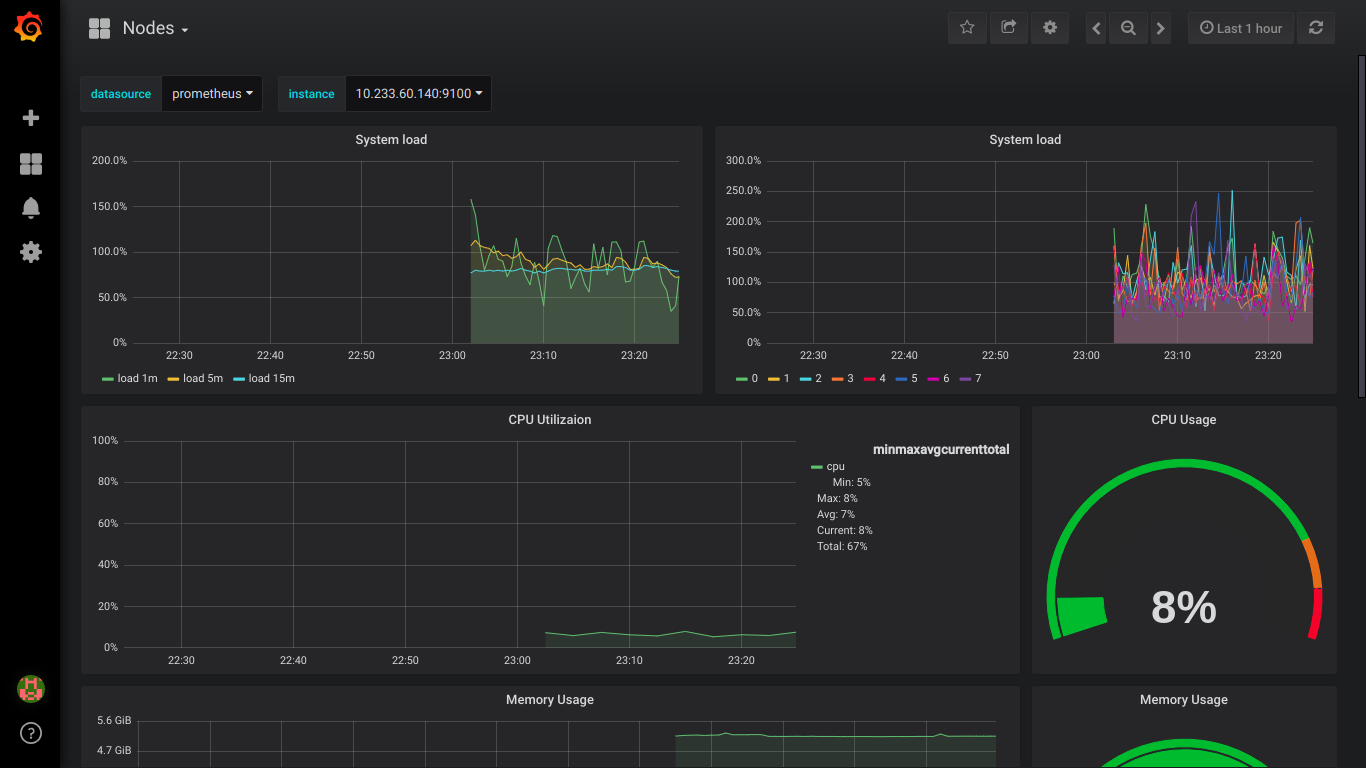
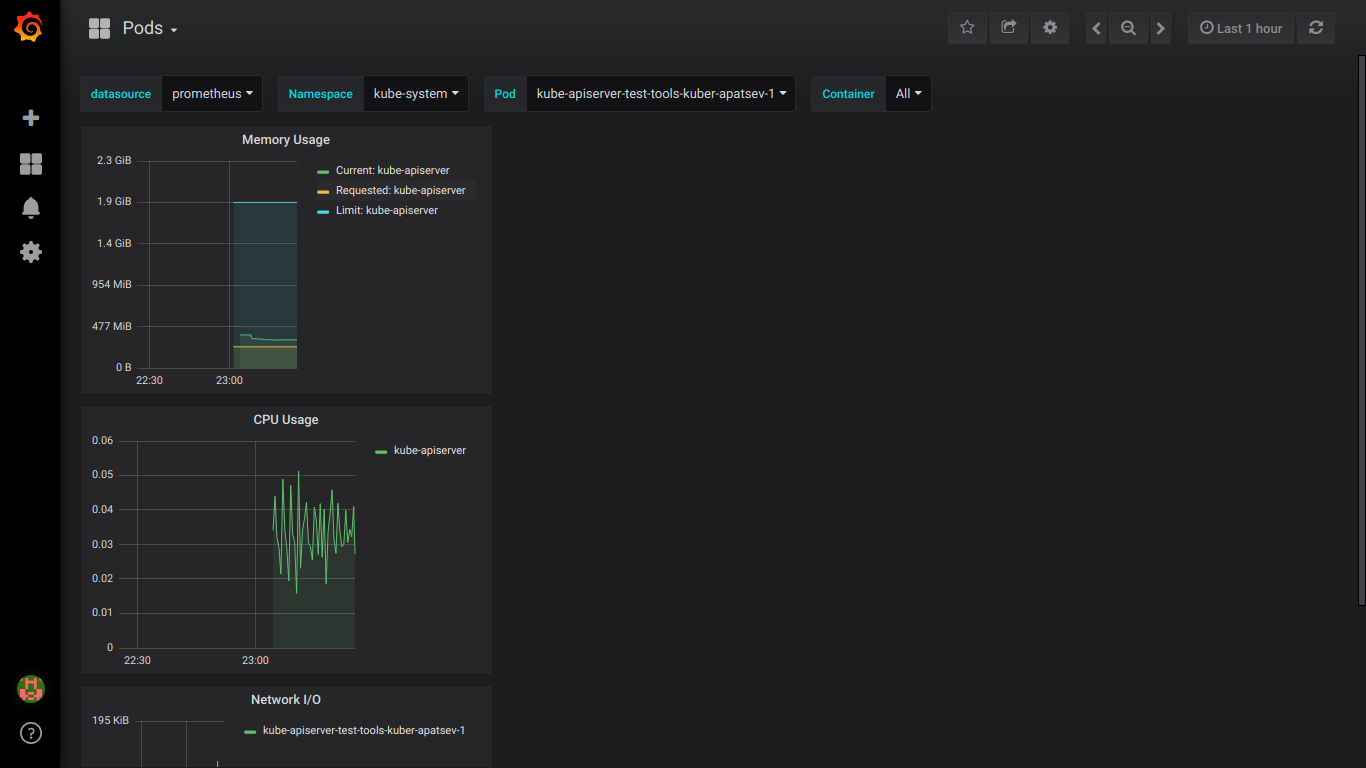
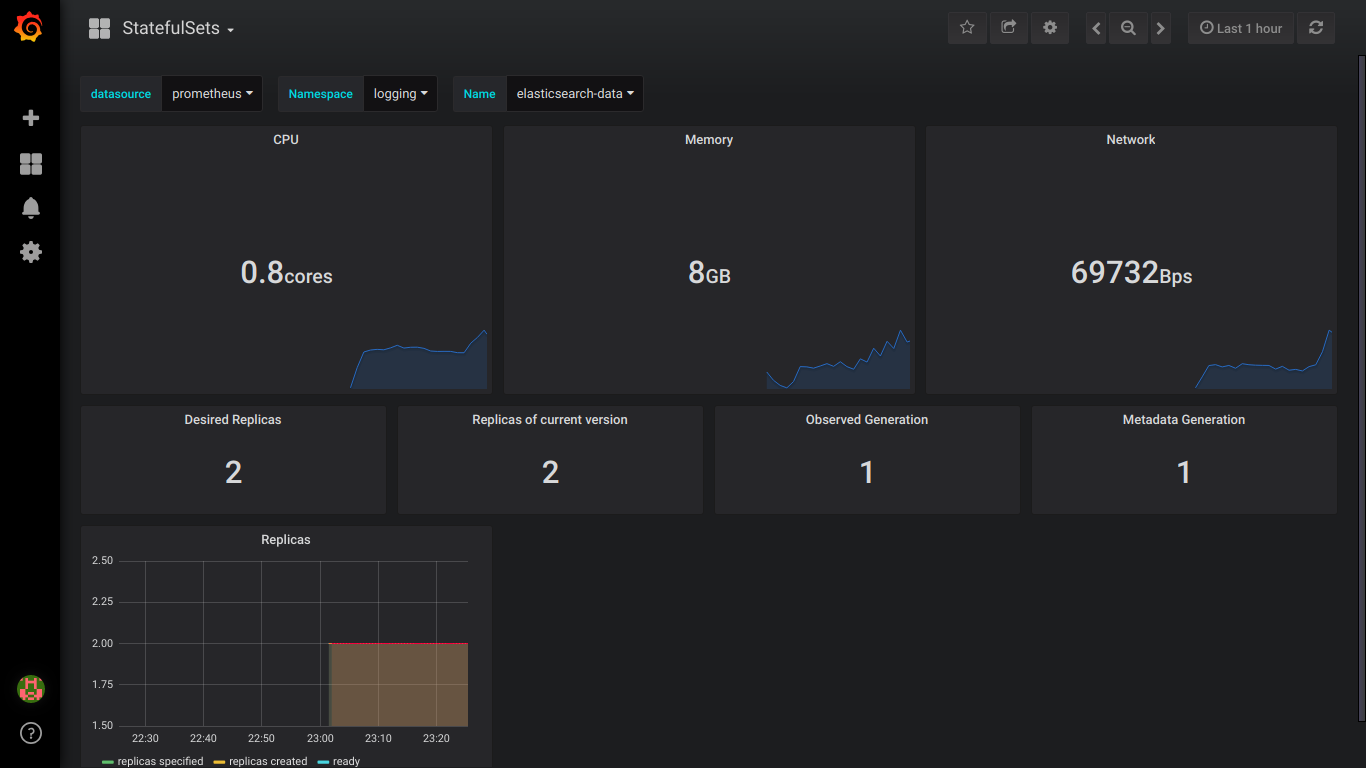
Screenshots of prometheus:
PS: It is better to write about all errors in private.
')
Source: https://habr.com/ru/post/426959/
All Articles