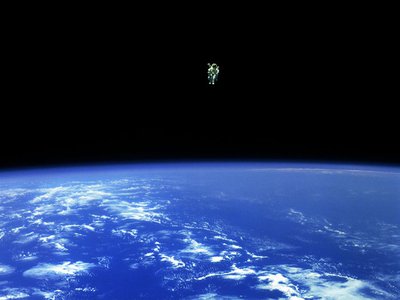
NASA Hackathon: Space Apps Challenge
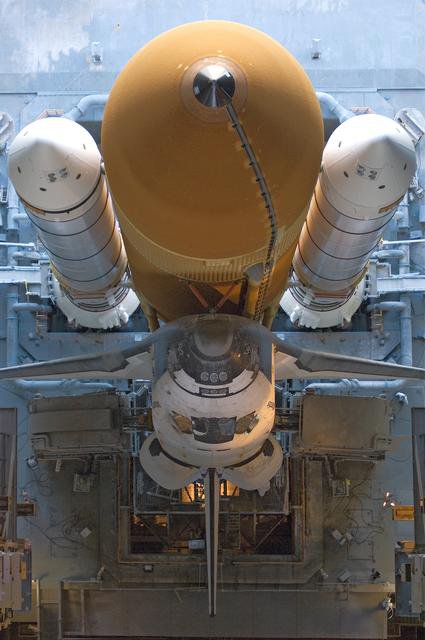
October 20-21, the hackathon of the Space Apps Challenge will be held around the world. The event takes place as part of the NASA incubation program, so everyone is serious: participants will be provided with scientific data and NASA resources, satellites, space probes and other assets.
Hackathon is held for the second time, last year it was attended by 25.000 enthusiasts from 187 countries. This year in Moscow it is organized by the largest Russian-speaking community of hackathon members Russian Hackers .
Participants will have to unite for 48 hours with developers, designers, scientists, and with everyone who wants to make the world a better place.
')
On the hackathon you can realize any space idea - make a game based on the Hubble images or come up with a research mission on the Moon, watch the rocket launches, go to the future for 100 years, create a sensor for a robot on Mars, your own work of space art: movies, music , game, visualize the cryosphere, design a time capsule, calculate the landing site of the rover.
Lectures
At the event, you can compete in creating projects and find out how space lives and what place information technologies occupy in it.
Among the lecturers are:
- Vyacheslav Dmitriev, MAI, will share the experience of the stratospheric launch of the Cubesat format apparatus.
- Georgy Potapov, Skolkovo, will talk about the use of machine learning in the processing of satellite images: what data can be extracted and how.
- Victor Rudoy, Data Acquisition & Community Manager HERE, c lecture Back to the Earth: reality index HERE.
- Alexander Shaenko, the creator of the 435nm project.
- Rodion Mamin, COO of the Spacebit project, will talk about possible applications of the blockchain in space.
- Alexey Statsenko , Jethackers.ru , will tell about the history of jetpacks , what devices are in the world now, and how the development of the first Russian turbojet vertical take-off device (VTOL) is underway.
Registration is open for the hackathon: 2018.spaceappschallenge.org/locations/moscow
You can ask questions and find the team in the hackathon member chat: t.me/nasaspaceapps_moscow
Challenge
1. Can you build a ...
Design by Nature
Design an autonomous aircraft to check the spacecraft for damage from micro-meteorites and space debris (MMOD).
Details
Space explorers. It’s not a problem. It is a cold water fallout.
For all post-Columbia missions It was the result of the space shuttle. Today, International Space Station (ISS) are used to inspect the Microscope and Orbital Debris (MMOD).
Hexagon beads from MMOD impacts. Also, the degree of autonomy. Limited linking to earth tools and tools. It makes it easier for the crew to make decisions on earth and to make decisions. Control of space crews and crew stations;
Currently there are several small satellite spacecraft projects that are investigating technologies for inspection. If you’re looking for a carriageway, you’ll be careful, .
Mother Nature's elegant solutions for this problem are unexplored! It can help you to make sure that you have no problem. Eagle looking for a prey? It could be used for a number of spacefaring entities.
Potential Considerations
What are the components of the structure?
What will your flyer use? Visual? Electromagnetic? Sensors based on sound?
In your designs, you may consider the following (this is not an exhaustive list):
- Dimensions of the damage: The MMOD entry hole is usually compared compared to the depth; angle of impact is not known
- Lighting and shadows: light sources / shadows, surface reflections, view angles, camera / sensors
- Inspection surface: Cone-shaped inspection surface geometry; distance of free-flyer from the inspection surface
- Zero-g, orbital mechanics / relative motion
- Free-flyer efficiency, and / or spacecraft efficiency (eg, propellant / power used, inspection time, etc.)
- Autonomy and minimum crew time (In-space or on-the-ground?)
Examples of resources provided:
- In-Space Inspection Workshop I
- In-Space Inspection Workshop II
- NASA Virtual Interchange for Nature-Inspired Exploration
Make sense out of mars

Create a sensor that people could use to explore Mars. You can draw ideas from NASA's robotic missions on Mars.
Details
If you are still a little bit, you can’t see it through the lenses of the landers, rovers, and orbiters. It is a matter of fact that in the person.
Or a cluster of multiple sensors. For this challenge, your options for scientific exploration are endless! What is the nature of the Mars? If you want to see your planet, you will be able to monitor it. Will your sensor uncover?
We are excited to see what you dream up and build!
Background
If you are still a little bit, you can’t see it through the lenses of the landers, rovers, and orbiters. It is a matter of fact that in the person.
Or a cluster of multiple sensors. For this challenge, your options for scientific exploration are endless! What is the nature of the Mars? If you want to see your planet, you will be able to monitor it. Will your sensor uncover?
We are excited to see what you dream up and build!
Potential Considerations
- For the first time, the sensor could always be living on the planet.
- Can you repurpose?
- Or, can you improve technologies from NASA's robotic Mars missions to be operated by humans? What would you take advantage of a human (versus robot) operator? How would you address any drawbacks?
Examples of resources:
Do you know when the next rocket launch is?
Create an application with a schedule of launches of spacecraft and information about them. We advise to focus on UI / UX.
Details
The spaceflight has been privatized by spaceflight, another space-bound rocket seems to launch every week. It is a world war in the past few years. Private companies are now doing launches as well.
This is a list of the latest rocket launch information.
Background
The spaceflight has been privatized by spaceflight, another space-bound rocket seems to launch every week. It is a world war in the past few years. Private companies are now doing launches as well.
This is a list of the latest rocket launch information.
Potential Considerations
- What factors go into a decision to launch?
- What are the most common causes of scheduling changes in launches?
- Where are the world's major spaceports?
- Where are each rocket launch?
- Which company or government does the rocket belong to? What about the payload?
- Can the launch be seen live online? If so, what's the URL?
- Include as much useful information as you can!
Examples of resources:
Choose your own

Work on your own project, if it does not fit into any other challenge categories using NASA data. Absolute creative flight for teams, but you can not qualify for the main prize.
Details
Do you have any ideas? Create data, visualization, hack on an arduino ... or something you can think of using nasa data!
You can find something that inspires you.
Develop your own challenge, and then create your own solution.
Background
Do you have any ideas? Create data, visualization, hack on an arduino ... or something you can think of using nasa data!
You can find something that inspires you.
Develop your own challenge, and then create your own solution.
Potential Considerations
- You can passionate about
- All of NASA's data are available for you to use.
- For your Global Award, you will not be eligible for a Global Award.
Examples of resources:
- NASA Home Page
- NASA Earth Data
- NASA Image Galleries
- NASA Image and Video Library
- NASA Image and Video Library
- NASA Scientific Visualization Studio
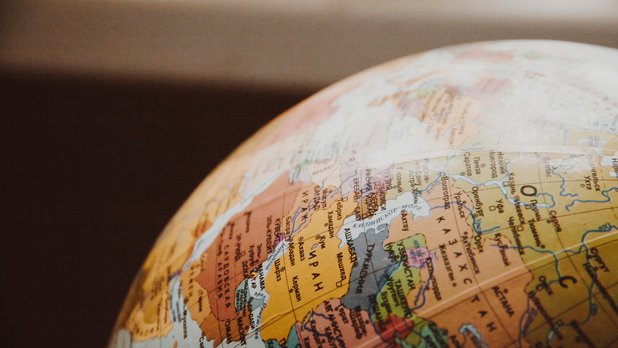
2. Help others discover the Earth
Artify the earth

Create a work of art using NASA satellite images or write a service / application for this.
Details & Examples of Resources
NASA has collected images of Earth for five decades. In addition to helping us understand the biosphere, the hydrosphere, the cryosphere, the lithosphere, the atmosphere, the atmosphere of our home planet. For these challenges, be inspired,
Your choice of, and develop your own interpretation of NASA's observations. Or, build a tool or image for spectral band data into novel creations. What you create can inform, educate, or inspire.
If you are creating data with band data, consider the following:
See NASA Global Imagery Browse Services (GIBS) earthdata.nasa.gov/gibs for access to over 400 satellite products.
NASA Worldview worldview.earthdata.nasa.gov is an easy way to visualize GIBS data in your browser.
NASA Earth Science Data Systems Program, science.nasa.gov/earth-science/earth-science-data , Earth science data.
NASA Earthdata Search Search.earthdata.nasa.gov allows you to search, discover, visualize, refine, and access NASA Earth Observation data.
The NASA Scientific Visualization Studio svs.gsfc.nasa.gov wants to learn about NASA programs through visualization. It is a work of science that is supported by NASA.
Shuttle Radar Topography Mission: www2.jpl.nasa.gov/srtm
Background
NASA has collected images of Earth for five decades. In addition to helping us understand the biosphere, the hydrosphere, the cryosphere, the lithosphere, the atmosphere, the atmosphere of our home planet. For these challenges, be inspired,
Your choice of, and develop your own interpretation of NASA's observations. Or, build a tool or image for spectral band data into novel creations. What you create can inform, educate, or inspire.
Potential Considerations
If you are creating data with band data, consider the following:
- Optical images can be gathered from NASA's missions. Red, Blue, and Green (RBG) color transformations
- There is an incredible number of phone applications used to manipulate imagery for artistic purposes. There are colors for the painters, illustrators, and artists. It is possible to create unique pieces of art
- You might consider how you’re used for educational purposes. For example, if you want to use the RBG image, or the area being displayed )
- The data from the NASA can be run on
- Consider, for example, the elevation layers (eg, see the Shuttle Radar Topography Mission resource provided below), or
Examples of Resources
See NASA Global Imagery Browse Services (GIBS) earthdata.nasa.gov/gibs for access to over 400 satellite products.
NASA Worldview worldview.earthdata.nasa.gov is an easy way to visualize GIBS data in your browser.
NASA Earth Science Data Systems Program, science.nasa.gov/earth-science/earth-science-data , Earth science data.
NASA Earthdata Search Search.earthdata.nasa.gov allows you to search, discover, visualize, refine, and access NASA Earth Observation data.
The NASA Scientific Visualization Studio svs.gsfc.nasa.gov wants to learn about NASA programs through visualization. It is a work of science that is supported by NASA.
Shuttle Radar Topography Mission: www2.jpl.nasa.gov/srtm
1D, 2D, 3D, Go!
Develop and deploy a web application that will allow you to explore the Earth right from your browser. NASA offers to visualize data on satellites, missions, fires, meteorites, clouds, weather.
Details & Examples of Resources
The web apps are satellites that orbit the Earth. Think of data files as one-dimensional (1D). This is the number of two-dimensional (2D) and three-dimensional (3D) 3D maps.
Programming beginners are invited to create 2D web-based imagery using web-based scripting and block-based programming environments. Intermediate and advanced programmers are invited to integrate data sources.
Ideas for potential web apps include but are not limited to:
Mission analysis applications can generate 2D or 3D coordinates in Comma Separated Value (CSV) format. Transform the CSV data into a junction or GeoJSON for presentation on a virtual globe. Earth science 2D images could be imported to web-based programming environments such as Scratch. Several NASA data sets are in formats that could be imported into virtual globes. Integrating a virtual globe with Scratch via JavaScript could help students to use virtual globes. Teachers and students!
Shows descriptions, tutorials, virtual globes, code libraries, and mission analysis applications.
Many projects and previous Space Apps Challenge products are available on an open source code repository. A few code repositories offer free web page hosting; The project is within the same repository. Then you will be able to follow your project page.
3D apps should be free for reuse. It is also recommended that it be embedded in a web page. They are interested in designing their own space missions.
NASA's Web-based Visualization Tutorial series. (Link coming soon.)
The Inner Solar System is a JavaScript web app that includes an orbital propagator. (Link coming soon.)
It is a tutorial that explains how to implement a relatively simple orbital propagator that enables the animation of visualizations. (Link coming soon.)
3D Earth Globe: 3D Models
Data Programming Interfaces:
NASA Developer Resources
NASA APIs
NASA Open Data
NASA Open Earth Exchange (OpenNEX)
NASA data sets suitable for importing into virtual globes:
Keyhole Markup Language (KML) data sets
GeoJSON data sets
NASA Web Worldwind:
Tutorials
Application Programming Interface documentation
Space Mission Planning Applications
Mission planning can be visualized via 3D code.
NASA's General Mission Analysis Tool (GMAT)
Suggested keywords for online resource searches:
Background
The web apps are satellites that orbit the Earth. Think of data files as one-dimensional (1D). This is the number of two-dimensional (2D) and three-dimensional (3D) 3D maps.
Programming beginners are invited to create 2D web-based imagery using web-based scripting and block-based programming environments. Intermediate and advanced programmers are invited to integrate data sources.
Ideas for potential web apps include but are not limited to:
- Conversion utilities
- Trajectory visualization of orbiting satellites
- Mobile phone apps of Earth science data imagery
- Globes
- Integrating virtual globes with web-based programming environments
Mission analysis applications can generate 2D or 3D coordinates in Comma Separated Value (CSV) format. Transform the CSV data into a junction or GeoJSON for presentation on a virtual globe. Earth science 2D images could be imported to web-based programming environments such as Scratch. Several NASA data sets are in formats that could be imported into virtual globes. Integrating a virtual globe with Scratch via JavaScript could help students to use virtual globes. Teachers and students!
Potential Considerations
- Free virtual globes provide functions to import Earth science data
- Free software and images and 3D data visualizations
- Free mission analysis tools enable the generation of trajectory coordinates.
- This is a world wide web platform.
Shows descriptions, tutorials, virtual globes, code libraries, and mission analysis applications.
Many projects and previous Space Apps Challenge products are available on an open source code repository. A few code repositories offer free web page hosting; The project is within the same repository. Then you will be able to follow your project page.
3D apps should be free for reuse. It is also recommended that it be embedded in a web page. They are interested in designing their own space missions.
Examples of Resources
NASA's Web-based Visualization Tutorial series. (Link coming soon.)
The Inner Solar System is a JavaScript web app that includes an orbital propagator. (Link coming soon.)
It is a tutorial that explains how to implement a relatively simple orbital propagator that enables the animation of visualizations. (Link coming soon.)
3D Earth Globe: 3D Models
Data Programming Interfaces:
NASA Developer Resources
NASA APIs
NASA Open Data
NASA Open Earth Exchange (OpenNEX)
NASA data sets suitable for importing into virtual globes:
Keyhole Markup Language (KML) data sets
GeoJSON data sets
NASA Web Worldwind:
Tutorials
Application Programming Interface documentation
Space Mission Planning Applications
Mission planning can be visualized via 3D code.
NASA's General Mission Analysis Tool (GMAT)
Suggested keywords for online resource searches:
- Orbital propagator and javascript
- 3D graphics code libraries
- Keplerian parameters
- Two Line Element sets or TLE resources
- Current NORAD Two Line Element sets
Space Apps: The Documentary

Remove a five-minute documentary on the international hackathon Space Apps.
In the film, you need to capture the atmosphere of the hackathon, tell about the decisions and the stories behind them, about the teams or about any other aspects of interest to you.
Details
Since thousands of participants have been developed for the NASA challenges. Participants like you come together for a weekend of excitement, storytelling, and fantastic multi-disciplinary science and engineering. We want to hear your sensational stories !!! If you’re getting ready to travel, you’ll be learning how to travel.
This is a five-minute (or less) documentary of the International Space Apps Challenge.
For this challenge, you may choose to cover:
Document the experience in a creative film. Make sure that you can upload or embed your content page into your project page (list, storyboards, etc.).
It would be a bit losing time for your team, including the writing, directing, acting, interviewing, guest speakers, , serving as artist, or production assistant etc.
Consider what equipment your team would need, such as audio / video recorders, microphones, and lighting. It can be used to increase production quality. If your team doesn’t have to provide it.
It is often considered the most important component of a video. For audio and audio.
Consult resources available for short film. For example, it’s possible to use it. script.
If you’ve chosen to be a global Award finalist, you can’t have a 30-second video entry.
Background
Since thousands of participants have been developed for the NASA challenges. Participants like you come together for a weekend of excitement, storytelling, and fantastic multi-disciplinary science and engineering. We want to hear your sensational stories !!! If you’re getting ready to travel, you’ll be learning how to travel.
This is a five-minute (or less) documentary of the International Space Apps Challenge.
For this challenge, you may choose to cover:
- You have learned about space apps
- Your local event where you follow one team or all teams
- Solutions and the stories behind them
- The heroes behind the scenes
- Inspired by you
- Any aspect of the hackathon that you find interesting
Document the experience in a creative film. Make sure that you can upload or embed your content page into your project page (list, storyboards, etc.).
Potential Considerations
It would be a bit losing time for your team, including the writing, directing, acting, interviewing, guest speakers, , serving as artist, or production assistant etc.
Consider what equipment your team would need, such as audio / video recorders, microphones, and lighting. It can be used to increase production quality. If your team doesn’t have to provide it.
It is often considered the most important component of a video. For audio and audio.
Consult resources available for short film. For example, it’s possible to use it. script.
If you’ve chosen to be a global Award finalist, you can’t have a 30-second video entry.
Examples of resources:
- Space Apps Sites (archives summary)
- Existing NASA multimedia (“Galleries”)
- Existing NASA multimedia (“Galleries”)
3. Volcanoes, icebergs, asteroids (oh my)
Don't forget the can opener

Create an easy way to organize emergency plans and information. The tool should work without the Internet and explain how to act in case of different types of disasters and how to prepare for them.
Details
When Earth surprises you, make sure you have an emergency preparedness kit. In fact, have a kit.
There are some ways to meet your needs and conditions. For example: plywood for boarding windows before typhoons; face masks for dust, ash, or smog; a go-bag for bugging out; or your pets.
What are the main threats for each? For example, it’s not a problem; when it comes to volcano erupts, it’s not the lava
Different surprises need different strategies. If you are going to need to go for each person, you must go for each person. Help me figure it out. Illustrate and understand what they are preparing for. Whatever you design, it can be used when the internet goes down. It can be a little bit different.
Background
When Earth surprises you, make sure you have an emergency preparedness kit. In fact, have a kit.
There are some ways to meet your needs and conditions. For example: plywood for boarding windows before typhoons; face masks for dust, ash, or smog; a go-bag for bugging out; or your pets.
What are the main threats for each? For example, it’s not a problem; when it comes to volcano erupts, it’s not the lava
Potential Considerations
Different surprises need different strategies. If you are going to need to go for each person, you must go for each person. Help me figure it out. Illustrate and understand what they are preparing for. Whatever you design, it can be used when the internet goes down. It can be a little bit different.
Examples of resources:
- images.nasa.gov
- svs.gsfc.nasa.gov
- appliedsciences.nasa.gov/programs/disasters-program
- www.nasa.gov/mission_pages/neowise/main/index.html
- www.earthdata..nasa.gov
Spot that fire!
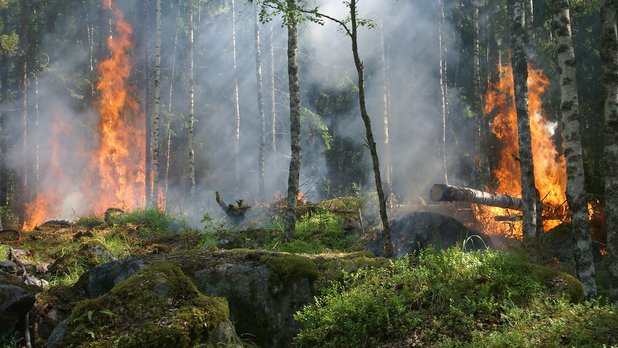
Apply crowdsourcing so that people can contribute to the detection, confirmation and tracking of forest fires. The solution can be a mobile or web application.
Details
Over the past year, we have witnessed long and arduous battles against record-breaking wildfires across the world. Some of these fires have been burned down. The number of miles away.
This is an early and effective detection. It takes 3–4 hours for ten minutes or less. Crowdsourcing can support real-time disasters, including wildfires. It’s a challenge.
They are invited to participate in the early detection, verification, tracking, visualization, and / or notification. If you are not limited to these!
In the case of your ideas, your solution may be:
How does your app encourage a citizen remote sensing initiative on wildfires?
Background
Over the past year, we have witnessed long and arduous battles against record-breaking wildfires across the world. Some of these fires have been burned down. The number of miles away.
This is an early and effective detection. It takes 3–4 hours for ten minutes or less. Crowdsourcing can support real-time disasters, including wildfires. It’s a challenge.
Potential Considerations
They are invited to participate in the early detection, verification, tracking, visualization, and / or notification. If you are not limited to these!
- Report a fire: eg, upload textual and multimedia (such as picture or video with geolocation) materials, etc.
- Verify and screen fire reports: eg, check with NASA fire database, cross-checking, verify whether a machine is through a firewall, etc.
- Where do you live?
- Track and visualize fires: eg, show fire maps, tracks, embed animation, display detailed fire data, etc.
- Build mashups: ie, integrate your application APIs
In the case of your ideas, your solution may be:
- Design of the goal
- This is what it provides
- Leverage NASA state-of-the-art technology, including:
- Open-source tools used in the development
How does your app encourage a citizen remote sensing initiative on wildfires?
Examples of resources:
- OpenNEX AppStore
- NASA Fire Information Resource Management System (FIRMS)
- Incident Information System (INCIWEB database)
- Integrated Reporting of Wildland Fire Information (IRWIN) database
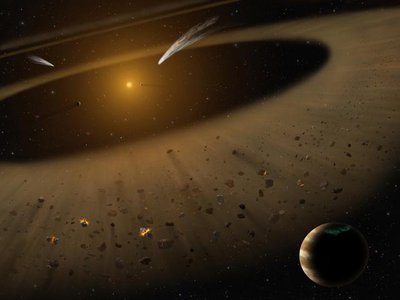
Hello bennu
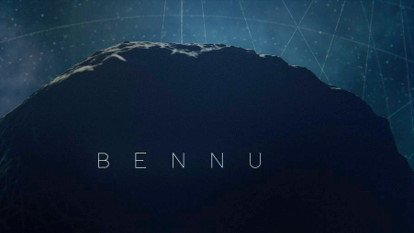
Make a video about the asteroid Bennu. On this asteroid can be molecular precursors of the organic life of our planet. And this asteroid may fall to the Earth at the end of the 22nd century.
Details
Where did we come from?
What is our destiny?
Asteroids, the sun system and the nearby planets.
The OSIRIS-REx spacecraft is traveling to Bennu. Bennu may contain the precursors of the oceans.
It is a relatively high risk for the impact of the earth in the 22nd century. It will be possible to determine the OSRIS-REX.
Finally, asteroids like Bennu contain natural resources such as water, organics, and precious metals. In the future, these asteroids may be subject to robotic and manned spacecraft.
What do you think about Bennu!
Bennu. What part of NASA's OSIRIS-REx mission is the most exciting to you? What do you think about Bennu? Whatever you think about Bennu, tell the world about it !!!
You can share a poem or a song, a dance or a presentation — you can even watch a video from Bennu's perspective!
Background
Where did we come from?
What is our destiny?
Asteroids, the sun system and the nearby planets.
The OSIRIS-REx spacecraft is traveling to Bennu. Bennu may contain the precursors of the oceans.
It is a relatively high risk for the impact of the earth in the 22nd century. It will be possible to determine the OSRIS-REX.
Finally, asteroids like Bennu contain natural resources such as water, organics, and precious metals. In the future, these asteroids may be subject to robotic and manned spacecraft.
What do you think about Bennu!
Potential Considerations
Bennu. What part of NASA's OSIRIS-REx mission is the most exciting to you? What do you think about Bennu? Whatever you think about Bennu, tell the world about it !!!
You can share a poem or a song, a dance or a presentation — you can even watch a video from Bennu's perspective!
Examples of resources:
- NASA OSIRIS-REx Mission
- NASA Image Galleries
- NASA Image and Video Library
- NASA Scientific Visualization Studio
- NASA YouTube Channel
- NASA DEVELOP YouTube Chan
4. What the world need now is

Looking globe-ally
Use data from the GLOBE project to help people better know our planet through data analysis and visualization. The data are datasets from photos and their descriptions, tied to geo coordinates.
Detais & Examples of Resources
With the GLOBE Observer app, NASA collectors data from the citizen and mosquito habitats, and land cover. This is a map of the world.
For example, it’s possible to follow it’s
As one example, you can’t find out where you can get it. It is possible to reduce the number of mosquito-borne illnesses such as Zaria virus and fever.
Our home planet? It could not include any kind of games, but it couldn’t even be creative!
GLOBE Data Sources
Satellite Data Sources:
Background
With the GLOBE Observer app, NASA collectors data from the citizen and mosquito habitats, and land cover. This is a map of the world.
For example, it’s possible to follow it’s
As one example, you can’t find out where you can get it. It is possible to reduce the number of mosquito-borne illnesses such as Zaria virus and fever.
Our home planet? It could not include any kind of games, but it couldn’t even be creative!
Potential Considerations
- The data collected from citizen scientists consists of photographs as a rule, for example, for example, the type of clouds, land cover, trees, landscapes, etc. Each observation has a latitude / longitude location. Can be displayed in different ways
- The GLOBE Visualization System and the GLOBE Observer app. The Mosquito Habitat Mapper under Hydrosphere, and the Land Cover under Biosphere. If you wish.
- There is a link to the satellite matching page, which indicates if the match was made. If you’re watching for satellite data
- Clouds: Cloud Fraction (Aqua / MODIS, Terra / MODIS)
- Mosquito Habitat Mapper: Precipitation (GPM / IMERG), Soil Moisture (SMAP), Vegetation (Landsat, Terra / MODIS), Surface Temperature (Aqua / AIRS)
- Land Cover: Vegetation (Landsat, Terra / MODIS),
- Feel free to think creatively! An example of an application based on it from space. A remote control sensing image. Can players pick the correct image associated with that location? This information would be frequently misidentified. This concept could not be used.
Examples of Resources
GLOBE Data Sources
- GLOBE Observer App: observer.globe.gov , and downloadable from the App Store and Google Play. It would be helpful.
- GLOBE Visualization System: vis.globe.gov . Displays GLOBE data for individual data points. The subset of a layer. For each of these data points, it’s not a problem.
- GLOBE Advanced Data Access Tool: datasearch.globe.gov . This tool allows you to find and retrieve data using several different search parameters. This is a summary of the data available. CSV file for detailed analysis. A summary of the CSV file is also available.
- Tutorials for retrieving and visualizing your data: www.globe.gov/get-trained/using-the-globe-website/retrieve-and-visualize-your-data .
Satellite Data Sources:
- Global Imagery Browse Services (GIBS): earthdata.nasa.gov/gibs , provides access to over 400 satellite products.
- NASA Worldview: worldview.earthdata.nasa.gov , an easy way to visualize GIBS data in your browser.
- NASA Earth Science Data Systems Program: science.nasa.gov/earth-science/earth-science-data , Earth science data.
- NASA Earthdata Search: search.earthdata.nasa.gov , allows you to search, discover, visualize, refine, and access NASA Earth Observation data.
The land where displaced people settle
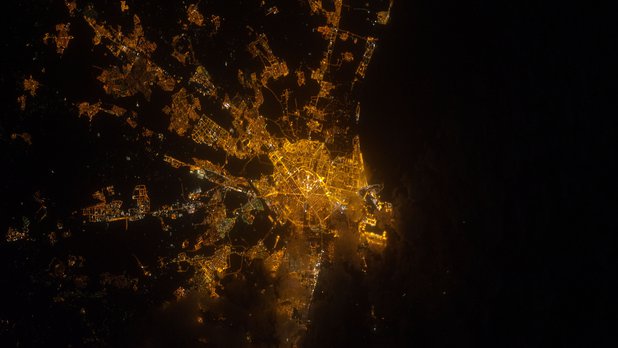
Participants will determine the area and features of informal settlements of refugees using satellite imagery. For example, you can evaluate changes in vegetation or the amount of light at night. The solution must be scalable and take into account the peculiarities of local geography.
Details
The number of people displaced has grown to 68.5 million people worldwide. Approximately 40 million of these people are Internally Displaced People (IDP), since they remain inside their country borders. This is a quotation of the asylum.
Many of the IDPs and refugees were settling in unplanned, usually rural settlements. It is not a rule. This is a little bit more information about environmental issues, land-based opportunities (eg, local access to water, firewood, and food), and environmental challenges.
Remote sensing imagery collected by NASA satellites and instruments, such as Landsat, MODIS, GRACE, VIIRS, and others, capture an abundance of data related to environmental and climatic conditions, infrastructural change, and nighttime lighting conditions, as well as the multi-year and potentially multi-decadal changes therein. These data can thus give unique insights, and can help to improve global awareness of living conditions at informal settlements, which are home to ever-increasing populations of displaced people around the world.
Your challenge is to design an approach that uses NASA Earth observations data to characterize land cover/land use conditions at informal settlements.
Your approach should be:
Your approach could include many kinds of assessments, such as (but not limited to):
These are merely suggestions. You are not required to take on all, or any, of the above, but rather you are encouraged to have a targeted question and application, even if some uncertainty or limitations remain.
Your approach may not be consistently effective across a variety of landscapes populated by informal settlements. That is okay! Consider applying your approach at a range of different sites and identifying where and why your approach works or does not work.
Background
The number of people displaced has grown to 68.5 million people worldwide. Approximately 40 million of these people are Internally Displaced People (IDP), since they remain inside their country borders. This is a quotation of the asylum.
Many of the IDPs and refugees were settling in unplanned, usually rural settlements. It is not a rule. This is a little bit more information about environmental issues, land-based opportunities (eg, local access to water, firewood, and food), and environmental challenges.
Remote sensing imagery collected by NASA satellites and instruments, such as Landsat, MODIS, GRACE, VIIRS, and others, capture an abundance of data related to environmental and climatic conditions, infrastructural change, and nighttime lighting conditions, as well as the multi-year and potentially multi-decadal changes therein. These data can thus give unique insights, and can help to improve global awareness of living conditions at informal settlements, which are home to ever-increasing populations of displaced people around the world.
Your challenge is to design an approach that uses NASA Earth observations data to characterize land cover/land use conditions at informal settlements.
Your approach should be:
- Scalable (ie, appropriate for application to several settlements),
- Sensitive to the local geography and climate, and
- Easily understandable for the residents, humanitarians, policy makers, scientists, and others who are committed to the welfare of vulnerable populations
Potential Considerations
Your approach could include many kinds of assessments, such as (but not limited to):
- Tracking changes in agricultural or garden greenspace within or surrounding informal settlements;
- Tracking changes in nighttime lights emissions;
- Estimating fuel-wood consumption around the settlement;
- Measuring changes in groundwater; and/or
- Tracking changes in local land cover to identify the specific date when the settlement was established.
These are merely suggestions. You are not required to take on all, or any, of the above, but rather you are encouraged to have a targeted question and application, even if some uncertainty or limitations remain.
Your approach may not be consistently effective across a variety of landscapes populated by informal settlements. That is okay! Consider applying your approach at a range of different sites and identifying where and why your approach works or does not work.
Examples of resources:
- Landsat Analysis Ready Data
- MODIS vegetation indices I
- MODIS vegetation indices II
- VIIRS / NPP Day / Night Band
Health makes wealth
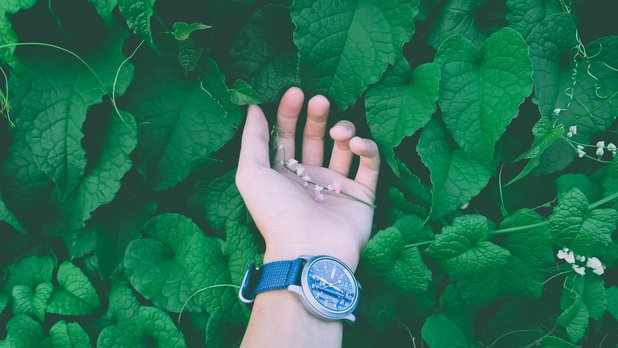
Use NASA Earth data and medical open sources to establish how the environment affects human and animal health.
Details & Examples of Resources
Our surrounding ecosystems are constantly adapting to a range of environmental conditions, such as seasonal variation, extreme weather patterns, and unexpected natural hazards. These changes, however, may not be easily observed or appreciated in real-time accounts by the human eye. How have your daily activities been affected by a changing environment? How have you observed these changes?
As humans and animals share disease risks within their atmospheric, terrestrial, and aquatic environments, we should survey the planet's biodiversity through a holistic approach. Using this One Health concept, we can describe the biodiversity through real-time measurements in a two-fold manner. First, Earth science data can provide global measurements of diverse environmental conditions, such as land cover and precipitation levels. Second, citizen science observations by community members are local measurements, like photographs (eg photovoice methodology), field notes, and physical measurements. Combining large-scale satellite data with small-scale community observations can serve as a valuable visualization tool for our dynamic ecosystems.
Your challenge is to match NASA Earth science data with potential sources of local citizen science observations to identify how our changing environment may influence human and animal health!
As you brainstorm on the elements of this challenge, consider the following:
Background
Our surrounding ecosystems are constantly adapting to a range of environmental conditions, such as seasonal variation, extreme weather patterns, and unexpected natural hazards. These changes, however, may not be easily observed or appreciated in real-time accounts by the human eye. How have your daily activities been affected by a changing environment? How have you observed these changes?
As humans and animals share disease risks within their atmospheric, terrestrial, and aquatic environments, we should survey the planet's biodiversity through a holistic approach. Using this One Health concept, we can describe the biodiversity through real-time measurements in a two-fold manner. First, Earth science data can provide global measurements of diverse environmental conditions, such as land cover and precipitation levels. Second, citizen science observations by community members are local measurements, like photographs (eg photovoice methodology), field notes, and physical measurements. Combining large-scale satellite data with small-scale community observations can serve as a valuable visualization tool for our dynamic ecosystems.
Your challenge is to match NASA Earth science data with potential sources of local citizen science observations to identify how our changing environment may influence human and animal health!
Potential Considerations
As you brainstorm on the elements of this challenge, consider the following:
- How can you describe the daily, monthly, and annual temporal changes of your local terrain?
- How can we better understand real-time changes (eg, average vs. extreme measurements)?
- How can we showcase real-time environmental changes to enhance educational programs for community members of all ages?
Examples of Resources
- CDC Wonder (https://wonder.cdc.gov/): Data include heat wave days, daily air temperatures and heat indices, daily sunlight, daily precipitation, daily land surface temperatures, and daily fine particulate matter.
- North America Land Data Assimilation System (NLDAS) (https://ldas.gsfc.nasa.gov/): Data include daily air temperatures and heat indices, daily sunlight, and daily precipitation.
- Moderate Resolution Imaging Spectroradiometer (MODIS) (https://modis.gsfc.nasa.gov/data/dataprod/mod11.php): Data include land surface temperatures and aerosol optical depth.
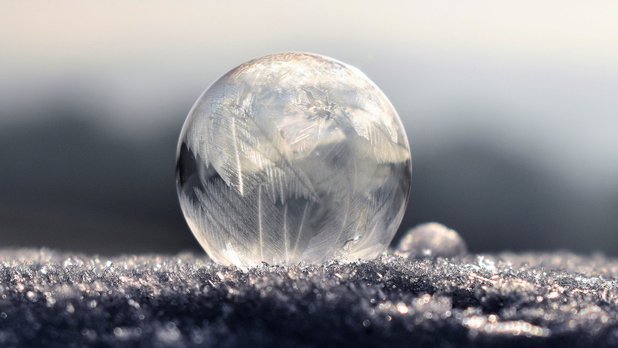
5. An icy glaire
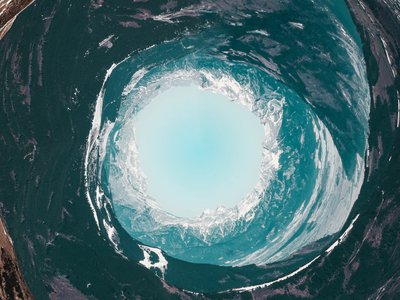
Polar quest

Develop a quest about polar expeditions and changes in the cryosphere. Especially it is necessary to pay attention to changes over the past 10, 30, 100 years.
Details
Traveling in the polar regions can be quite challenging. The locations are remote, and the weather is extreme. Careful planning is required to have a successful trip!
Each year, scientists plan expeditions to the Earth's cryosphere to conduct experiments and set up field sites. They use environmental data collected over many years to know what to expect, and models predict what kind of terrain and conditions they will likely face. It is important for them to be able to look back at past conditions, predict future conditions, and anticipate possible hazards or dangerous scenarios. Weather, terrain, route, food, and supplies all need to be considered.
On top of that, conditions in the cryosphere are changing. The area covered by Arctic sea ice is shrinking, glaciers are melting, and melt ponds can develop on the ice sheets in the summer months.
How can you present your plan? What did you want to use?
How would the quest be different if it happened 10 years ago? 30 years ago? 100 years ago? What has changed in the environment?
Background
Traveling in the polar regions can be quite challenging. The locations are remote, and the weather is extreme. Careful planning is required to have a successful trip!
Each year, scientists plan expeditions to the Earth's cryosphere to conduct experiments and set up field sites. They use environmental data collected over many years to know what to expect, and models predict what kind of terrain and conditions they will likely face. It is important for them to be able to look back at past conditions, predict future conditions, and anticipate possible hazards or dangerous scenarios. Weather, terrain, route, food, and supplies all need to be considered.
On top of that, conditions in the cryosphere are changing. The area covered by Arctic sea ice is shrinking, glaciers are melting, and melt ponds can develop on the ice sheets in the summer months.
Potential Considerations
- When should your explorers leave?
- What kind of transportation will they take?
- What hazards will they face along the way?
- What supplies will they pack?
- What will the terrain look like (Sea ice? Glaciers?)
How can you present your plan? What did you want to use?
How would the quest be different if it happened 10 years ago? 30 years ago? 100 years ago? What has changed in the environment?
Examples of resources:
- NASA Earthdata / NSIDC
- NASA Earthdata - Cryosphere
- NASA Sea Level Change
- NASA Cryosphere Homepage
- NASA Global Imagery Browse Services (GIBS)
- Satellite Visualization Data for the Distributed Biological Observatory
- NASA Virtual Earth System Laboratory
Find my cryosphere

Develop an application that allows you to find out how the Earth’s cryosphere affects certain locations, for example, how the nearest glaciers change the weather in the region.
Details
Where is your cryosphere?
Where the water is frozen. This includes frozen water on land — ice sheets, glaciers, snow, and frozen ground (permafrost) - Mostly, the cryosphere is found in the mountains. In the winter, the cryosphere extends further.
Although it’s not a frozen tundra, the cryosphere affected everyone. It has been shown that it has been directly impacted by the cryosphere. Other communities feel the impact of the cryosphere less directly. Weather patterns, for example.
There are plans to make it clear.
Users can identify the area of permafrost, snowpack, ice sheet, etc.
How far away is the nearest glacier? Ice sheet? Snow pack?
How does shelter depend on the cryosphere? What about lifestyle or recreation?
How would this piece of the cryosphere change? Disappeared?
How does the food in your location (crops, fish, etc.) depend on the cryosphere?
Design creative and interesting ways to display the data!
Background
Where is your cryosphere?
Where the water is frozen. This includes frozen water on land — ice sheets, glaciers, snow, and frozen ground (permafrost) - Mostly, the cryosphere is found in the mountains. In the winter, the cryosphere extends further.
Although it’s not a frozen tundra, the cryosphere affected everyone. It has been shown that it has been directly impacted by the cryosphere. Other communities feel the impact of the cryosphere less directly. Weather patterns, for example.
There are plans to make it clear.
Potential Considerations
Users can identify the area of permafrost, snowpack, ice sheet, etc.
How far away is the nearest glacier? Ice sheet? Snow pack?
How does shelter depend on the cryosphere? What about lifestyle or recreation?
How would this piece of the cryosphere change? Disappeared?
How does the food in your location (crops, fish, etc.) depend on the cryosphere?
Design creative and interesting ways to display the data!
Examples of resources:
- NASA Earthdata / NSIDC
- NASA Earthdata - Cryosphere
- NASA GIBS
- NASA Sea Level Change
- NASA Cryosphere Homepage
- NASA Global Imagery Browse Services (GIBS)
- Satellite Visualization Data for the Distributed Biological Observatory
- NASA Virtual Earth System Laboratory
Polar opposites
Create a data analysis and visualization tool that will show changes in the ice of the Arctic and Antarctic to a wide audience.
Details & Examples of Resources
The Arctic and Antarctica are the polar opposites, and they are the opposite as well! The Arctic Ocean is a semi-closed ocean.
It’s not a problem, but it’s not a problem. ).
NASA studies help us understand how ice structures are in the Arctic and Antarctica. In the case of ice sheets, it can be made.
Analyze and visualize them. In the ice, are there patterns? For example, it can be the case (eg April 29, 2017) (April 29, 2016; April 29, 2015; and so on ...)?
There are conditions in the two regions.
It can be seen at non-US government sites.
Background
The Arctic and Antarctica are the polar opposites, and they are the opposite as well! The Arctic Ocean is a semi-closed ocean.
It’s not a problem, but it’s not a problem. ).
NASA studies help us understand how ice structures are in the Arctic and Antarctica. In the case of ice sheets, it can be made.
Analyze and visualize them. In the ice, are there patterns? For example, it can be the case (eg April 29, 2017) (April 29, 2016; April 29, 2015; and so on ...)?
Potential Considerations
There are conditions in the two regions.
Examples of Resources
It can be seen at non-US government sites.
- The National Snow and Ice Data Center (NSIDC) Distributed Active Archive Center - earthdata.nasa.gov/about/daacs/daac-nsidc
- ArcticDEM (digital elevation model)
- IceBridge DEM - This is a map of
- Land, Vegetation, and Ice Sensor ( LVIS ) - Measures of the height of the polar regions.
- Gravity anomalies from AIRGrav - Measures how much
- IceBridge Image Gallery
6. A Universe of beauty and wonder
On the Shoulders of Giants
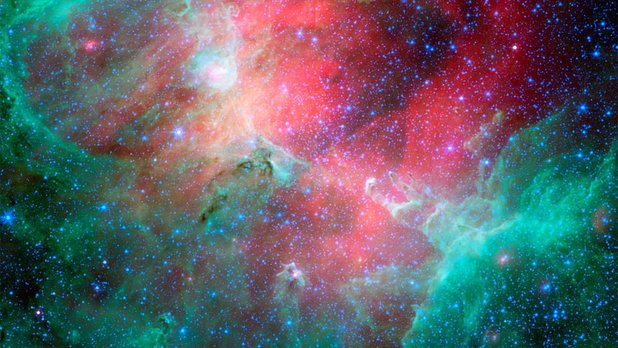
Create a game using Hubble telescope images. The result may be a prototype of a board, card, computer, mobile, or VR game.
Details
Since the early 1990s, it has been the time when it came to the astronomy. It’s a little bit more than that. Scientists use our solar system.
It has been seen that it has been more than 1.3 million times per hour. It can be used as a vehicle for the global solar system. It has been shown that it has been a lot of fun. Hubble images are not CGI; they are not simulations. They are REAL, and we’ve never seen it before.
Your job is to create a game using the game. You can design and prototype a board game, a card game, a computer game, an app or a virtual reality game. From single-player to massively multiplayer; you can focus on the science of the game, up to you.
Background
Since the early 1990s, it has been the time when it came to the astronomy. It’s a little bit more than that. Scientists use our solar system.
It has been seen that it has been more than 1.3 million times per hour. It can be used as a vehicle for the global solar system. It has been shown that it has been a lot of fun. Hubble images are not CGI; they are not simulations. They are REAL, and we’ve never seen it before.
Your job is to create a game using the game. You can design and prototype a board game, a card game, a computer game, an app or a virtual reality game. From single-player to massively multiplayer; you can focus on the science of the game, up to you.
Examples of resources:
- www.nasa.gov/mission_pages/hubble/main/index.html
- www.nasa.gov/mission_pages/hubble/multimedia/index.html
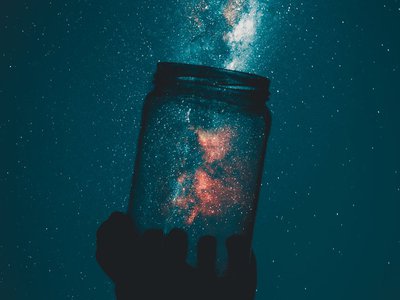
Remix the golden record
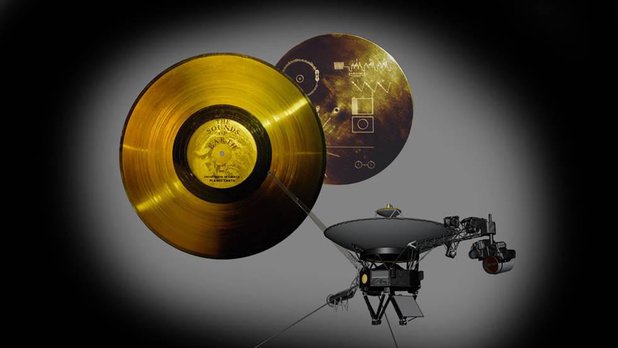
Develop a concept capsule of time that would tell extraterrestrial civilizations about human culture and the solar system. Engineering skills for prototyping and a philosophical approach to capsule maintenance will be required.
Details
Several interstellar communications - including our radio system, radio, art, and more - are aboard satellites or radio waves. Our local star system. Physical communications have been used. Radio communications have been transmitted from radio-based radio systems. Examples of these projects include the Voyager, the Voyager, and the Teen Age Message, and the Cosmic Call messages.
Your space system. Your concept should not be able to be integrated into a time capsule and flown abrade an interstellar spacecraft.
Form as diverse as possible. The team may include members with diverse disciplines, such as philosophers, artists, musicians, mathematicians, scientists, engineers, etc.
It is a clear idea that our team will be How would the content be decayed? May need to play back the recordings. It means that you can record it (i.e. language, diagrams, math, etched recordings, etc.), It’s not a problem, because the capsule couldn’t have been taken.
What did previous communication missions do right? Can your team improve upon their methods? The concept is available during the previous missions. Whatever technology you envision using, you must explain your approach
Voyager golden records were developed. It would be possible to note that our sample would be able to make it possible. It can be used as a guideline for different projects.
Background
Several interstellar communications - including our radio system, radio, art, and more - are aboard satellites or radio waves. Our local star system. Physical communications have been used. Radio communications have been transmitted from radio-based radio systems. Examples of these projects include the Voyager, the Voyager, and the Teen Age Message, and the Cosmic Call messages.
Your space system. Your concept should not be able to be integrated into a time capsule and flown abrade an interstellar spacecraft.
Potential Considerations
Form as diverse as possible. The team may include members with diverse disciplines, such as philosophers, artists, musicians, mathematicians, scientists, engineers, etc.
It is a clear idea that our team will be How would the content be decayed? May need to play back the recordings. It means that you can record it (i.e. language, diagrams, math, etched recordings, etc.), It’s not a problem, because the capsule couldn’t have been taken.
What did previous communication missions do right? Can your team improve upon their methods? The concept is available during the previous missions. Whatever technology you envision using, you must explain your approach
Voyager golden records were developed. It would be possible to note that our sample would be able to make it possible. It can be used as a guideline for different projects.
Examples of resources:
- Voyager golden record
- Interstellar Record Collection
- Pioneer Plaque description
- Arecibo Message description
- Cosmic Call description
- Nasa sounds
- NASA eBooks
- Existing NASA multimedia (“Galleries”)
Mission to the moon
Plan a research mission to the moon: define mission objectives, determine the landing site of the rover.
Details
Scientists wouldn't send a rover to the moon without a detailed plan. Lunar rover will conduct, including it it land. Scientists use scientifically significant landing sites.
Astro-visualization software tools. This is a study of the use of scientific data from scientists and scientists.
It is a challenge to make it possible.
As you choose for a lunar rover:
Background
Scientists wouldn't send a rover to the moon without a detailed plan. Lunar rover will conduct, including it it land. Scientists use scientifically significant landing sites.
Astro-visualization software tools. This is a study of the use of scientific data from scientists and scientists.
It is a challenge to make it possible.
Potential Considerations
As you choose for a lunar rover:
- What are your mission goals? What do you hope to learn?
- Will you be able to travel at the landing site?
- Is it possible?
- How much did you want to learn about?
Examples of resources:
- moon.nasa.gov
- Eyes on the Solar System App
- JPL Moonkit
- NASA Science Lunar Resources
- Lunar Reconnaissance Orbiter Website
- American Museum of Natural History | Science Mission Directorate
Virtual space exploration
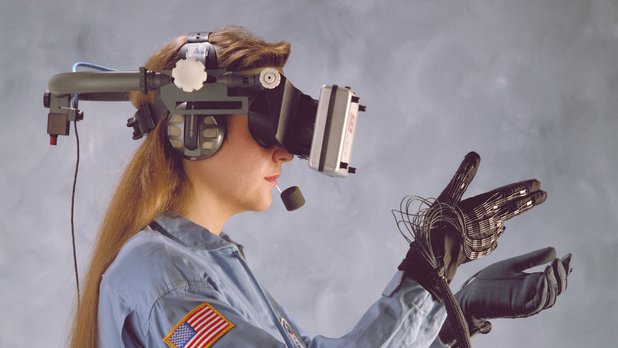
Recreate location from the Moon or Mars in VR. At your disposal high-quality surface models from the project High Resolution Imaging Science.
Details & Examples of Resources
There are remarkable surface features. For example, flat areas. Permanently shadowed craters may have frozen water at the bottom of them. Skylights are holes that provide provide shelter. Areas rich in nickel and titanium.
Virtual Reality (VR) enables you to explore the Moon and Mars from a distance. With the Moon Trek and Mars Trek web apps, it's possible to create models that are suitable for VR or 3D printing. Digital Terrain Models from HiRISE can be converted to 3D surface models.
It is your experience.
It is also possible to add surface exploration assets. Your VR environment could provide interactivity, such as riding a lander to the surface, or driving a rover.
You can consider the following:
Several websites are available for free for self-education. Developing a VR model program. Typically, 3D graphics programs to define behaviors. Depending on the program, the scripting language might be Python, JavaScript, Lua, or a C like language.
Inspire others to reuse your VR models! Consider the public and inspire students through virtual exploration. You can choose a region of the Moon or Mars. Establish a repository where you can use your VR experience. Forgiven. Provide a link to your project page.
Surface data maps, Digital Terrain Models, and 3D models. Patterns, patterns, and develop behavioral scripts. Hosting services enable you to be able to link to a web page.
Surface Data Sources
Developed at JPL, the Moon Trek and Mars Trek web apps provide a function to generate a 3D Print File in STL or OBJ format. When you open your web browser, you will be offered a brief tutorial that explains the functions and features. Click here for a webcam icon for a 3D-printable model; Selecting this option will open a dialog box. Select OBJ, and reduce the number to a number around 100. More than one and less.
Virtual Reality Development Systems
After the selection of the DTM for the conversion, the engine and the engine are designed.
Virtual Reality Hosting Web Services
After integrating your virtual reality model, you can upload it to a hosting service. A few VR hosting services provide a web-based editor; so, it's possible to skip a game engine.
Suggested keywords for online resource searches:
The challenge
Generate Virtual Reality environments for the Moon and Mars! Obtain 3D models from NASA resources, such as Moon Trek and Mars Trek. Integrate 3D models of surface exploration systems and habitats. Developed and deployed a hosting service.
Background
There are remarkable surface features. For example, flat areas. Permanently shadowed craters may have frozen water at the bottom of them. Skylights are holes that provide provide shelter. Areas rich in nickel and titanium.
Virtual Reality (VR) enables you to explore the Moon and Mars from a distance. With the Moon Trek and Mars Trek web apps, it's possible to create models that are suitable for VR or 3D printing. Digital Terrain Models from HiRISE can be converted to 3D surface models.
It is your experience.
It is also possible to add surface exploration assets. Your VR environment could provide interactivity, such as riding a lander to the surface, or driving a rover.
Potential Considerations
You can consider the following:
Several websites are available for free for self-education. Developing a VR model program. Typically, 3D graphics programs to define behaviors. Depending on the program, the scripting language might be Python, JavaScript, Lua, or a C like language.
Inspire others to reuse your VR models! Consider the public and inspire students through virtual exploration. You can choose a region of the Moon or Mars. Establish a repository where you can use your VR experience. Forgiven. Provide a link to your project page.
Examples of Resources
Surface data maps, Digital Terrain Models, and 3D models. Patterns, patterns, and develop behavioral scripts. Hosting services enable you to be able to link to a web page.
Surface Data Sources
Developed at JPL, the Moon Trek and Mars Trek web apps provide a function to generate a 3D Print File in STL or OBJ format. When you open your web browser, you will be offered a brief tutorial that explains the functions and features. Click here for a webcam icon for a 3D-printable model; Selecting this option will open a dialog box. Select OBJ, and reduce the number to a number around 100. More than one and less.
Virtual Reality Development Systems
After the selection of the DTM for the conversion, the engine and the engine are designed.
Virtual Reality Hosting Web Services
After integrating your virtual reality model, you can upload it to a hosting service. A few VR hosting services provide a web-based editor; so, it's possible to skip a game engine.
Suggested keywords for online resource searches:
- Virtual world hosting
- 3D game development system
- Virtual Reality development kits
- Virtual reality Application Programming Interface or API
- 3D graphics code libraries for Javascript

- You can learn more about each task here: 2018.spaceappschallenge.org/challenges
- Registration is open for the hackathon: 2018.spaceappschallenge.org/locations/moscow
- You can ask questions and find the team in the hackathon member chat: t.me/nasaspaceapps_moscow
Schedule and lectures
9:30 am - Registration
9:45 am - Opening Ceremony
10:00 am - CODING STARTS!
11:00 am - Experience of the stratospheric launch of the Cubesat format machine (Vyacheslav Dmitriev)
11:40 am - Can we count people from space? And other indicators that can be obtained using machine learning in satellite images (Georgy Potapov)
12:20 pm - Back to the Earth: reality index HERE (Victor Rudoy)
12:40 pm - Living outside the Earth (Alexander Shaenko)
1:20 pm - Intermediate Check
2:00 pm - Lunch
3:00 pm - Jetpacks: history, present, first Russian (Alexey Statsenko)
7:00 pm - Intermediate Check
8:00 pm - Dinner
11:00 pm - End of the first day
8:00 am - Start of the second day
9:30 am - Morning coffee
10:30 am - Intermediate Check
12:00 pm - Possible use of the blockchain in space (Rodion Mamin)
2:00 pm - Lunch
3:00 pm - Preparation for presentations
4:30 pm - Project Presentations
6:30 pm - Closing Ceremony
The 20th of October
9:30 am - Registration
9:45 am - Opening Ceremony
10:00 am - CODING STARTS!
11:00 am - Experience of the stratospheric launch of the Cubesat format machine (Vyacheslav Dmitriev)
11:40 am - Can we count people from space? And other indicators that can be obtained using machine learning in satellite images (Georgy Potapov)
12:20 pm - Back to the Earth: reality index HERE (Victor Rudoy)
12:40 pm - Living outside the Earth (Alexander Shaenko)
1:20 pm - Intermediate Check
2:00 pm - Lunch
3:00 pm - Jetpacks: history, present, first Russian (Alexey Statsenko)
7:00 pm - Intermediate Check
8:00 pm - Dinner
11:00 pm - End of the first day
October 21
8:00 am - Start of the second day
9:30 am - Morning coffee
10:30 am - Intermediate Check
12:00 pm - Possible use of the blockchain in space (Rodion Mamin)
2:00 pm - Lunch
3:00 pm - Preparation for presentations
4:30 pm - Project Presentations
6:30 pm - Closing Ceremony
Source: https://habr.com/ru/post/426915/
All Articles