Spinning the spiral: math and hallucinations
When trying to imagine the hallucinations caused by narcotic substances, swirling, spiral psychedelic forms resembling tunnel vision immediately come to mind. But such geometric structures can cause more than hallucinatory drugs like LSD, cannabis, or mescaline . People talked about the occurrence of such visions at the time when they were dying, during such painful conditions as epilepsy and schizophrenia, as a result of sensory deprivation , or even after simple pressure on the eyeballs. Such geometric hallucinations are so common that over the past century scientists have begun to wonder whether they can tell us something fundamental about the structure of our brain. And, apparently, it is.
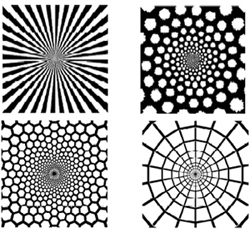
Form constants created on the computer. The two upper images mimic a funnel and a spiral that occurs after taking LSD. Lower left - the cells created by marijuana. Bottom right - the web.
Systematically geometric hallucinations first began to explore in the 1920s, the American-German psychologist Heinrich Kluver . Kluwer's interest in visual perception eventually led him to experiment with peyote , cactus, celebrated by Carlos Castaneda , whose psychoactive ingredient, mescaline, played an important role in the shamanistic rituals of many tribes of Central America. Mescaline is well known for its ability to cause bright visual hallucinations. Using peyote in the lab with an assistant, Kluver noticed repetitive geometric shapes in mescaline hallucinations, and divided them into four types, calling them shape constants : tunnels and funnels, spirals, grids, which include cells and triangles, and cobwebs.
In the 1970s, mathematicians Jack Cowen and Bard Ermentraut used Kluwer’s classification to create a theory that describes what happens in the brain when it makes us believe that we see geometric patterns. Their theory was further developed by other scientists, including Paul Breslov, a professor of mathematical and computational neuroscience at the newly founded Oxford Center for Collaborative Applied Mathematics.
')
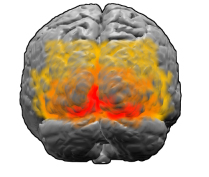
The visual cortex. V1 is marked in red.
[ * Reference to the Vietnamese tale "Where the stripes of a tiger are" / approx. trans. ]
The first area of visual cortex that processes images in humans and mammals is the site known as V1. Experimental evidence, such as fMRI images, suggests that Kluwer patterns also mainly originate from V1, rather than appearing later somewhere in the visual system. Like the rest of the brain, V1 has a complex, wrinkled, folded structure — however, there is a surprisingly straightforward way to translate what we see in our field of vision into neuronal activity in V1. “Imagine that we are deploying V1,” says Breslov. - It can be imagined as a nervous tissue several millimeters thick, with different layers of neurons. In the first approximation, neurons throughout the depth of the cortex behave in a similar way, so if you flatten them, you can think of V1 as a two-dimensional sheet. ”
The object or scene of the visual world is projected as a two-dimensional image on the retina of each eye, therefore, what we see can also be regarded as a flat sheet: field of view. Each point on this sheet can be designated by two coordinates, like a point on a map, or a point on a flat model V1. Intermittent light and dark areas that make up geometric hallucinations are caused by intermittent areas of high and low neuron activity in V1 - areas where neurons are activated very quickly, and areas where the opposite is true.
To translate visual patterns into the activity of neurons, a coordinate grid is necessary - a rule according to which each point of the field of view is associated with a point of a flat model V1. In the 1970s, scientists, including Cowan, made such a grid based on knowledge of the anatomy of the interaction of retinal neurons with neurons in V1. For each light or dark portion of the visual field, the mapping defines a portion of high or low neuron activity in V1.
How does this mapping of the retina and bark transform Kluwer's geometric patterns? It turns out that hallucinations, causing spirals, circles and rays emanating from the center, correspond to the strips of neuron activity in V1, passing at given angles. Lattices such as honeycombs or cells correspond to hexagonal patterns of activity in V1. This in itself may not be so interesting, but there is one precedent: it was the scientists who observed stripes and hexagons when modeling other examples of pattern formation, for example, convection of liquids, or, more surprisingly, spots and stripes on animal skins. The mathematics that controls the formation of these patterns was well known, and also proposed a mechanism for modeling the work of the visual cortex.
Imagine the field of view in the form of a flat sheet with polar coordinates: each point P is defined by two numbers, (r, θ), where r is the distance to the origin of coordinates O, and θ is the angle between the OP segment and the x axis. The origin corresponds to the center of the field of view. V1 is also modeled as a flat sheet, but this time with Cartesian coordinates (x, y). The exact coordinate display of the field of view and the flat model V1 is too complicated for this article, but for points far enough from the center of the field of view (that is, for a sufficiently large r), it resembles a logarithmic display:
The map transmits a circle of radius r in the field of view in a straight vertical segment with x = ln r, and a ray emanating from the origin of coordinates O at an angle θ in a straight horizontal segment with y = θ
The first model of the formation of patterns on the skins of animals dates back to Alan Turing , better known as the father of modern computer science and the hacker from Bletchley Park, hacking codes. Turing was interested in how such a spatially homogeneous system, as a uniform ball of cells, which is an animal embryo, can create spatially non-homogeneous, but static patterns, such as zebra stripes.
Turing suggested that these patterns appear as a result of the reaction-diffusion process . Imagine the embryo of an animal in whose skin two chemical compounds live. One of them is an inhibitor that suppresses the production of both itself and another chemical. The other is a catalyst that causes the production of both substances.
At the initial moment of the Turing model, the two chemicals perfectly balance each other — they are in equilibrium, and their concentration at different points on the embryo does not change with time. Now imagine that for some reason at one point the concentration of the catalyst increased slightly. This small disturbance drives the entire system. Increased local concentration of the catalyst means that more catalyst and inhibitor is produced there. However, both compounds also diffuse through the skin of the embryo, suppressing and catalyzing their production in other places.
For example, if the inhibitor diffuses faster than the catalyst, it will quickly surround the point of perturbation and reduce the concentration of catalyst in it. As a result, we will have a plot with a high concentration of catalyst, surrounded by a high concentration of inhibitor - in other words, a spot of catalyst against the background of the inhibitor. Depending on the diffusion rate of the two compounds, it is possible that such a spotty pattern will appear across the skin of the embryo, and will eventually stabilize.
Turing recorded a system of differential equations describing a competition between two compounds — you can let them evolve over time and see if patterns appear. These equations depend on the parameters describing the diffusion rate of the two compounds: if you select them correctly, the system eventually stabilizes to form a certain pattern that can be changed by changing the parameters. The link presents an applet in Java , where you can play around with the parameters and look at the resulting patterns.
For simplicity, imagine an embryo as a one-dimensional line. At any time moment t and at any point x of the embryo, the concentration of the catalyst (activator) and inhibitor (inhibitor) is given by the functions A (x, t) and I (x, t). They change over time according to the following rules:
The first term to the right of each of the equations describes the amount of catalyst and inhibitor production. They are a function of catalyst and inhibitor concentrations, since both affect the reaction rate.
The second term to the right of each of the equations is the second derivative, which describes the rate of change of the gradient of the catalyst and inhibitor. They set the diffusion rate.
The additional term d on the right side of the second equation is the diffusion coefficient, which indicates how much the inhibitor diffuses faster than the catalyst. Turing showed that the superiority in the rate of inhibitor is a crucial parameter for the process of generating spots.
The activity of neurons in the brain is not a reaction-diffuse process, but it has analogies with the Turing model. “Neurons send signals to each other through data output channels called axons,” says Breslov. Neurons react to each other's signals, and you will have a reaction. "The signals spread so quickly, compared to the patterning process, that they can be taken for instant interaction." Therefore, instead of diffusion, a local process, we have instant interaction at a distance. The roles of catalyst and inhibitor are played by two different classes of neurons. “There are excitatory neurons — which increase the likelihood of other neurons to become active — and there are suppressive neurons that reduce this likelihood,” says Breslov. “Competition between two classes of neurons is an analogy to the catalyst-inhibitor mechanism in the Turing model.”
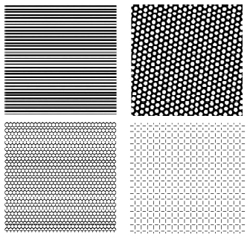
Striped, hexagonal and rectangular patterns of nervous activity in V1, generated by a mathematical model
Inspired by the analogies of Turing processes, Cowan and Ermentraut created a model of nervous activity in V1 using a set of equations formulated by Cowan and Hugh Wilson. Although the equations turned out to be more complicated than that of Turing, you can still play the same game, allowing the system to evolve over time, and see if patterns of nervous activity develop. “You may find that under certain conditions, if you increase the parameter representing, for example, the effect of drugs on the cortex, this will lead to an increase in periodic patterns,” says Breslov.
The Cowan and Ermentrauta model suggests that geometric hallucinations arise as a result of instability in V1: something, for example, the presence of a drug, removes the neural network from a balanced state, triggering the growing like a snowball, the interaction between excitatory and suppressive neurons, which then stabilizes in the form of striped or hexagonal patterns of nervous activity in V1. Then we in sight “observe” this pattern in the form of the geometric structures described by Kluver.
In fact, everything is not as simple as in the Cowan and Ermentraut model, since neurons react not only to bright and dark images. The thickness of the V1 neurons are arranged in columns, known as hypercolumns , each approximately responding to a small area of the visual field. But not all neurons in the hypercolumn are the same: in addition to recognizing the light and dark areas, each neuron specializes in recognizing local faces — lines dividing the light and dark areas in one part of the image — of a certain orientation. Some recognize horizontal faces, others - vertical, others - faces that are at an angle of 45 °, and so on. Each hypercolumn contains columns of neurons of all preferred orientations, so the hypercolumn can react to the edges of all orientations in a certain part of the visual field. It is the composition of the hypercolumns and orientation preferences that allow us to recognize the contours, surfaces and textures of the visual world.
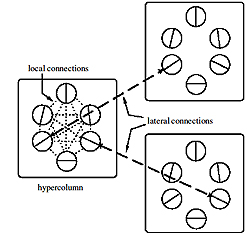
Connections in V1: neurons in the hypercolumn interact with most of the other neurons. But with neurons in other hypercolumns, they react only if the columns are located in the direction of their orientation, and the neurons have the same orientational preference.
In recent years, quite a lot of anatomical evidence has been gathered of how neurons interact with different orientational preferences. Inside their geo-column, neurons interact with most other neurons, regardless of their preferences. But, as for the neurons of other hypercolumns, they act more selectively, interacting only with neurons of similar preferences, so as to ensure that we can recognize continuous contours in the visual world.
Breslov together with Cowan, mathematician Martin Golubitsky and other scientists summarized the original model of Cowan and Ermentraut to take into account these new anatomical evidence. They again used the plane as the basis of the V1 model: each hypercolumn is represented on the plane by a point (x, y), and each point (x, y) corresponds to a hypercolumn. Neurons with a given preference for orientation θ (where θ is the angle between 0 and π are indicated by the position of the hypercolumn (x, y) along with the angle θ - that is, they are denoted by three units of information, (x, y, θ). Therefore, V1 models are not a plane, but a plane with a full set of orientations for each point.
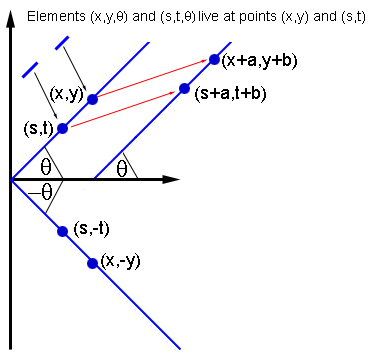
If two elements, (x, y, θ) and (s, t, θ) interact, then other elements interact with the same orientation at the points (x + a, y + b) and (s + a, t + b ), and elements with the -θ orientation at the points (x, -y) and (s, -t).
To comply with the anatomical evidence, Breslov and colleagues suggested that a neuron indicated by a dot (x 0 , y 0 , θ 0 ) interacts with all other neurons in the same hypercolumn (x 0 , y 0 ). But it interacts with neurons from other hypercolumns only if they lie in its preferred orientation θ 0 : on the plane, draw a line through the point (x 0 , y 0 ) at an angle θ 0 . Then the neurons, denoted by the point (x 0 , y 0 , θ 0 ), interact only with the neurons of the hypercolumns lying on the same line, that is, having the same preferred orientation θ 0 .
Such an interaction scheme is very symmetrical. For example, it does not change when the plane is shifted in any direction by any distance: if two elements, (x 0 , y 0 , θ 0 ) and (s 0 , t 0 , φ 0 ), interact, then the elements obtained by the shift, (x 0 + a, y 0 + b, θ 0 ) and (s 0 + a, t 0 + b, φ 0 ) for some a and b, interact in the same way. By the same principle, the scheme is invariant with respect to rotations and reflections of the plane.
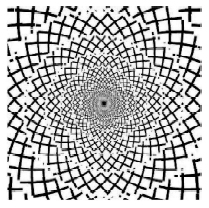
Hallucination with a lattice tunnel created by a mathematical model. It strongly resembles the hallucinations that occur when taking marijuana.
Breslov and colleagues used a generalized version of the equations from the original model to allow the system to evolve. The result is a model that is not only more accurate in terms of the anatomy of the V1, but also capable of generating in view the geometric patterns that the original model was not capable of. This includes lattice tunnels, honeycombs and cobwebs, the orientation of the contours of which characterizes them better than light and dark contrast areas.
Moreover, the model is sensitive to the symmetries of neuron interaction patterns: mathematicians have shown that it is these symmetries that generate the formation of periodic patterns of nervous activity. Therefore, the model suggests that hallucinations give rise to the location of hyper columns and orientation preferences, that is, mechanisms that help us recognize the edges, contours, surfaces and textures of the visual world. It is when these mechanisms lose their stability, for example, as a result of the effects of a drug, that patterns of activity appear, turning into visual hallucinations.
The Breslov model not only allows insight into the mechanisms that generate visual hallucinations, but also gives hints about brain architecture in a broader sense. Together with his wife, an experimental neurobiologist, Breslov studied the contours of hypercolumn connections in normal vision, in order to understand how visual images are processed. “People are used to thinking that neurons in V1 simply define local edges, and that one needs to go to higher levels of the brain in order to collect these faces and recognize more complex things like contours and surfaces. But from our work with our wife, it is clear that these structures in V1 actually allow the visual cortex to recognize the contours at an early stage and carry out more global processing. It was believed that we are processing more and more complex aspects of the image, rising higher in the hierarchy of the brain. Now it became clear that there is an active feedback between the upper and lower parts of the cortex. This is not a simple hierarchical process, but an incredibly complex and active system, which will take many years to understand. ”
Among the practical applications of this work is computer vision - computer scientists are already building structures with internal connections with which Breslov and colleagues played in building models to teach computers to define contours and textures. If you show a little imagination, you can imagine that this study will ever be able to help restore vision to people with impairments. “The question is whether it is possible to somehow stimulate a part of the visual cortex, bypassing the eye, and use this to orient the blind,” says Breslov. “If you understand how the cortex works and how it reacts to stimulation, perhaps, then it will be possible to invent a better method for its proper stimulation.”
There are even areas of application that are not related to the brain at all. Breslov applied the ideas obtained through work to other situations in which objects are located in space with a certain orientation, for example, to fibroblasts from human and animal tissues. He showed that under certain conditions, these interacting cells and molecules can line up and produce patterns similar to those that appear in V1.
People talked about seeing hallucinations, since the beginning of time, and in almost all cultures - images of hallucinations can even be found in petroglyphs and rock paintings. In the traditions of the shamans of the whole world, they are treated as messages from the world of the spirits. Few modern neuroscientists will agree with the involvement of spirits in this, but as heralds of the hidden world - this time, the hidden world of our brain - these hallucinations have not lost their capabilities.
Form constants created on the computer. The two upper images mimic a funnel and a spiral that occurs after taking LSD. Lower left - the cells created by marijuana. Bottom right - the web.
Systematically geometric hallucinations first began to explore in the 1920s, the American-German psychologist Heinrich Kluver . Kluwer's interest in visual perception eventually led him to experiment with peyote , cactus, celebrated by Carlos Castaneda , whose psychoactive ingredient, mescaline, played an important role in the shamanistic rituals of many tribes of Central America. Mescaline is well known for its ability to cause bright visual hallucinations. Using peyote in the lab with an assistant, Kluver noticed repetitive geometric shapes in mescaline hallucinations, and divided them into four types, calling them shape constants : tunnels and funnels, spirals, grids, which include cells and triangles, and cobwebs.
In the 1970s, mathematicians Jack Cowen and Bard Ermentraut used Kluwer’s classification to create a theory that describes what happens in the brain when it makes us believe that we see geometric patterns. Their theory was further developed by other scientists, including Paul Breslov, a professor of mathematical and computational neuroscience at the newly founded Oxford Center for Collaborative Applied Mathematics.
')
From where the cerebral cortex strips *
The visual cortex. V1 is marked in red.
[ * Reference to the Vietnamese tale "Where the stripes of a tiger are" / approx. trans. ]
The first area of visual cortex that processes images in humans and mammals is the site known as V1. Experimental evidence, such as fMRI images, suggests that Kluwer patterns also mainly originate from V1, rather than appearing later somewhere in the visual system. Like the rest of the brain, V1 has a complex, wrinkled, folded structure — however, there is a surprisingly straightforward way to translate what we see in our field of vision into neuronal activity in V1. “Imagine that we are deploying V1,” says Breslov. - It can be imagined as a nervous tissue several millimeters thick, with different layers of neurons. In the first approximation, neurons throughout the depth of the cortex behave in a similar way, so if you flatten them, you can think of V1 as a two-dimensional sheet. ”
The object or scene of the visual world is projected as a two-dimensional image on the retina of each eye, therefore, what we see can also be regarded as a flat sheet: field of view. Each point on this sheet can be designated by two coordinates, like a point on a map, or a point on a flat model V1. Intermittent light and dark areas that make up geometric hallucinations are caused by intermittent areas of high and low neuron activity in V1 - areas where neurons are activated very quickly, and areas where the opposite is true.
To translate visual patterns into the activity of neurons, a coordinate grid is necessary - a rule according to which each point of the field of view is associated with a point of a flat model V1. In the 1970s, scientists, including Cowan, made such a grid based on knowledge of the anatomy of the interaction of retinal neurons with neurons in V1. For each light or dark portion of the visual field, the mapping defines a portion of high or low neuron activity in V1.
How does this mapping of the retina and bark transform Kluwer's geometric patterns? It turns out that hallucinations, causing spirals, circles and rays emanating from the center, correspond to the strips of neuron activity in V1, passing at given angles. Lattices such as honeycombs or cells correspond to hexagonal patterns of activity in V1. This in itself may not be so interesting, but there is one precedent: it was the scientists who observed stripes and hexagons when modeling other examples of pattern formation, for example, convection of liquids, or, more surprisingly, spots and stripes on animal skins. The mathematics that controls the formation of these patterns was well known, and also proposed a mechanism for modeling the work of the visual cortex.
From visual field to visual cortex
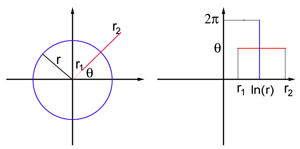
Imagine the field of view in the form of a flat sheet with polar coordinates: each point P is defined by two numbers, (r, θ), where r is the distance to the origin of coordinates O, and θ is the angle between the OP segment and the x axis. The origin corresponds to the center of the field of view. V1 is also modeled as a flat sheet, but this time with Cartesian coordinates (x, y). The exact coordinate display of the field of view and the flat model V1 is too complicated for this article, but for points far enough from the center of the field of view (that is, for a sufficiently large r), it resembles a logarithmic display:
The map transmits a circle of radius r in the field of view in a straight vertical segment with x = ln r, and a ray emanating from the origin of coordinates O at an angle θ in a straight horizontal segment with y = θ
Where do leopard spots
The first model of the formation of patterns on the skins of animals dates back to Alan Turing , better known as the father of modern computer science and the hacker from Bletchley Park, hacking codes. Turing was interested in how such a spatially homogeneous system, as a uniform ball of cells, which is an animal embryo, can create spatially non-homogeneous, but static patterns, such as zebra stripes.
Turing suggested that these patterns appear as a result of the reaction-diffusion process . Imagine the embryo of an animal in whose skin two chemical compounds live. One of them is an inhibitor that suppresses the production of both itself and another chemical. The other is a catalyst that causes the production of both substances.
At the initial moment of the Turing model, the two chemicals perfectly balance each other — they are in equilibrium, and their concentration at different points on the embryo does not change with time. Now imagine that for some reason at one point the concentration of the catalyst increased slightly. This small disturbance drives the entire system. Increased local concentration of the catalyst means that more catalyst and inhibitor is produced there. However, both compounds also diffuse through the skin of the embryo, suppressing and catalyzing their production in other places.
For example, if the inhibitor diffuses faster than the catalyst, it will quickly surround the point of perturbation and reduce the concentration of catalyst in it. As a result, we will have a plot with a high concentration of catalyst, surrounded by a high concentration of inhibitor - in other words, a spot of catalyst against the background of the inhibitor. Depending on the diffusion rate of the two compounds, it is possible that such a spotty pattern will appear across the skin of the embryo, and will eventually stabilize.
Turing recorded a system of differential equations describing a competition between two compounds — you can let them evolve over time and see if patterns appear. These equations depend on the parameters describing the diffusion rate of the two compounds: if you select them correctly, the system eventually stabilizes to form a certain pattern that can be changed by changing the parameters. The link presents an applet in Java , where you can play around with the parameters and look at the resulting patterns.
Animal Pattern Equations
For simplicity, imagine an embryo as a one-dimensional line. At any time moment t and at any point x of the embryo, the concentration of the catalyst (activator) and inhibitor (inhibitor) is given by the functions A (x, t) and I (x, t). They change over time according to the following rules:
The first term to the right of each of the equations describes the amount of catalyst and inhibitor production. They are a function of catalyst and inhibitor concentrations, since both affect the reaction rate.
The second term to the right of each of the equations is the second derivative, which describes the rate of change of the gradient of the catalyst and inhibitor. They set the diffusion rate.
The additional term d on the right side of the second equation is the diffusion coefficient, which indicates how much the inhibitor diffuses faster than the catalyst. Turing showed that the superiority in the rate of inhibitor is a crucial parameter for the process of generating spots.
Brain patterns
The activity of neurons in the brain is not a reaction-diffuse process, but it has analogies with the Turing model. “Neurons send signals to each other through data output channels called axons,” says Breslov. Neurons react to each other's signals, and you will have a reaction. "The signals spread so quickly, compared to the patterning process, that they can be taken for instant interaction." Therefore, instead of diffusion, a local process, we have instant interaction at a distance. The roles of catalyst and inhibitor are played by two different classes of neurons. “There are excitatory neurons — which increase the likelihood of other neurons to become active — and there are suppressive neurons that reduce this likelihood,” says Breslov. “Competition between two classes of neurons is an analogy to the catalyst-inhibitor mechanism in the Turing model.”
Striped, hexagonal and rectangular patterns of nervous activity in V1, generated by a mathematical model
Inspired by the analogies of Turing processes, Cowan and Ermentraut created a model of nervous activity in V1 using a set of equations formulated by Cowan and Hugh Wilson. Although the equations turned out to be more complicated than that of Turing, you can still play the same game, allowing the system to evolve over time, and see if patterns of nervous activity develop. “You may find that under certain conditions, if you increase the parameter representing, for example, the effect of drugs on the cortex, this will lead to an increase in periodic patterns,” says Breslov.
The Cowan and Ermentrauta model suggests that geometric hallucinations arise as a result of instability in V1: something, for example, the presence of a drug, removes the neural network from a balanced state, triggering the growing like a snowball, the interaction between excitatory and suppressive neurons, which then stabilizes in the form of striped or hexagonal patterns of nervous activity in V1. Then we in sight “observe” this pattern in the form of the geometric structures described by Kluver.
Brain symmetry
In fact, everything is not as simple as in the Cowan and Ermentraut model, since neurons react not only to bright and dark images. The thickness of the V1 neurons are arranged in columns, known as hypercolumns , each approximately responding to a small area of the visual field. But not all neurons in the hypercolumn are the same: in addition to recognizing the light and dark areas, each neuron specializes in recognizing local faces — lines dividing the light and dark areas in one part of the image — of a certain orientation. Some recognize horizontal faces, others - vertical, others - faces that are at an angle of 45 °, and so on. Each hypercolumn contains columns of neurons of all preferred orientations, so the hypercolumn can react to the edges of all orientations in a certain part of the visual field. It is the composition of the hypercolumns and orientation preferences that allow us to recognize the contours, surfaces and textures of the visual world.
Connections in V1: neurons in the hypercolumn interact with most of the other neurons. But with neurons in other hypercolumns, they react only if the columns are located in the direction of their orientation, and the neurons have the same orientational preference.
In recent years, quite a lot of anatomical evidence has been gathered of how neurons interact with different orientational preferences. Inside their geo-column, neurons interact with most other neurons, regardless of their preferences. But, as for the neurons of other hypercolumns, they act more selectively, interacting only with neurons of similar preferences, so as to ensure that we can recognize continuous contours in the visual world.
Breslov together with Cowan, mathematician Martin Golubitsky and other scientists summarized the original model of Cowan and Ermentraut to take into account these new anatomical evidence. They again used the plane as the basis of the V1 model: each hypercolumn is represented on the plane by a point (x, y), and each point (x, y) corresponds to a hypercolumn. Neurons with a given preference for orientation θ (where θ is the angle between 0 and π are indicated by the position of the hypercolumn (x, y) along with the angle θ - that is, they are denoted by three units of information, (x, y, θ). Therefore, V1 models are not a plane, but a plane with a full set of orientations for each point.
If two elements, (x, y, θ) and (s, t, θ) interact, then other elements interact with the same orientation at the points (x + a, y + b) and (s + a, t + b ), and elements with the -θ orientation at the points (x, -y) and (s, -t).
To comply with the anatomical evidence, Breslov and colleagues suggested that a neuron indicated by a dot (x 0 , y 0 , θ 0 ) interacts with all other neurons in the same hypercolumn (x 0 , y 0 ). But it interacts with neurons from other hypercolumns only if they lie in its preferred orientation θ 0 : on the plane, draw a line through the point (x 0 , y 0 ) at an angle θ 0 . Then the neurons, denoted by the point (x 0 , y 0 , θ 0 ), interact only with the neurons of the hypercolumns lying on the same line, that is, having the same preferred orientation θ 0 .
Such an interaction scheme is very symmetrical. For example, it does not change when the plane is shifted in any direction by any distance: if two elements, (x 0 , y 0 , θ 0 ) and (s 0 , t 0 , φ 0 ), interact, then the elements obtained by the shift, (x 0 + a, y 0 + b, θ 0 ) and (s 0 + a, t 0 + b, φ 0 ) for some a and b, interact in the same way. By the same principle, the scheme is invariant with respect to rotations and reflections of the plane.
Hallucination with a lattice tunnel created by a mathematical model. It strongly resembles the hallucinations that occur when taking marijuana.
Breslov and colleagues used a generalized version of the equations from the original model to allow the system to evolve. The result is a model that is not only more accurate in terms of the anatomy of the V1, but also capable of generating in view the geometric patterns that the original model was not capable of. This includes lattice tunnels, honeycombs and cobwebs, the orientation of the contours of which characterizes them better than light and dark contrast areas.
Moreover, the model is sensitive to the symmetries of neuron interaction patterns: mathematicians have shown that it is these symmetries that generate the formation of periodic patterns of nervous activity. Therefore, the model suggests that hallucinations give rise to the location of hyper columns and orientation preferences, that is, mechanisms that help us recognize the edges, contours, surfaces and textures of the visual world. It is when these mechanisms lose their stability, for example, as a result of the effects of a drug, that patterns of activity appear, turning into visual hallucinations.
Beyond the hallucinations
The Breslov model not only allows insight into the mechanisms that generate visual hallucinations, but also gives hints about brain architecture in a broader sense. Together with his wife, an experimental neurobiologist, Breslov studied the contours of hypercolumn connections in normal vision, in order to understand how visual images are processed. “People are used to thinking that neurons in V1 simply define local edges, and that one needs to go to higher levels of the brain in order to collect these faces and recognize more complex things like contours and surfaces. But from our work with our wife, it is clear that these structures in V1 actually allow the visual cortex to recognize the contours at an early stage and carry out more global processing. It was believed that we are processing more and more complex aspects of the image, rising higher in the hierarchy of the brain. Now it became clear that there is an active feedback between the upper and lower parts of the cortex. This is not a simple hierarchical process, but an incredibly complex and active system, which will take many years to understand. ”
Among the practical applications of this work is computer vision - computer scientists are already building structures with internal connections with which Breslov and colleagues played in building models to teach computers to define contours and textures. If you show a little imagination, you can imagine that this study will ever be able to help restore vision to people with impairments. “The question is whether it is possible to somehow stimulate a part of the visual cortex, bypassing the eye, and use this to orient the blind,” says Breslov. “If you understand how the cortex works and how it reacts to stimulation, perhaps, then it will be possible to invent a better method for its proper stimulation.”
There are even areas of application that are not related to the brain at all. Breslov applied the ideas obtained through work to other situations in which objects are located in space with a certain orientation, for example, to fibroblasts from human and animal tissues. He showed that under certain conditions, these interacting cells and molecules can line up and produce patterns similar to those that appear in V1.
People talked about seeing hallucinations, since the beginning of time, and in almost all cultures - images of hallucinations can even be found in petroglyphs and rock paintings. In the traditions of the shamans of the whole world, they are treated as messages from the world of the spirits. Few modern neuroscientists will agree with the involvement of spirits in this, but as heralds of the hidden world - this time, the hidden world of our brain - these hallucinations have not lost their capabilities.
Source: https://habr.com/ru/post/426603/
All Articles