Ten people at 90 thousand sites: how not to go crazy
Hi, my name is Vera Sivakova. I work with key partners Yandex.Cash - connect large stores and services, launch projects and travel to meetings around the world. In general, I make sure everything is fine.
Every Yandex.Money employee can change their occupation once a year - choose a department and work there for several days. Therefore, a month ago I also went to Sapsan and came to Petersburg. The monitoring department works there, which also ensures that everything is fine with 90,000 websites connected to the Cashier - and we decided to join forces.

How not to go crazy? Similarly, not so (source: reddit.com)
This is a story about how we monitor, and what I learned in a couple of days in another department.
Every second about 600 transactions go through the service and all this needs to be monitored in real time - but at what exact moment is it time to sound the alarm if something happened? We need a systematic look at everything.
Good practice is to analyze the system from the technical side and not to forget about the business metrics - the number of payments, turnover and other parameters.
In small systems there is enough of a keen eye of the main (most often and only) administrator. But when there are a lot of processes, employees cannot monitor everything manually, so the best strategy would be maximum automation. Without the expert knowledge and efforts of the team, nothing will work by itself, as monitoring is continuous improvement, analysis and the ability to select competent metrics and triggers. They will work in case of deviation from the specified conditions and report anomalies.
We distinguish three levels of monitoring, each of which has its own important indicators - the level of the system, the level of business logic and the level of counterparties.
System level
The most important thing here is round-the-clock monitoring of the infrastructure. From the tools we use Zabbix to collect data in real time - it notifies about the operation of servers and data centers, the quality of the network, the availability of components and data sources.
Monitoring IT infrastructure is a very demanding job, since failure at this level is fraught with inoperable systems and desperate measures. Therefore, it is important not only to respond to “flashing” problems, but also to analyze trends and historical data - this will allow you to warn potential points of failure in time and predict the need for scaling. The rule works for all indicators and levels of monitoring, including business.
For critical points, the trigger thresholds should be selected below. For example, in the case of an increase in response time from one router, we transfer traffic to another and eliminate the reason for the first one. This triggered a warning trigger that allows you to receive notifications of potential problems well in advance, which gives plenty of time to respond, the ability to predict changes and avoid disasters.
Business logic level
Each team determines the processes that need to be monitored, their priority and personal metrics. For example, the Cashier team has dozens of business processes, such as payment for each available method - cards, e-wallets, through online banks and terminals, mobile commerce, sending registries, etc. As the main tool for collecting and displaying data on the work of business logic, we use Graphite in conjunction with Grafana.
At this level, it is important to adhere to a systematic approach and try to move away from the binary and uninformative “works / does not work”.
For example, there is the metric “Number of successful payments by card”. If it starts flashing, it means that the workflow has decreased. In this case, it is necessary to understand what is the reason, and take into account all the components that are involved in this process. In the case of a decrease in the number of transactions, you can immediately think about the fact that there are difficulties on the side of the acquiring bank. But the graphs show that everything is fine with the availability of banks. Then it is necessary to investigate further, and in the end it will turn out, for example, that all the questions for the layout: for some reason, the “Pay” button has disappeared or it has become inactive.
Counterparty Level
Here we are talking about specific counterparties - for example, acquiring banks and merchants.
We have selected separate charts and triggers for acquirers, the availability of which we must track all the time. For us, as a payment service, stability is very important, so in the event of a failure of one of the banks, we immediately transfer the flow to the reserve.

One bank failed, but another automatically connected.
We have learned quite well and in a timely manner to redirect the workflow if errors started.
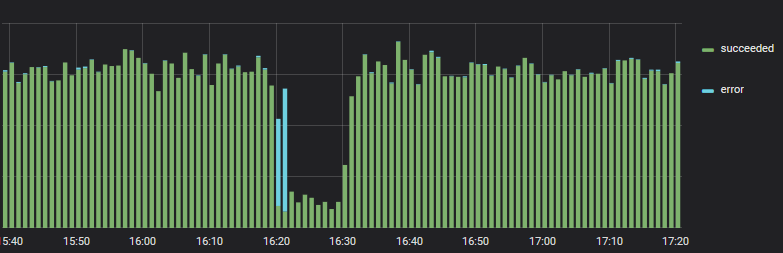
In one of the banks recorded an increase in errors when paying
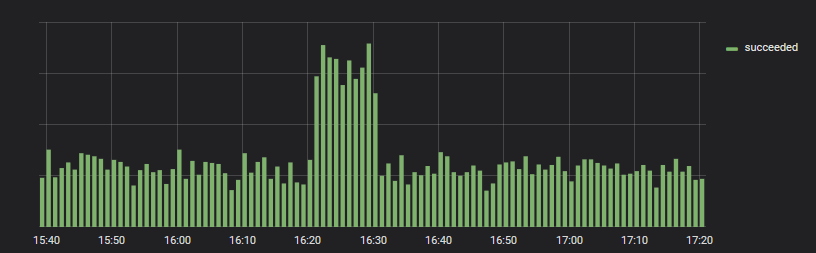
Translated - and everything is in order. Y-axis values are not comparable.
Acquiring failures can occur for a variety of reasons at the levels already described - systems and business logic. No one is immune from unforeseen problems and can not guarantee 100% availability. Also worth remembering about the planned technical work and releases, when you need to closely monitor the progress of affairs. The issue of reservation and automatic switching is critical, as simple means stopping payments for a business.
We work immediately with several banks to minimize the risks of downtime and optimize SR card payments. SR (success rate) or else conversion is a business metric that is calculated as the ratio of the number of successful payments to the total number of transactions. Different companies measure conversion in their own way: for example, someone starts to stop from the payment page, others after clicking on the "Pay" button. But in general, SR is influenced by many different factors - MSS, is there 3D-Secure in payment, geography of payers, recurrent payments or not. “Hospital average” SR cannot be determined and it is not necessary to know - in each case it will be its own value that needs to be optimized.
All the variety of errors can be divided into two large groups.
- Errors that can be prevented - for example, payment from this country is prohibited. If you are sure that this is not a fraudulent attack and you have users all over the world, then in this case it is necessary to connect the possibility of payment from cards of any issuers. This, by the way, can be done in your Yandex Cash Desk.
- Errors that cannot be affected - for example, the card is blocked. Here only reissue or attempt to repeat payment by another card within the framework of a new transaction will help.
Many choose a payment provider at a rate. In fact, the rate is not the only value to be taken into account. It is also necessary to look at the percentage of successful payments (SR) - because no one has 100% conversion and this value varies greatly from bank to bank. It is also necessary to consider how the user scenario as a whole looks like: how many steps you need to go through before payment, whether the interface is clear, etc.
How conversion affects profit
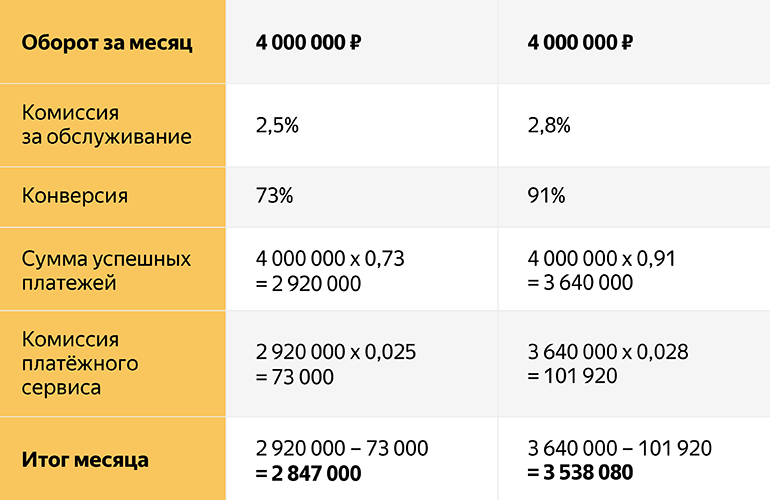
In the second case, the service fee is higher, but the conversion is also higher, because redundancy and intelligent gateway configuration are used.
As you can see from the example, it would be beneficial for a business to take a better service and, despite the fact that the commission is higher due to the difference in quality of acquiring, we end up with 3,538,080 - 2,847,000 = 691,080 rubles a month difference! And this is already 8 million a year, which is very big money for business.
Conversion, turnover and rates are conditional, but the example shows that the main thing in the service is its stability and quality. And already this entails an increased conversion and, as a result, a greater turnover for the merchant.
How to connect the merchant
As mentioned earlier, we try to maximally cover all with metrics and triggers that automatically trigger on an event. Let's analyze how everything happens on the example of monitoring one of the merchants.
After connecting to the Cashier, the merchant, if necessary, is put on monitoring. We build a graph in Grafana and set up metrics by which automatic alerts are triggered in case of deviations from the specified "normal" values.
We use Moira to send notifications to the monitoring group chat, which will promptly verify the details. The notification contains a link to the schedule and details of the incident.
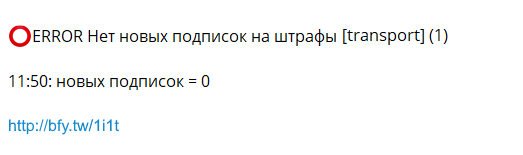
Exactly the real example of a bot message.
After analyzing the graph, a specialist monitoring team most often uses Kibana to view logs. Here the situation may be prosaic, and then the error will obviously show an error, or additional analysts will be required to analyze the reasons for the failure.
In the future, we want to set up auto-notifications of merchants about errors on their side, for example, about server unavailability or non-protocol responses. This will allow us to quickly respond to a failure and give information to counterparties to eliminate the causes.
In addition to the technical side, we also carefully look at such business metrics as turnover, income and outflow, but this seems to be a topic for the following stories.
The most important thing
My “disobedience day” (namely, this is what we call a temporary transfer to another department) ended, and I returned to Moscow. For 2 days in the monitoring department I learned a lot of new things and streamlined current knowledge.
- The task of monitoring is to provide current information on the state of the system at all levels;
- Choose literate metrics and triggers - 90% success;
- In the payment services conversion rate beats;
- You need to follow the technique and remember about business metrics;
- We need a systematic view of the processes and the ability to analyze relationships;
And more - be grateful. Monitoring guys, thanks!
That's all. Ask questions, subscribe to our blog and come to visit.
')
Source: https://habr.com/ru/post/426583/
All Articles