Build functions in the console. Part 2 (Chart)
The beginning of time

Last time I stopped at building a table of function values. It is time to go to the construction of the graph itself, for which all this, in fact, began.
')
So, the basic idea is as follows. Rotate the coordinate axis 90 degrees clockwise. This is necessary in order to simplify the construction, without storing data about each point in any sheet.
Next, we restrict the coordinate axis to 82 characters for better readability of the graphics. It is clear that at the same time we lose accuracy and the graph will be more schematic (too compressed), especially for "cool" functions, but still.
After that, we calculate the position of the x axis relative to the axis of the game, that is, we are looking for where we will have a point (x, 0). Well, and then line by line we will assign x the value of the function y1 at this point.
Go
First we need the following formula:
We will assign 80 positions to the graphics, the two remaining places will be purely decorative. With this formula we find which range of values corresponds to one position in our graph. Then we can correctly mark the current point on it.
The main ideas are marked, so let's move on to the code itself.
Including thanks to the comments for the first part, I learned about such a thing as format . It seemed to me really more comfortable than my dances with a tambourine, so a huge piece of code with the calculation of indents turned into a couple of lines
The unit is responsible for the number of the element passed as an argument to the format function, that is, it is a “link” (not literally) to the label variable, which we actually display on the screen. The numbering is exactly the same as in the sheets - from scratch.
A pair of characters :> is used to align the displayed text on the right side. Well, {0} after the > character is needed in order to determine the number of line positions you need.
That is, in this case, we reserve for the label line len (label) + dial_length positions, and the label itself occupies only len (label), and aligns the text on the right side within the collection of these positions.
these lines are equivalent
Yes, for lines it’s probably easier to use the second option, but applying the first one for general development doesn’t hurt)
In format, it is possible to push even arrays of the r_value type (in C ++), that is, those created directly by passing the argument.
We fix variables that are constant, that is, they do not depend on the current value of the function.
In python, there is no conditional const for designating constants, therefore it is customary to call such variables in capital letters and simply not to change them.
Since, for obvious reasons, RATIO cannot be equal to 0, MAX_Y1_VALUE_DIFFERENCE must be a positive number. That is why there is a second term on the right side of the assignment.
The position of the x-axis, we calculate the formula
Where does this formula come from? We simply calculate the ratio of the segments (on the axis of the game) from the beginning of the axis (min (y1)) to the current value of the function (y1 (x)) and the segment from the beginning of the axis to its end (max (y1)). Well, we multiply this ratio by 80 to find the distance from the beginning of the axis to the current value in the spaces (therefore, only whole numbers can be used), which reflect the formula-ratio on the graph.
Since we are interested in the position at y1 (x) = 0, we substitute the necessary values and voila into the formula.
Now you can proceed directly to printing values.
The cycle is already familiar to us. It is necessary to count each function value a second time in order not to store them in a sheet or something else.
The position of the game is calculated by the above formula.
We will have to fix the upper difference from the formula, considering the case when the formula will result in the form of uncertainty of zero to zero. If such uncertainty arises, it will mean that the current value of y1 (x) = max (y1), which means the current value of the game will coincide with the end of the y axis.
This part of the code is directly responsible for printing the graph itself.
Here, the format was very useful and simplified the code. ^ allows us to align the number in the center of the selected area (in this case, 12 positions). g is responsible for numbers - if they do not have a fractional part, then it will not be printed (a number as an int), otherwise - 6 decimal places
Since our graph is limited to a space of 80 characters along the y axis, on our graph the value of the function at the point will coincide with the x axis not only in the case of y1 (x) = 0, but also in the neighborhood [0 - RATIO / 2, 0 + RATIO / 2].
In total, we have three cases of the location of the asterisk (that is, the point) and the vertical stick (that is, the x axis): '* |' (y1 (x) <= 0 - RATIO / 2), '*' (0 - RATIO / 2 <y1 (x) <0 + RATIO / 2), '| *' (y1 (x)> = 0 + RATIO / 2), these three cases and we will consider.
This is if we have negative values (y1 (x) <0). If not, just type '|' and determine the position of the point.
Well, we complete the program by drawing the x axis.
So, the code that eventually turned out:
Run the program on several tests.
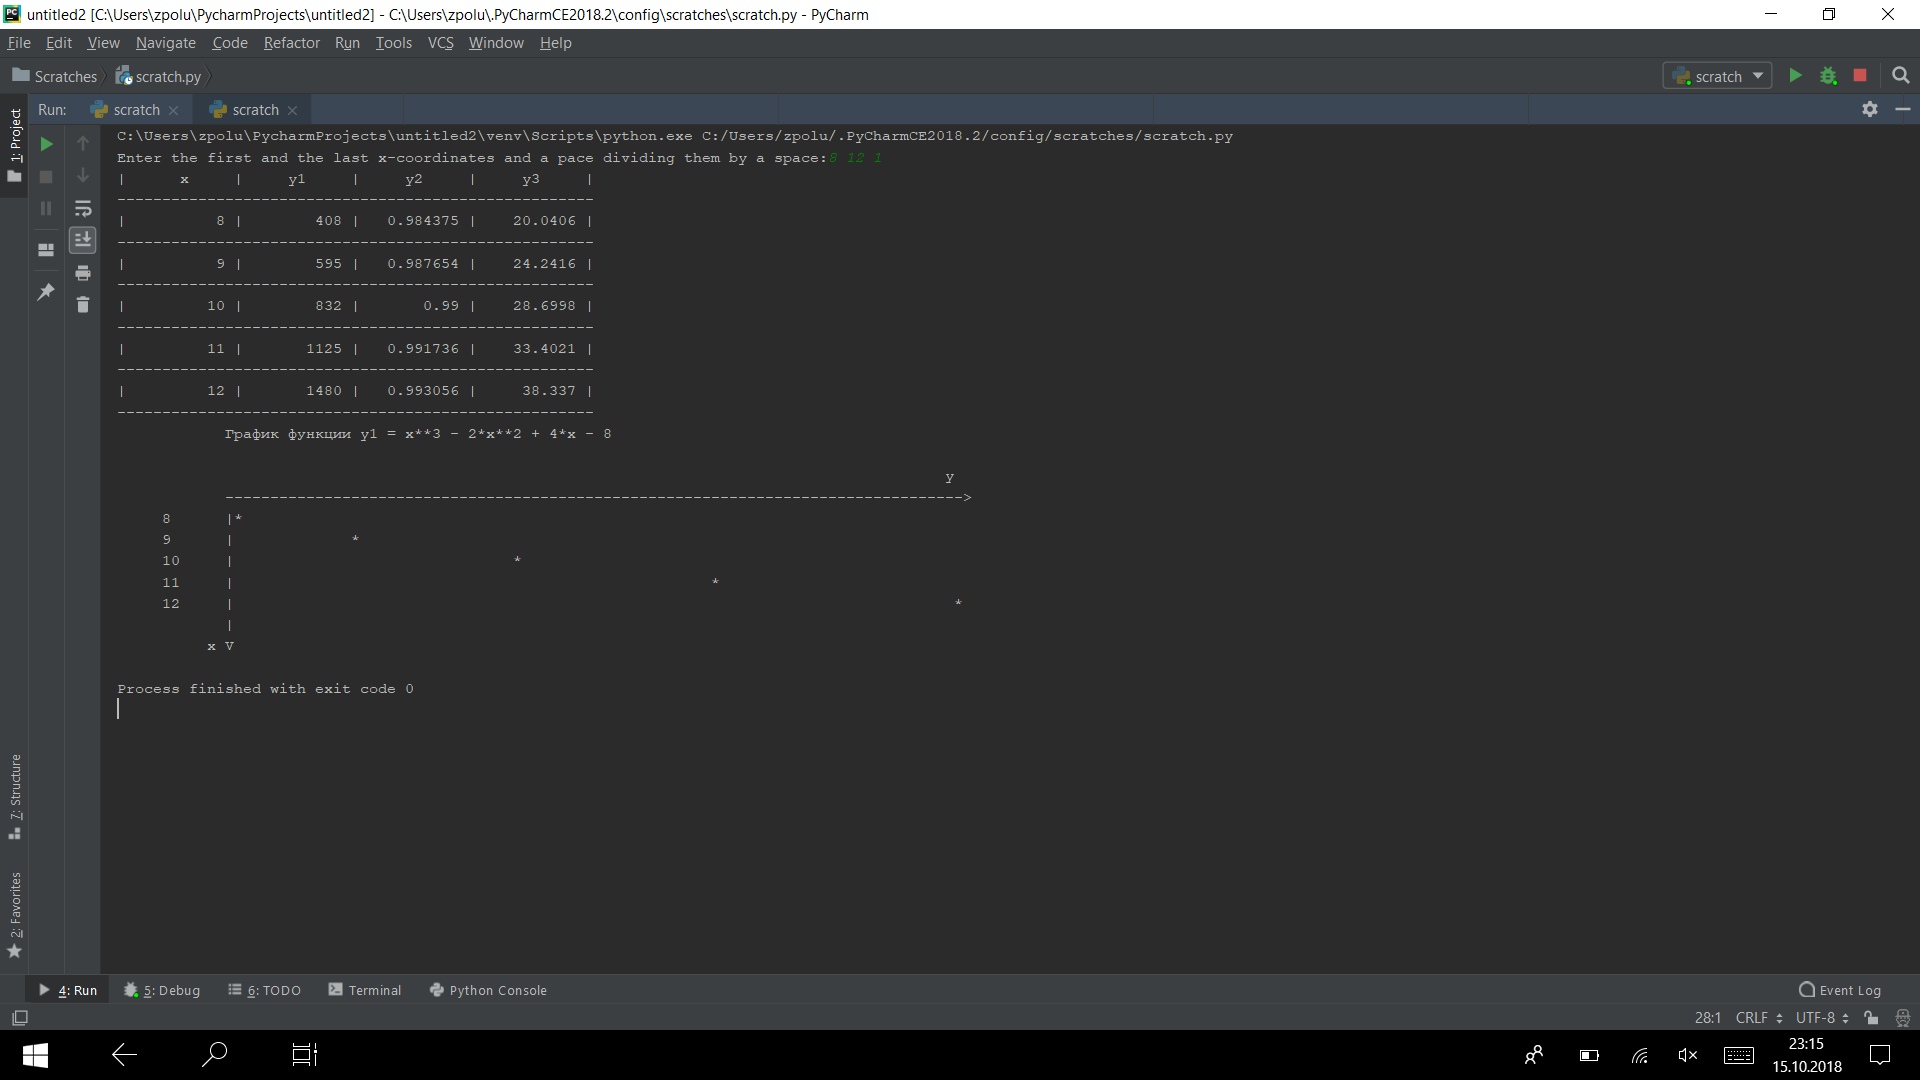

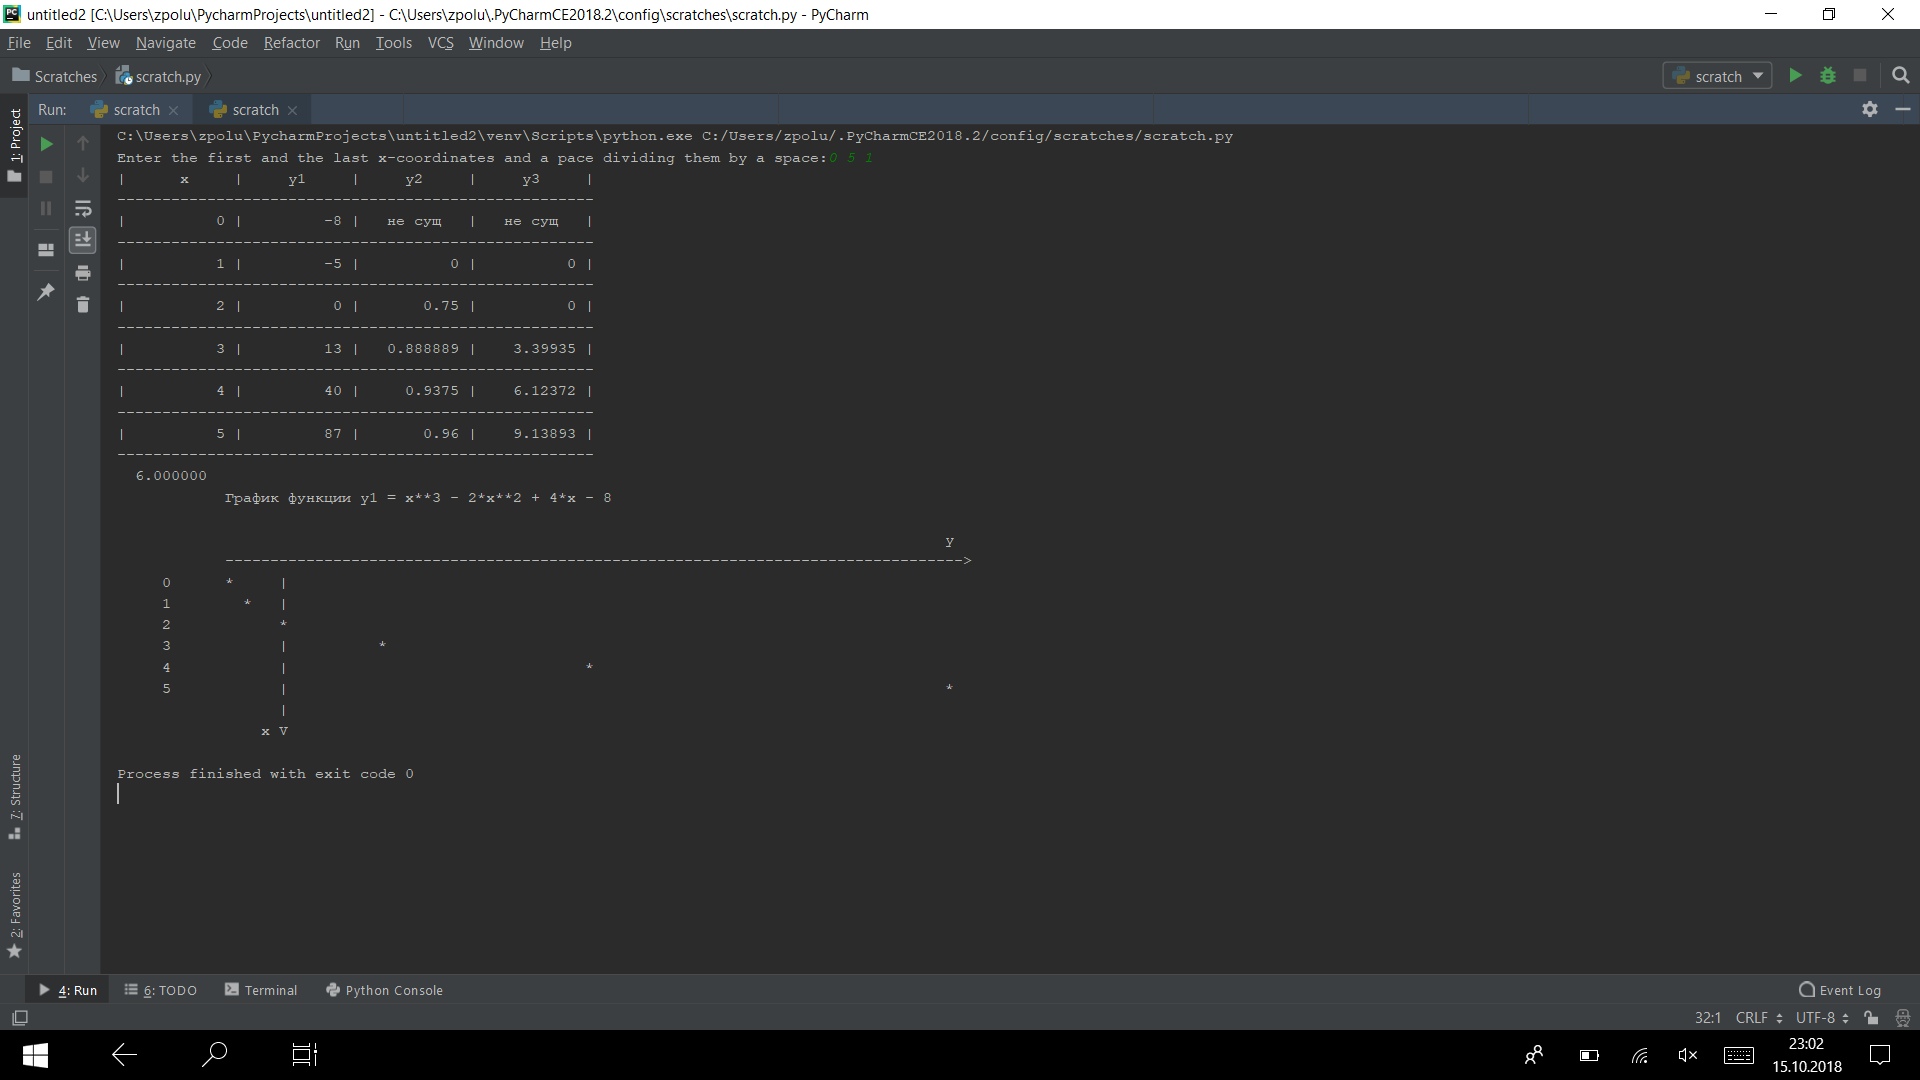
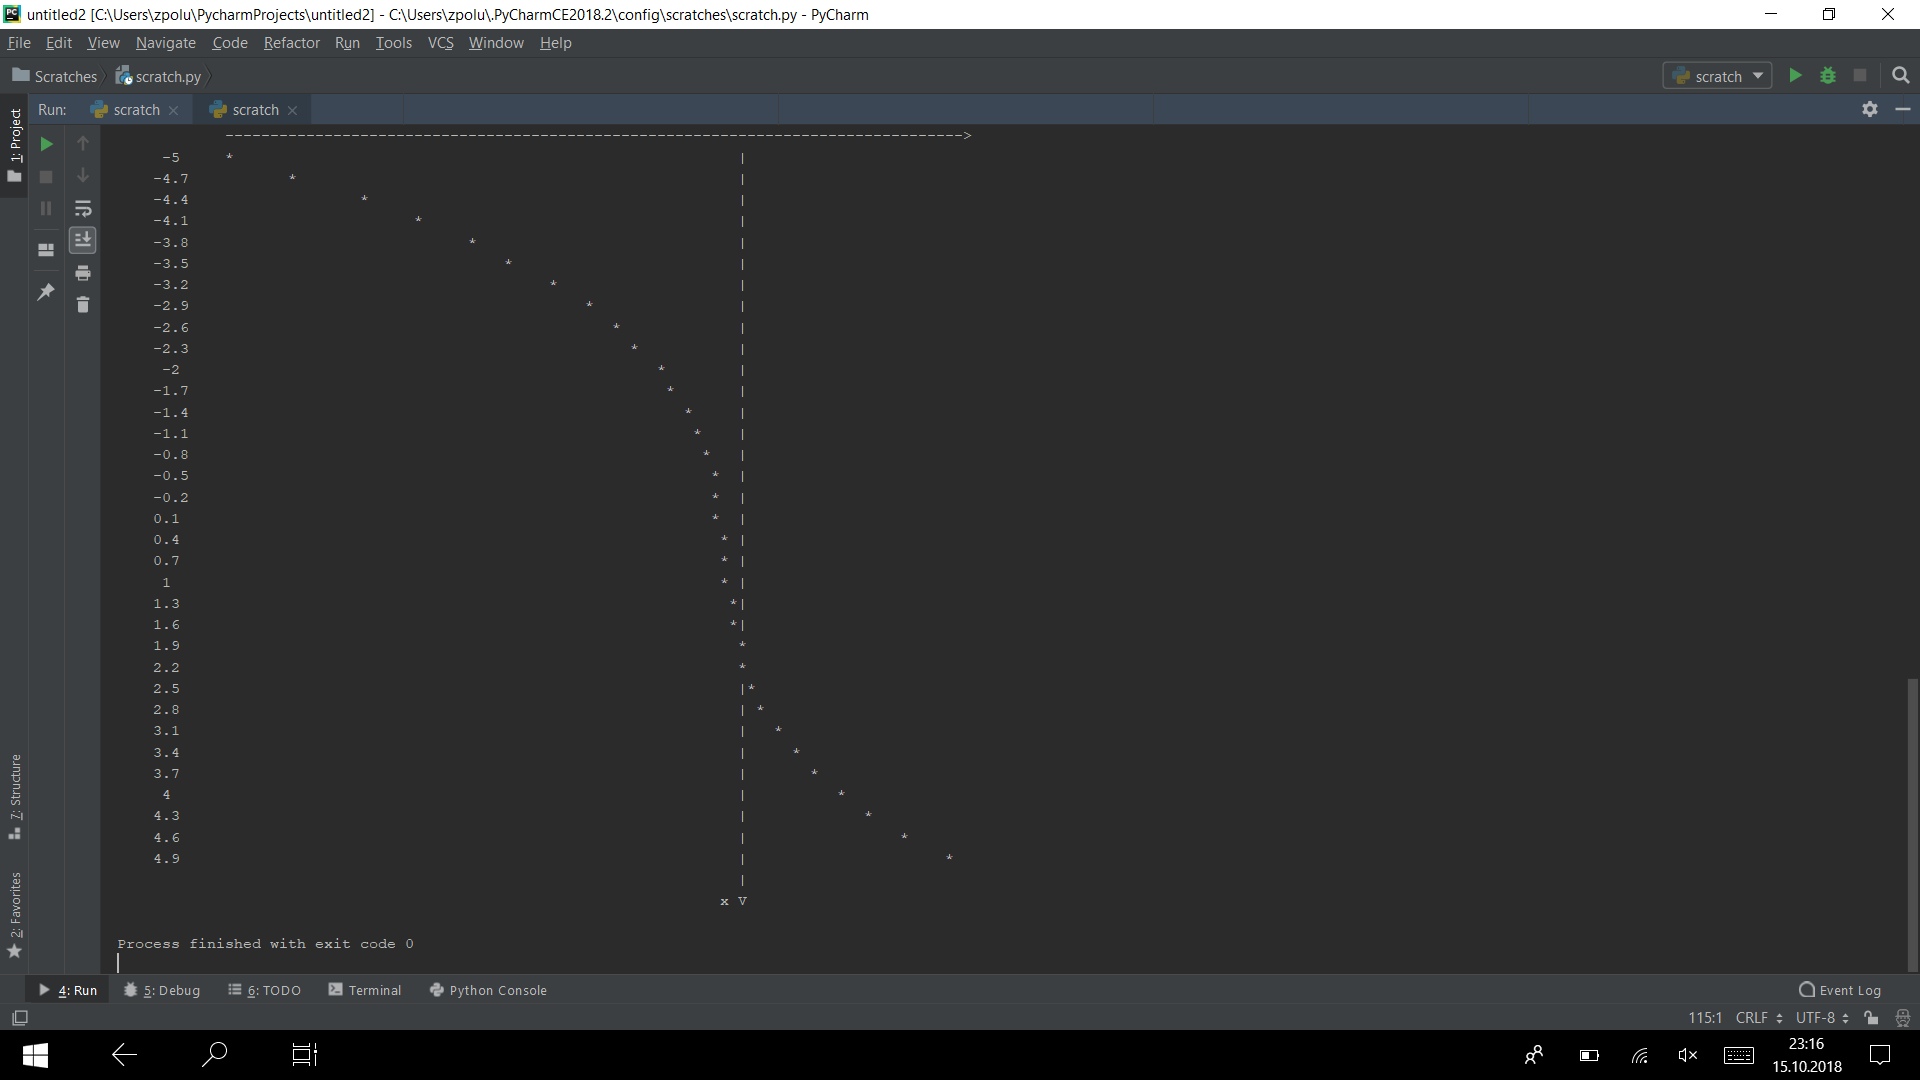
It is working)

Last time I stopped at building a table of function values. It is time to go to the construction of the graph itself, for which all this, in fact, began.
')
So, the basic idea is as follows. Rotate the coordinate axis 90 degrees clockwise. This is necessary in order to simplify the construction, without storing data about each point in any sheet.
Next, we restrict the coordinate axis to 82 characters for better readability of the graphics. It is clear that at the same time we lose accuracy and the graph will be more schematic (too compressed), especially for "cool" functions, but still.
After that, we calculate the position of the x axis relative to the axis of the game, that is, we are looking for where we will have a point (x, 0). Well, and then line by line we will assign x the value of the function y1 at this point.
Go
First we need the following formula:
We will assign 80 positions to the graphics, the two remaining places will be purely decorative. With this formula we find which range of values corresponds to one position in our graph. Then we can correctly mark the current point on it.
The main ideas are marked, so let's move on to the code itself.
dial_length = 12 label = " y1 = x**3 - 2*x**2 + 4*x - 8" print("{1:>{0}}".format(len(label) + dial_length, label), '\n') print("{aux[1]:>{aux[0]}}\n {aux[2]:>{aux[0]}}>\n".format(aux = [dial_length + 82, 'y' , 82*'-'])); Including thanks to the comments for the first part, I learned about such a thing as format . It seemed to me really more comfortable than my dances with a tambourine, so a huge piece of code with the calculation of indents turned into a couple of lines
print("{1:>{0}}".format(len(label) + dial_length, label), '\n') The unit is responsible for the number of the element passed as an argument to the format function, that is, it is a “link” (not literally) to the label variable, which we actually display on the screen. The numbering is exactly the same as in the sheets - from scratch.
A pair of characters :> is used to align the displayed text on the right side. Well, {0} after the > character is needed in order to determine the number of line positions you need.
That is, in this case, we reserve for the label line len (label) + dial_length positions, and the label itself occupies only len (label), and aligns the text on the right side within the collection of these positions.
print("{1:>{0}}".format(len(label) + dial_length, label), '\n') print(dial_length*' ' + label, '\n') these lines are equivalent
Yes, for lines it’s probably easier to use the second option, but applying the first one for general development doesn’t hurt)
print("{aux[1]:>{aux[0]}}\n {aux[2]:>{aux[0]}}>\n".format(aux = [dial_length + 82, 'y' , 82*'-'])); In format, it is possible to push even arrays of the r_value type (in C ++), that is, those created directly by passing the argument.
We fix variables that are constant, that is, they do not depend on the current value of the function.
In python, there is no conditional const for designating constants, therefore it is customary to call such variables in capital letters and simply not to change them.
MAX_Y1_VALUE_DIFFERENCE = (max_y1_value - min_y1_value) + \ (max_y1_value == min_y1_value) RATIO = MAX_Y1_VALUE_DIFFERENCE / 80 AXIS_X_POS = abs(int((- min_y1_value) / RATIO)) if (AXIS_X_POS > 80): AXIS_X_POS = 81 Since, for obvious reasons, RATIO cannot be equal to 0, MAX_Y1_VALUE_DIFFERENCE must be a positive number. That is why there is a second term on the right side of the assignment.
The position of the x-axis, we calculate the formula
Where does this formula come from? We simply calculate the ratio of the segments (on the axis of the game) from the beginning of the axis (min (y1)) to the current value of the function (y1 (x)) and the segment from the beginning of the axis to its end (max (y1)). Well, we multiply this ratio by 80 to find the distance from the beginning of the axis to the current value in the spaces (therefore, only whole numbers can be used), which reflect the formula-ratio on the graph.
Since we are interested in the position at y1 (x) = 0, we substitute the necessary values and voila into the formula.
Now you can proceed directly to printing values.
while (is_sequence_decreasing and from_x >= to_x) or \ (not is_sequence_decreasing and from_x <= to_x): y1_cur_value = y1(from_x) cur_y1_value_and_min_difference = (y1_cur_value - min_y1_value) + \ (y1_cur_value == min_y1_value) * \ ((max_y1_value == min_y1_value)) pos_of_y = int(cur_y1_value_and_min_difference * 80 / \ MAX_Y1_VALUE_DIFFERENCE) The cycle is already familiar to us. It is necessary to count each function value a second time in order not to store them in a sheet or something else.
The position of the game is calculated by the above formula.
We will have to fix the upper difference from the formula, considering the case when the formula will result in the form of uncertainty of zero to zero. If such uncertainty arises, it will mean that the current value of y1 (x) = max (y1), which means the current value of the game will coincide with the end of the y axis.
print("{1:^{0}.6g}".format(dial_length, from_x), end='') if (negative_value_exists): if y1_cur_value <= 0 - RATIO / 2: req_aux = AXIS_X_POS - pos_of_y if (req_aux != 0): print(pos_of_y * ' ' + '*' + (req_aux - 1) * ' ' + '|') else: print((AXIS_X_POS - 1) * ' ' + '*' + '|') elif y1_cur_value >= 0 + RATIO / 2: req_aux = pos_of_y - AXIS_X_POS if (req_aux != 0): print(AXIS_X_POS * ' ' + '|' + (req_aux - 1) * ' ' + '*') else: print((AXIS_X_POS) * ' ' + '|*') else: print(AXIS_X_POS * ' ' + '*') else: print('|' + pos_of_y* ' ' + '*') AXIS_X_POS = 0 from_x += pace_x print((dial_length + AXIS_X_POS) * ' ' + '|\n', (dial_length + AXIS_X_POS - 3) * ' ' + 'x V') This part of the code is directly responsible for printing the graph itself.
print("{1:^{0}.6g}".format(dial_length, from_x), end='') Here, the format was very useful and simplified the code. ^ allows us to align the number in the center of the selected area (in this case, 12 positions). g is responsible for numbers - if they do not have a fractional part, then it will not be printed (a number as an int), otherwise - 6 decimal places
Since our graph is limited to a space of 80 characters along the y axis, on our graph the value of the function at the point will coincide with the x axis not only in the case of y1 (x) = 0, but also in the neighborhood [0 - RATIO / 2, 0 + RATIO / 2].
In total, we have three cases of the location of the asterisk (that is, the point) and the vertical stick (that is, the x axis): '* |' (y1 (x) <= 0 - RATIO / 2), '*' (0 - RATIO / 2 <y1 (x) <0 + RATIO / 2), '| *' (y1 (x)> = 0 + RATIO / 2), these three cases and we will consider.
- y1 (x) <= 0 - RATIO / 2
In this case, the point is located to the x axis, so we are looking for the distance from the point to the axis in spaces. Due to the rounding of numbers, it may happen that the values of the variables AXIS_X_POS and pos_of_y may coincide. But this can not be, because in this case we would fall into the third case. In our case, the point does not coincide with the x axis, so an additional condition is necessary, which will decrease by one the variable pos_of_y in the case of equality. - y (x)> = 0 + RATIO / 2
The case is identical to the first case, only the point will be located on the other side of the x-axis and all the above actions for this are adjusted - rest
The easiest case is to simply type an asterisk in place of the axis.
This is if we have negative values (y1 (x) <0). If not, just type '|' and determine the position of the point.
Well, we complete the program by drawing the x axis.
So, the code that eventually turned out:
dial_length = 12 label = " y1 = x**3 - 2*x**2 + 4*x - 8" print("{1:^{0}.6f}".format(dial_length, x_copy)) print("{1:>{0}}".format(len(label) + dial_length, label), '\n') print("{aux[1]:>{aux[0]}}\n {aux[2]:>{aux[0]}}>\n".format(aux = [dial_length + 81, 'y' , 82*'-']), end=''); MAX_Y1_VALUE_DIFFERENCE = (max_y1_value - min_y1_value) + \ (max_y1_value == min_y1_value) RATIO = MAX_Y1_VALUE_DIFFERENCE / 80 AXIS_X_POS = abs(int((- min_y1_value) / RATIO)) if (AXIS_X_POS > 80): AXIS_X_POS = 81 while (is_sequence_decreasing and from_x >= to_x) or \ (not is_sequence_decreasing and from_x <= to_x): y1_cur_value = y1(from_x) cur_y1_value_and_min_difference = (y1_cur_value - min_y1_value) + \ (y1_cur_value == min_y1_value) * \ ((max_y1_value == min_y1_value)) pos_of_y = int(cur_y1_value_and_min_difference * 80 / \ MAX_Y1_VALUE_DIFFERENCE) print("{1:^{0}.6g}".format(dial_length, from_x), end='') if (negative_value_exists): if y1_cur_value <= 0 - RATIO / 2: req_aux = AXIS_X_POS - pos_of_y if (req_aux != 0): print(pos_of_y * ' ' + '*' + (req_aux - 1) * ' ' + '|') else: print((AXIS_X_POS - 1) * ' ' + '*' + '|') elif y1_cur_value >= 0 + RATIO / 2: req_aux = pos_of_y - AXIS_X_POS if (req_aux != 0): print(AXIS_X_POS * ' ' + '|' + (req_aux - 1) * ' ' + '*') else: print((AXIS_X_POS) * ' ' + '|*') else: print(AXIS_X_POS * ' ' + '*') else: print('|' + pos_of_y* ' ' + '*') AXIS_X_POS = 0 from_x += pace_x print((dial_length + AXIS_X_POS) * ' ' + '|\n', (dial_length + AXIS_X_POS - 3) * ' ' + 'x V') Run the program on several tests.
It is working)
Source: https://habr.com/ru/post/426519/
All Articles