Amazon Cloud Services and Investment Portfolio Analysis
Recently, there has been high volatility in stock markets, when, for example, a stable paper of a well-known company can lose several percent at once on the news of sanctions against its leadership or, on the contrary, fly to the skies on a positive report and investors' expectations about super-profit dividends.
How to determine whether the ownership of this security brought in income or only loss and disappointment?
 (A source)
')
In this article I will tell you how to determine and visualize the adjusted financial result for securities.
Using the example of Client Reporting Opening Broker, we consider parsing and consolidating brokerage reports for the stock market, building a cloud reporting system architecture followed by simple and convenient analysis in AWS Quicksight.
Many trainings and training lessons tell us about the need to maintain a trading journal, which records all the parameters of the transaction for further analysis and summarizing the work of the trading strategy. I agree that such an approach to work on the Exchange allows you to discipline a trader, to increase his awareness, but it can also be great to tire out the tedious process.
I admit, at first I tried carefully to follow the advice of keeping a journal, meticulously wrote down every transaction with its parameters in an Excel spreadsheet, built some reports, summary diagrams, planned future deals, but ... I quickly got tired of it all.
Often, brokerage companies are high-tech organizations that provide their clients with fairly high-quality analytics on virtually all issues of interest. It is fair to say that with each update this reporting gets better and better, but even the most advanced of them may not have the customization and consolidation that demanding and inquisitive customers want to see.
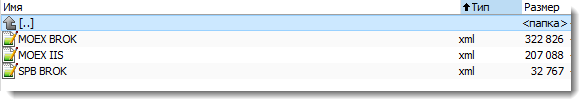
For example, Opening Broker allows you to receive brokerage reports in XML format in your account, but if you have an IIS and a normal brokerage account on the Moscow Stock Exchange (MOEX), these will be two different reports, and if you still have an account on St. Petersburg Petersburg Stock Exchange (SPB), then one more will be added to the first two.
So, to get a consolidated investor log, you will need to process three files in XML format.
The above reports on MOEX and SPB differ slightly in their formats, which will need to be taken into account in the implementation of the data mapping.
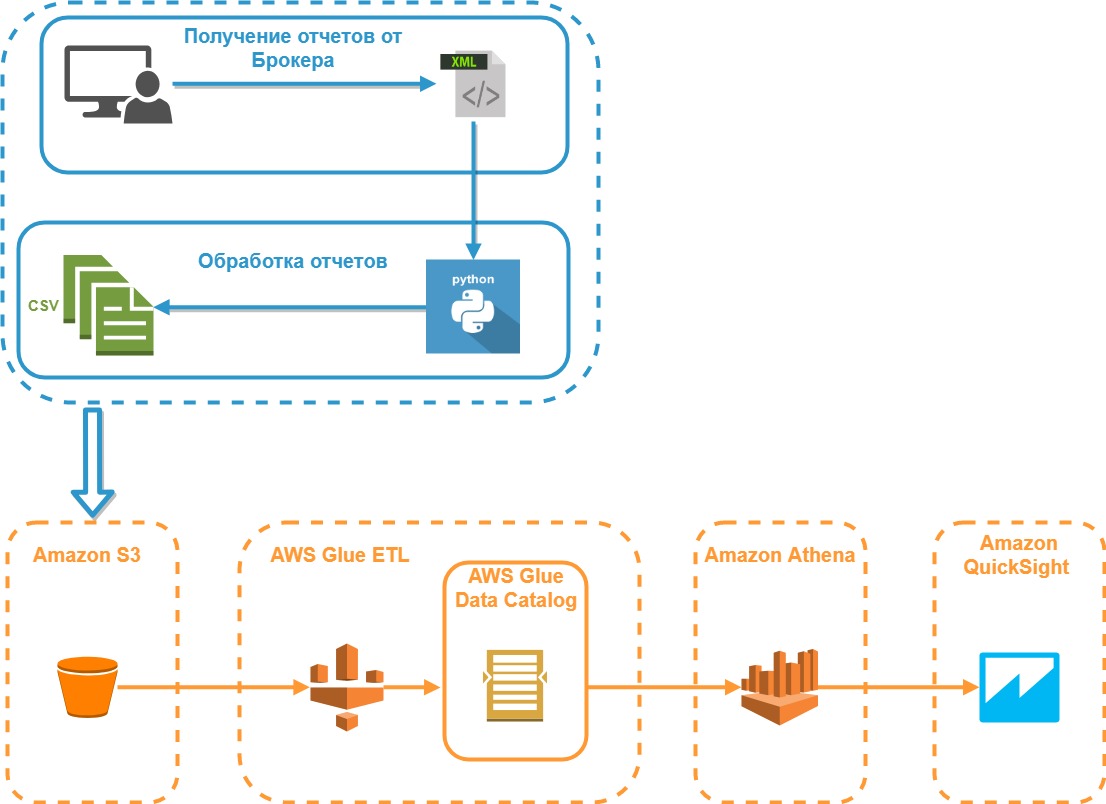
The diagram below shows the architecture model of the system being developed:
We will receive reports on all three accounts in the My Account for the maximum possible period (can be divided into several reports for each year), save them in XML format and put them in one folder. As a test data for the study, we will use a fictional client portfolio, but with the most approximate parameters to market realities.
Suppose that the investor Mr. X we are considering has a small portfolio of five securities:
According to our five papers, there may be buy / sell transactions, dividend and coupon payments, prices may change, etc. We want to see the current situation, namely: the financial result, taking into account all payments, transactions and current market value.
And here comes Python, we read information from all reports into one array:
A few words about what these dictionaries are.
We process an array of XML documents and fill these dictionaries with the appropriate data:
All processing is looped through all the XML data from the reports. Information about the trading platform, client code is the same in all reports, so you can safely extract it from the same tags without using mapping.
But then you have to apply a special construction that will provide the necessary alias for the tag based on the report (SPB or MOEX), since the same data in these reports are called differently.
The get_allias function returns the name of the required tag for processing, taking as input the name of the trading platform:
The function get_briefcase is responsible for processing information about the state of the client portfolio:
Further, using the get_deals function, information about transactions is extracted:
In addition to processing an array with information about the parameters of the transaction, it also calculates the average price of an open position and the PNL realized by the FIFO method. Responsible for this calculation is the PnlSnapshot class, for the creation of which, with minor modifications, the code presented here is taken as the basis: P & L calculation
And finally, the most difficult to implement - the function of obtaining information about non-trading operations - get_nontrade_operation . Its complexity lies in the fact that in the report block used for non-trading operations, there is no clear information about the type of operation and the security to which this operation is linked.
Accordingly, it will be difficult to do without regular expressions, therefore we will use them to the full. The other side of the question is that the name of the company does not always coincide with the name in the portfolio or in the transactions. Therefore, the received name of the issuer from the purpose of payment should be additionally correlated with the dictionary. As a dictionary, we will use an array of transactions, since There is the most comprehensive list of companies.
The function get_company_from_str extracts the name of the issuer from the comment:
The function get_company_from_briefcase brings the name of the company to the dictionary, if it finds a match among the companies that participated in the transactions:
And finally, the final data collection function for non-trading operations is get_nontrade_operation :
The result of collecting data from reports will be three DataFrame, which are approximately the following:
So, all we have to do is perform the external merging of the table of transactions with the table of information about the portfolio:
And, finally, the final part of the data array processing is the merging of the data array obtained at the previous step with the DataFrame for non-trade transactions.
The result of the work done is one large flat table with all the necessary information for the analysis:
The resulting data set (Final Report) from the DataFrame is easily downloaded to CSV and can then be used for detailed analysis in any BI system.
Progress does not stand still, and now cloud services and serverless computing models are gaining great popularity in processing and storing data. This is largely due to the simplicity and cheapness of this approach, when building an architecture for complex computing or processing big data does not require buying expensive equipment, and you only rent power for the cloud you need and deploy the necessary resources quickly enough for a relatively small fee. .
One of the largest and most well-known cloud technology providers on the market is Amazon. Consider the example of the Amazon Web Services (AWS) environment, building an analytical system for processing data on our investment portfolio.
AWS has an extensive selection of tools, but we will use the following:
With Amazon's documentation, everything is in order, in particular, there is a good article Best Practices When Using Athens with AWS Glue , which describes how to create and use tables and data using AWS Glue. Let us and we will use the main ideas of this article and apply them to create our own architecture of the analytical reporting system.
CSV files prepared by our report parser will be added to the S3 bucket. It is planned that the corresponding folder on S3 will be replenished every Saturday - at the end of the trading week, so we can not do without data partitioning by the date of the formation and processing of the report.
In addition to optimizing the work of SQL queries to such data, this approach will allow us to conduct additional analysis, for example, to obtain the dynamics of changes in the financial result for each paper, etc.
Consider the generated table in more detail.
If you click on the name of the created table, we will go to the page with the description of the metadata. At the bottom there is a table diagram and the most recent is a column that was not in the original CSV file - date_report. Glue creates this AWS column automatically based on the definition of the source data sections (in the S3 batch, we specifically named folders - date_report = YYYY-MM-DD, which made it possible to use them as partitions divided by date).
Having at our disposal downloaded processed data, we can easily proceed to their analysis. First, let's look at the features of Amazon Athena as the easiest and fastest way to perform analytical queries. To do this, go to the Amazon Athena service, select the database we need (financial) and write the following SQL code:
This query will give us the net financial result for each paper for all reporting dates. Since we have downloaded the same report three times for different dates, and the result will not change, which, of course, in the real market conditions will be different:
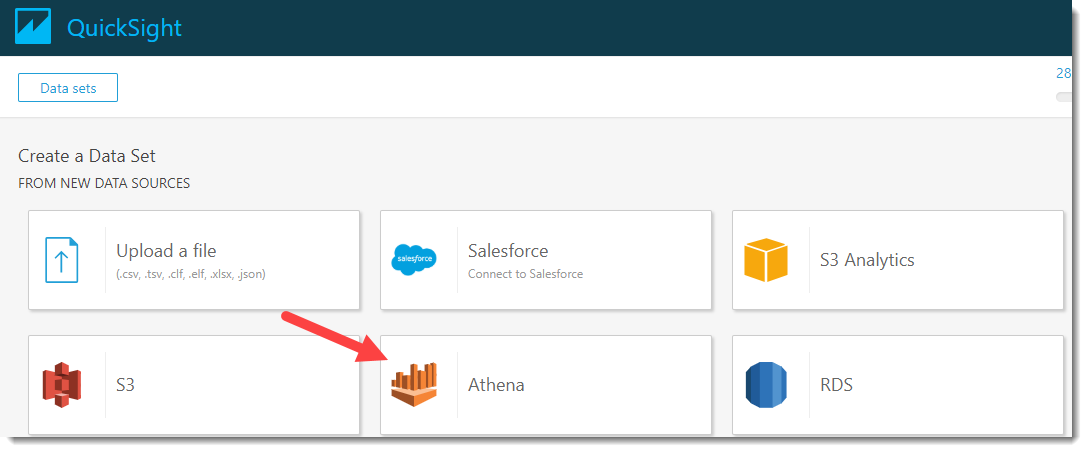
But what if we want to visualize the data in the form of flexible tables or charts? This is where Amazon QuickSight comes to the rescue, with which you can set up flexible analytics almost as quickly as writing a SQL query. Let's go to Amazon QuickSight (if you haven't registered there yet, then registration is required).
Click on the button New analyses -> New dataset and in the appeared source selection window for dataset, click on Athena:
We will invent a name for our data source, for example, “PNL_analysis” and click on the “Create data source” button.
Next, the Choose your table window will open, where you need to select a database and a data source table. Choose a database - financial, and a table in it: my_traider_diary. By default, the entire table is used, but when “Use custom SQL” is selected, you can customize and fine-tune the data selection you need. For example, let's use the entire table and click on the Edit / Preview Data button.
A new page will open where you can make additional settings and process the available data.
Now it is necessary to add additional calculated fields to our dataset: quarter and year of the operation. An attentive reader may notice that such manipulations were easier to do on the side of the parser before saving the Final Report to CSV. Undoubtedly, my goal now is to demonstrate the capabilities and flexibility of setting up a BI system on the fly. Continue the creation of calculated fields by clicking on the "New field" button.
To select the year of the operation and the quarter, simple formulas are used:

When the calculated fields are successfully created and added to the sample, we give the name to our dataset, for example, “my_pnl_analyze” and click on the “Save and visualize” button.
After that, we transfer to the main Amazon QuickSight board and the first thing we need to do is set up a filter for the report date (taking into account that the same data was collected from three sections). Select the key date 2018-10-01 and click on the Apply button and go to the Visualize tab.
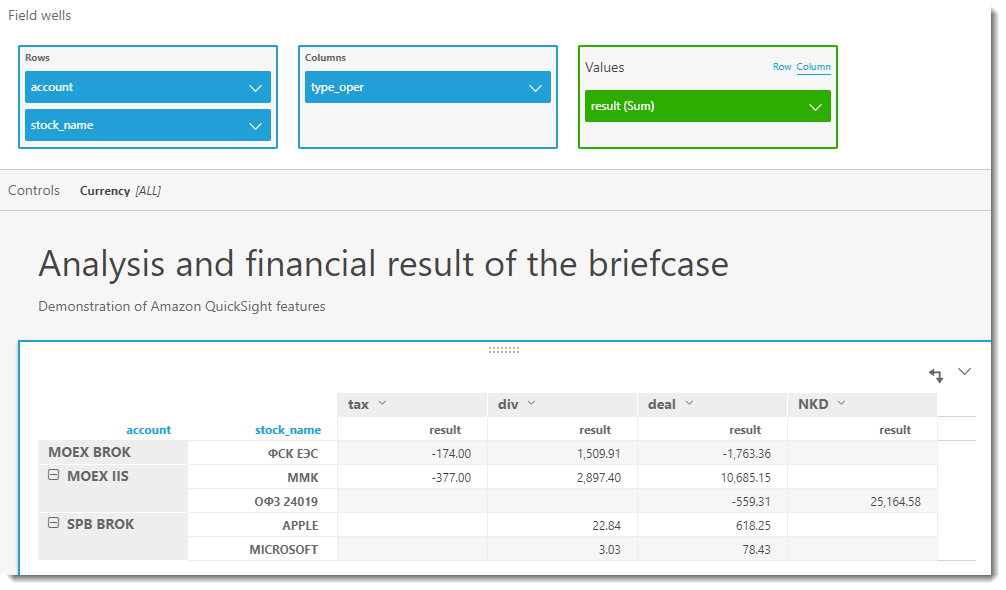
Now we can visualize the result for a portfolio in any plane, for example, for each security within a trading account, and divided in turn by currency (since the result is not comparable in different currencies) and types of transactions. Let's start with the most powerful tool of any BI - pivot tables. To save space and display flexibility, I rendered currencies into a separate control (analogue of the slice in MS Excel)
The following graph is a bar graph:
And now we will create a table that will show us how much we have invested in each paper, how many days it is in our portfolio and what is the yield for the entire period of ownership. To do this, add two new calculated fields: sum_investment and count_days.
The final table is shown in the screenshot below:
We have reviewed with you the implementation of the report parser and how to analyze the data prepared by it “on the fly” using Amazon services. They also touched upon some business and fundamental aspects of the analysis of the investment portfolio, since this topic is almost immense and it is quite difficult to fit it in one article, I think it makes sense to put it in a separate publication or even a cycle of publications.
As regards the use of the broker's report processing tool and the approaches and algorithms involved in it, they can be used (with a corresponding modification) for processing reports of other Brokers. In any case, if you are thinking of adapting the code to your needs, I am ready to give some tips, so do not hesitate to ask questions - I will definitely try to answer them.
I am sure that this system will find its application and will have further development. For example, it is planned to add to the calculation of the full PNL portfolio for accounting for depository and other commissions (for example, withdrawal of funds), as well as redemption of bonds, etc ... The calculated fields on the Quicksight side were used for the demonstration purpose, all these additional columns will be transferred to Python and will be calculated on the side of the parser.
As an architect and main business customer of this solution, I see further modernization as follows: well, I don’t want to manually manually request these XML reports every time! Of course, there is no other possibility so far, but the Broker's API with the transfer of a token and a sampling range would be ideal for weekly receiving raw reports. The subsequent complete automatic processing on the Amazon side: from triggering an ETL-job on AWS Glue to getting finished results in the form of graphs and tables in Amazon QuickSight will allow you to fully automate the process.
The full source code can be found in my GitHub repository.
How to determine whether the ownership of this security brought in income or only loss and disappointment?
')
In this article I will tell you how to determine and visualize the adjusted financial result for securities.
Using the example of Client Reporting Opening Broker, we consider parsing and consolidating brokerage reports for the stock market, building a cloud reporting system architecture followed by simple and convenient analysis in AWS Quicksight.
Task Description
Many trainings and training lessons tell us about the need to maintain a trading journal, which records all the parameters of the transaction for further analysis and summarizing the work of the trading strategy. I agree that such an approach to work on the Exchange allows you to discipline a trader, to increase his awareness, but it can also be great to tire out the tedious process.
I admit, at first I tried carefully to follow the advice of keeping a journal, meticulously wrote down every transaction with its parameters in an Excel spreadsheet, built some reports, summary diagrams, planned future deals, but ... I quickly got tired of it all.
Why keeping a trader's manual journal is inconvenient?
- manual filling of the journal (even using partial automation, in the form of unloading transactions from the trading terminal for the day) quickly tires;
- there is a high risk of errors or typographical errors during manual input;
- it may happen that the active trader becomes a passive investor and he returns to this magazine less and less, and then forgets about him at all (my case); well finally
- we can program, why not take advantage of this and not automate the whole process? So, drove!
Often, brokerage companies are high-tech organizations that provide their clients with fairly high-quality analytics on virtually all issues of interest. It is fair to say that with each update this reporting gets better and better, but even the most advanced of them may not have the customization and consolidation that demanding and inquisitive customers want to see.
For example, Opening Broker allows you to receive brokerage reports in XML format in your account, but if you have an IIS and a normal brokerage account on the Moscow Stock Exchange (MOEX), these will be two different reports, and if you still have an account on St. Petersburg Petersburg Stock Exchange (SPB), then one more will be added to the first two.
So, to get a consolidated investor log, you will need to process three files in XML format.
The above reports on MOEX and SPB differ slightly in their formats, which will need to be taken into account in the implementation of the data mapping.
The architecture of the developed system
The diagram below shows the architecture model of the system being developed:
Parser implementation
We will receive reports on all three accounts in the My Account for the maximum possible period (can be divided into several reports for each year), save them in XML format and put them in one folder. As a test data for the study, we will use a fictional client portfolio, but with the most approximate parameters to market realities.
Suppose that the investor Mr. X we are considering has a small portfolio of five securities:
- The report on the stock exchange SPB will be two papers: Apple and Microsoft;
- In the report on the stock exchange MOEX (brokerage) one paper: FGC UES;
- The report on the stock exchange MOEX (IIS) two papers: MMK and OFZ 24019;
According to our five papers, there may be buy / sell transactions, dividend and coupon payments, prices may change, etc. We want to see the current situation, namely: the financial result, taking into account all payments, transactions and current market value.
And here comes Python, we read information from all reports into one array:
my_files_list = [join('Data/', f) for f in listdir('Data/') if isfile(join('Data/', f))] my_xml_data = [] # for f in my_files_list: tree = ET.parse(f) root = tree.getroot() my_xml_data.append(root) For analytics, we need several entities from the reports, namely:In order to prepare the sample, we will use four dictionaries to describe the above sets.
- Positions of securities in the portfolio;
- Concluded transactions;
- Non-trading operations and other movements on the account;
- Average prices of open positions
dict_stocks = {'stock_name': [], 'account': [], 'currency': [], 'current_cost': [], 'current_cost_rub': [], 'saldo' : []} dict_deals = {'stock_name': [], 'account': [], 'date_oper': [], 'type_oper': [], 'quantity': [], 'price': [], 'currency': [], 'brokerage': [], 'result': []} dict_flows = {'stock_name': [], 'account': [], 'date_oper': [], 'type_oper': [], 'result': [], 'currency': []} dict_avg_price = {'stock_name': [], 'account': [], 'avg_open_price' : []} A few words about what these dictionaries are.
Dictionary dict_stocks
The dict_stocks dictionary is needed to store general information on a portfolio:
- Paper name (stock_name);
- Account name (SPB, MOEX BROK, MOEX IIS) (account);
- The currency used to settle this paper (currency);
- Current value (at the time of the report in the Personal Account Opening Broker) (current_cost). Here I want to note that for demanding customers, in the future, you can make additional refinement and use dynamic receipt of a security quotation from the trading terminal or from the website of the corresponding stock exchange;
- The current value of the position of the security at the time of reporting (current_cost_rub)
Similar to the above item, here you can also receive the current rate of the Central Bank or the exchange rate, as you like. - Current balance of securities (saldo)
Dictionary dict_deals
The dict_deals dictionary is needed to store the following information on completed transactions:
- Paper name (stock_name);
- Account name (SPB, MOEX BROK, MOEX IIS) (account);
- The date of the transaction, i.e. T0 (date_oper);
- Type of operation (type_oper);
- The volume of securities involved in the transaction (quantity);
- The price at which the transaction was executed (price);
- The currency in which the operation was performed (currency);
- Brokerage commission for the transaction (brokerage);
- Financial result of the transaction (result)
Dict_flows dictionary
The dict_flows dictionary reflects the movement of funds in a client account and is used to store the following information:
- Paper name (stock_name);
- Account name (SPB, MOEX BROK, MOEX IIS) (account);
- The date of the transaction, i.e. T0 (date_oper);
- Type of operation (type_oper). It can take several values: div, NKD, tax;
- The currency in which the operation was performed (currency);
- Financial result of the operation (result)
Dictionary dict_avg_price
The dict_avg_price dictionary is required to account for information on the average purchase price for each paper:
- Paper name (stock_name);
- Account name (SPB, MOEX BROK, MOEX IIS) (account);
- Average open position price (avg_open_price)
We process an array of XML documents and fill these dictionaries with the appropriate data:
# for XMLdata in my_xml_data: # exchange_name = 'SPB' if XMLdata.get('board_list') == ' ' else 'MOEX' client_code = XMLdata.get('client_code') account_name = get_account_name(exchange_name, client_code) # current_position, deals, flows, stock_name, \ saldo, ticketdate, price, brokerage, \ operationdate, currency, \ current_cost, current_cost_rub, \ stock_name_deal, payment_currency, currency_flows = get_allias(exchange_name) # get_briefcase(XMLdata) df_stocks = pd.DataFrame(dict_stocks) df_stocks.set_index("stock_name", drop = False, inplace = True) # get_deals(XMLdata) df_deals = pd.DataFrame(dict_deals) df_avg = pd.DataFrame(dict_avg_price) # get_nontrade_operation(XMLdata) df_flows = pd.DataFrame(dict_flows) All processing is looped through all the XML data from the reports. Information about the trading platform, client code is the same in all reports, so you can safely extract it from the same tags without using mapping.
But then you have to apply a special construction that will provide the necessary alias for the tag based on the report (SPB or MOEX), since the same data in these reports are called differently.
Discrepancies in tags
- The broker's transaction commission in the SBP report is in the brokerage tag, and in the MOEX report - broker_commission ;
- The date of the non-trading account transaction in the SPB report is the operationdate , and in MOEX the operation_date , etc.
Sample Tag Mapping
tags_mapping = { 'SPB': { 'current_position': 'briefcase_position', 'deals': 'closed_deal', 'flows': 'nontrade_money_operation', ... 'stock_name_deal': 'issuername', 'paymentcurrency': 'paymentcurrency', 'currency_flows': 'currencycode' }, 'MOEX': { 'current_position': 'spot_assets', 'deals': 'spot_main_deals_conclusion', 'flows': 'spot_non_trade_money_operations', ... 'stock_name_deal': 'security_name', 'paymentcurrency': 'price_currency_code', 'currency_flows': 'currency_code' } } The get_allias function returns the name of the required tag for processing, taking as input the name of the trading platform:
Get_allias function
def get_allias(exchange_name): return( tags_mapping[exchange_name]['current_position'], tags_mapping[exchange_name]['deals'], tags_mapping[exchange_name]['flows'], ... tags_mapping[exchange_name]['stock_name_deal'], tags_mapping[exchange_name]['paymentcurrency'], tags_mapping[exchange_name]['currency_flows'] ) The function get_briefcase is responsible for processing information about the state of the client portfolio:
Get_briefcase function
def get_briefcase(XMLdata): # briefcase_position briefcase_position = XMLdata.find(current_position) if not briefcase_position: return try: for child in briefcase_position: stock_name_reduce = child.get(stock_name).upper() stock_name_reduce = re.sub('[,\.]|(\s?INC)|(\s+$)|([-\s]?)', '', stock_name_reduce) dict_stocks['stock_name'].append(stock_name_reduce) dict_stocks['account'].append(account_name) dict_stocks['currency'].append(child.get(currency)) dict_stocks['current_cost'].append(float(child.get(current_cost))) dict_stocks['current_cost_rub'].append(float(child.get(current_cost_rub))) dict_stocks['saldo'].append(float(child.get(saldo))) except Exception as e: print('get_briefcase --> Oops! It seems we have a BUG!', e) Further, using the get_deals function, information about transactions is extracted:
Get_deals function
def get_deals(XMLdata): stock_name_proc = '' closed_deal = XMLdata.find(deals) if not closed_deal: return # SPB - , # MOEX: , # : if exchange_name == 'SPB': sortchildrenby(closed_deal, stock_name_deal) for child in closed_deal: sortchildrenby(child, stock_name_deal) try: for child in closed_deal: stock_name_reduce = child.get(stock_name_deal).upper() stock_name_reduce = re.sub('[,\.]|(\s?INC)|(\s+$)|([-\s]?)', '', stock_name_reduce) dict_deals['stock_name'].append(stock_name_reduce) dict_deals['account'].append(account_name) dict_deals['date_oper'].append(to_dt(child.get(ticketdate)).strftime('%Y-%m-%d')) current_cost = get_current_cost(stock_name_reduce) # SPB - quantity, # MOEX : buy_qnty sell_qnty if exchange_name == 'MOEX': if child.get('buy_qnty'): quantity = float(child.get('buy_qnty')) else: quantity = - float(child.get('sell_qnty')) else: quantity = float(child.get('quantity')) dict_deals['quantity'].append(quantity) dict_deals['price'].append(float(child.get('price'))) dict_deals['type_oper'].append('deal') dict_deals['currency'].append(child.get(payment_currency)) brok_comm = child.get(brokerage) if brok_comm is None: brok_comm = 0 else: brok_comm = float(brok_comm) dict_deals['brokerage'].append(float(brok_comm)) # if stock_name_proc != stock_name_reduce: if stock_name_proc != '': put_avr_price_in_df(account_name, stock_name_proc, \ pnl.m_net_position, pnl.m_avg_open_price) current_cost = get_current_cost(stock_name_proc) pnl.update_by_marketdata(current_cost) if len(dict_deals['result']) > 0: if exchange_name != 'SPB': dict_deals['result'][-1] = pnl.m_unrealized_pnl * 0.87 -dict_deals['brokerage'][-2] else: dict_deals['result'][-1] = pnl.m_unrealized_pnl - dict_deals['brokerage'][-2] stock_name_proc = stock_name_reduce pnl = PnlSnapshot(stock_name_proc, float(child.get('price')), quantity) dict_deals['result'].append(-1 * brok_comm) else: pnl.update_by_tradefeed(float(child.get('price')), quantity) # , if quantity < 0: if pnl.m_realized_pnl > 0 and exchange_name != 'SPB': pnl_sum = pnl.m_realized_pnl * 0.87 - brok_comm else: pnl_sum = pnl.m_realized_pnl - brok_comm dict_deals['result'].append(float(pnl_sum)) else: pnl.update_by_marketdata(current_cost) dict_deals['result'].append(-1 * brok_comm) put_avr_price_in_df(account_name, stock_name_proc, \ pnl.m_net_position, pnl.m_avg_open_price) current_cost = get_current_cost(stock_name_proc) pnl.update_by_marketdata(current_cost) if len(dict_deals['result']) > 0: if exchange_name != 'SPB': dict_deals['result'][-1] = pnl.m_unrealized_pnl * 0.87 -dict_deals['brokerage'][-2] else: dict_deals['result'][-1] = pnl.m_unrealized_pnl - dict_deals['brokerage'][-2] except Exception as e: print('get_deals --> Oops! It seems we have a BUG!', e) In addition to processing an array with information about the parameters of the transaction, it also calculates the average price of an open position and the PNL realized by the FIFO method. Responsible for this calculation is the PnlSnapshot class, for the creation of which, with minor modifications, the code presented here is taken as the basis: P & L calculation
And finally, the most difficult to implement - the function of obtaining information about non-trading operations - get_nontrade_operation . Its complexity lies in the fact that in the report block used for non-trading operations, there is no clear information about the type of operation and the security to which this operation is linked.
Example of payment purposes for non-trading operations
Payment of dividends or accrued coupon income may be indicated as follows:
- Payment of client income <777777> dividends < APPLE INC-ao> -> payment of dividends from the SPB report;
- Payment of client income <777777> dividends < MICROSOFT COM-ao>
- Payment of client income 777777i (NKD 2 OFZ 24019 ) withholding tax 0.00 rubles -> coupon payment from the MOEX report;
- Payment of client income 777777 dividends of FGC UES - ao tax to withholding XX.XX rubles -> payment of dividends from the MOEX report. etc.
Accordingly, it will be difficult to do without regular expressions, therefore we will use them to the full. The other side of the question is that the name of the company does not always coincide with the name in the portfolio or in the transactions. Therefore, the received name of the issuer from the purpose of payment should be additionally correlated with the dictionary. As a dictionary, we will use an array of transactions, since There is the most comprehensive list of companies.
The function get_company_from_str extracts the name of the issuer from the comment:
Get_company_from_str function
def get_company_from_str(comment): company_name = '' # / flows_pattern = [ '^.+\s<(\w+)?.+->$', '^.+\s(.+)-.+$', '^.+\(\s\d?\s(.+)\).+$', '^.+\s(.+)-.+$' ] for pattern in flows_pattern: match = re.search(pattern, comment) if match: return match.group(1).upper() return company_name The function get_company_from_briefcase brings the name of the company to the dictionary, if it finds a match among the companies that participated in the transactions:
Get_company_from_briefcase function
def get_company_from_briefcase(company_name): company_name_full = None value_from_dic = df_deals[df_deals['stock_name'].str.contains(company_name)] company_arr = value_from_dic['stock_name'].unique() if len(company_arr) == 1: company_name_full = company_arr[0] return company_name_full And finally, the final data collection function for non-trading operations is get_nontrade_operation :
Get_nontrade_operation function
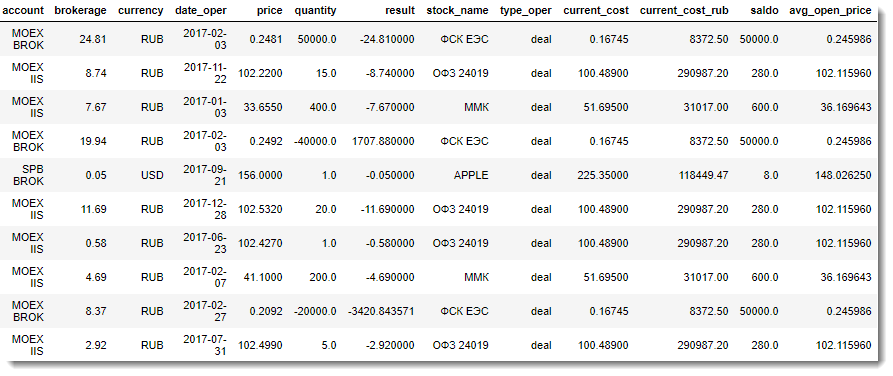
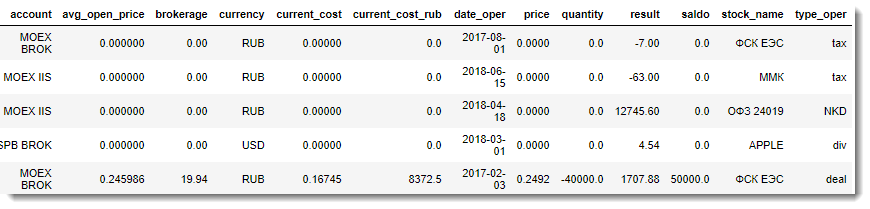
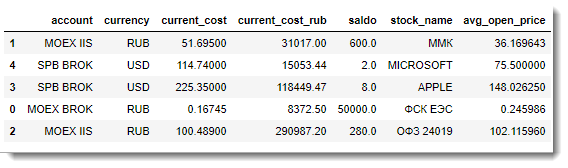
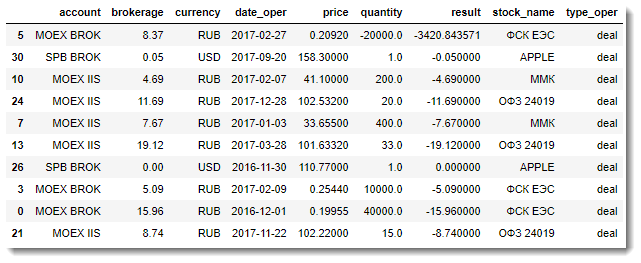
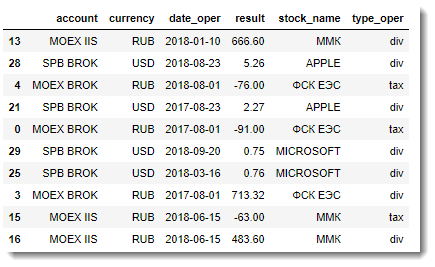
def get_nontrade_operation(XMLdata): nontrade_money_operation = XMLdata.find(flows) if not nontrade_money_operation: return try: for child in nontrade_money_operation: comment = child.get('comment') type_oper_match = re.search('||^.+.+.+$', comment) if type_oper_match: company_name = get_company_from_str(comment) type_oper = get_type_oper(comment) dict_flows['stock_name'].append(company_name) dict_flows['account'].append(account_name) dict_flows['date_oper'].append(to_dt(child.get(operationdate)).strftime('%Y-%m-%d')) dict_flows['type_oper'].append(type_oper) dict_flows['result'].append(float(child.get('amount'))) dict_flows['currency'].append(child.get(currency_flows)) except Exception as e: print('get_nontrade_operation --> Oops! It seems we have a BUG!', e) The result of collecting data from reports will be three DataFrame, which are approximately the following:
- DataFrame with information on average prices of open positions:
- Transaction Information DataFrame:
- DataFrame with information about non-trading operations:
So, all we have to do is perform the external merging of the table of transactions with the table of information about the portfolio:
df_result = pd.merge(df_deals, df_stocks_avg, how='outer', on=['stock_name', 'account', 'currency']).fillna(0) df_result.sample(10) And, finally, the final part of the data array processing is the merging of the data array obtained at the previous step with the DataFrame for non-trade transactions.
The result of the work done is one large flat table with all the necessary information for the analysis:
df_result_full = df_result.append(df_flows, ignore_index=True).fillna(0) df_result_full.sample(10).head() The resulting data set (Final Report) from the DataFrame is easily downloaded to CSV and can then be used for detailed analysis in any BI system.
if not exists('OUTPUT'): makedirs('OUTPUT') report_name = 'OUTPUT\my_trader_diary.csv' df_result_full.to_csv(report_name, index = False, encoding='utf-8-sig') Loading and processing data in AWS
Progress does not stand still, and now cloud services and serverless computing models are gaining great popularity in processing and storing data. This is largely due to the simplicity and cheapness of this approach, when building an architecture for complex computing or processing big data does not require buying expensive equipment, and you only rent power for the cloud you need and deploy the necessary resources quickly enough for a relatively small fee. .
One of the largest and most well-known cloud technology providers on the market is Amazon. Consider the example of the Amazon Web Services (AWS) environment, building an analytical system for processing data on our investment portfolio.
AWS has an extensive selection of tools, but we will use the following:
- Amazon S3 - object storage, which allows you to store almost unlimited amounts of information;
- AWS Glue is the most powerful ETL cloud service that can itself determine the structure and generate the ETL code from the given source data;
- Amazon Athena is a serverless online SQL query service that allows you to quickly analyze data from S3 without much preparation. He also has access to the metadata that AWS Glue prepares, which makes it possible to access the data immediately after passing the ETL;
- Amazon QuickSight is a serverless BI service, you can build any visualization, analytical reports on the fly, etc.
With Amazon's documentation, everything is in order, in particular, there is a good article Best Practices When Using Athens with AWS Glue , which describes how to create and use tables and data using AWS Glue. Let us and we will use the main ideas of this article and apply them to create our own architecture of the analytical reporting system.
CSV files prepared by our report parser will be added to the S3 bucket. It is planned that the corresponding folder on S3 will be replenished every Saturday - at the end of the trading week, so we can not do without data partitioning by the date of the formation and processing of the report.
In addition to optimizing the work of SQL queries to such data, this approach will allow us to conduct additional analysis, for example, to obtain the dynamics of changes in the financial result for each paper, etc.
Work with Amazon S3
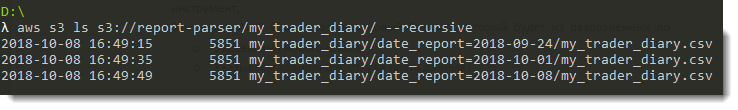
- Create a bake on S3, let's call it “report-parser”;
- In this report-parser batch we will create a folder called my_trader_diary;
- In the “my_trader_diary” directory, create a directory with the current report date, for example, “date_report = 2018-10-01” and place a CSV file in it;
- Just for the sake of experiment and a better understanding of sectioning, we will create two more directories: "date_report = 2018-09-27" and "date_report = 2018-10-08". In them we put the same CSV file;
- The final S3 bakery “report-parser” should look like the one shown in the pictures below:
Work with AWS Glue
By and large, you can get by just Amazon Athena to create an external table from the data lying on S3, but AWS Glue is a more flexible and convenient tool for this.
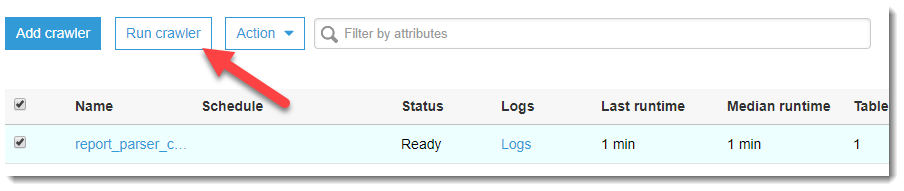
- We go to AWS Glue and create a new Crawler, which will be from a separate CSV files for the reporting dates to collect one table:
- Set the name of the new Crawler;
- Specify the repository where to get the data from (s3: // report-parser / my_trader_diary /)
- Choose or create a new IAM role that will have access to launch the Crawler and access to the specified resource on S3;
- Next, you need to set the start frequency. For now, we put on demand, but in the future, I think this will change and the launch will be weekly;
- Save and wait for the Crawler to be created.
- When the Crawler enters the Ready state, launch it!
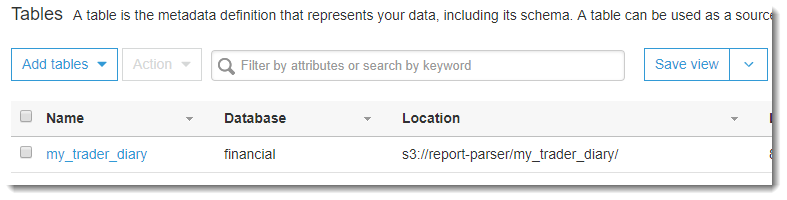
- Once it’s done, a new my_trader_diary table will appear in the AWS Glue: Database -> Tables tab:
Consider the generated table in more detail.
If you click on the name of the created table, we will go to the page with the description of the metadata. At the bottom there is a table diagram and the most recent is a column that was not in the original CSV file - date_report. Glue creates this AWS column automatically based on the definition of the source data sections (in the S3 batch, we specifically named folders - date_report = YYYY-MM-DD, which made it possible to use them as partitions divided by date).
Table partitioning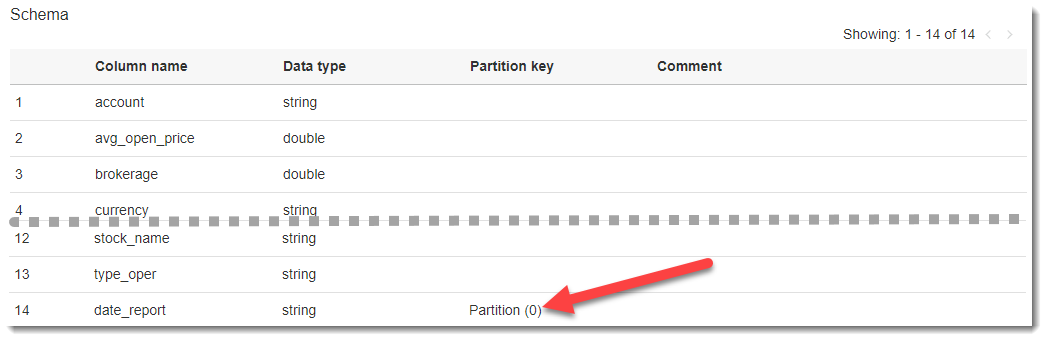
On the same page in the upper right corner there is a button View partitions, by clicking on which we can see which sections our formed table consists of:
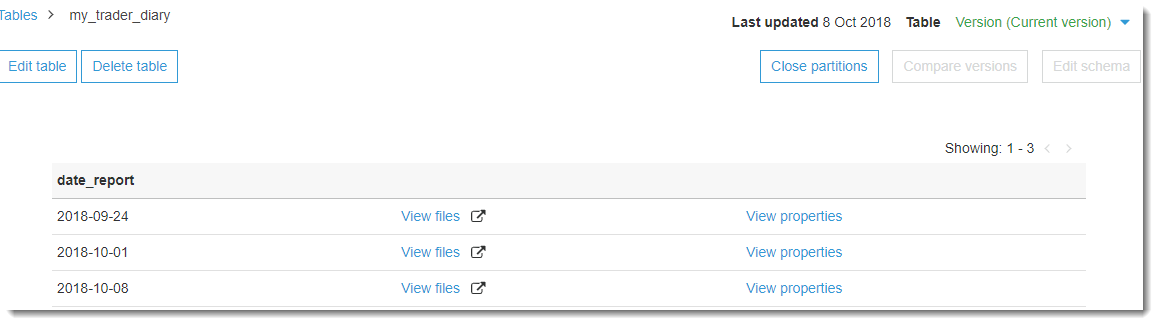
On the same page in the upper right corner there is a button View partitions, by clicking on which we can see which sections our formed table consists of:
Data analysis
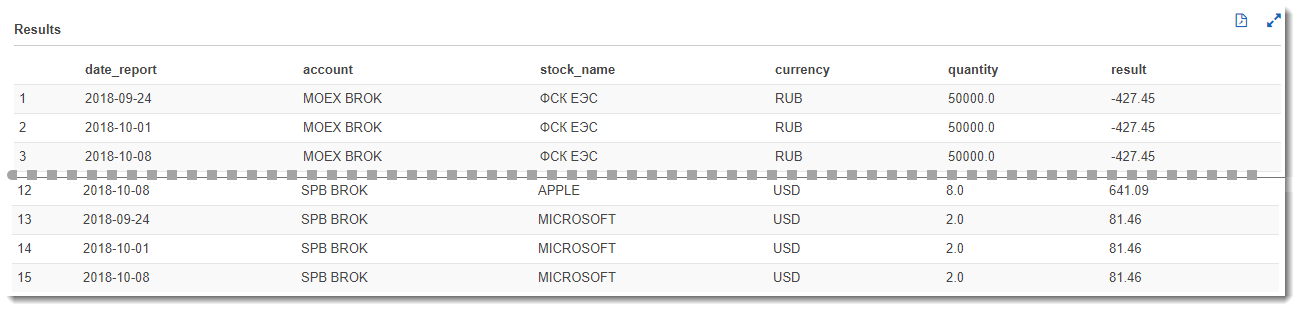
Having at our disposal downloaded processed data, we can easily proceed to their analysis. First, let's look at the features of Amazon Athena as the easiest and fastest way to perform analytical queries. To do this, go to the Amazon Athena service, select the database we need (financial) and write the following SQL code:
select d.date_report, d.account, d.stock_name, d.currency, sum(d.quantity) as quantity, round(sum(d.result), 2) as result from my_trader_diary d group by d.date_report, d.account, d.stock_name, d.currency order by d.account, d.stock_name, d.date_report; This query will give us the net financial result for each paper for all reporting dates. Since we have downloaded the same report three times for different dates, and the result will not change, which, of course, in the real market conditions will be different:
But what if we want to visualize the data in the form of flexible tables or charts? This is where Amazon QuickSight comes to the rescue, with which you can set up flexible analytics almost as quickly as writing a SQL query. Let's go to Amazon QuickSight (if you haven't registered there yet, then registration is required).
Click on the button New analyses -> New dataset and in the appeared source selection window for dataset, click on Athena:
We will invent a name for our data source, for example, “PNL_analysis” and click on the “Create data source” button.
Next, the Choose your table window will open, where you need to select a database and a data source table. Choose a database - financial, and a table in it: my_traider_diary. By default, the entire table is used, but when “Use custom SQL” is selected, you can customize and fine-tune the data selection you need. For example, let's use the entire table and click on the Edit / Preview Data button.
A new page will open where you can make additional settings and process the available data.
Now it is necessary to add additional calculated fields to our dataset: quarter and year of the operation. An attentive reader may notice that such manipulations were easier to do on the side of the parser before saving the Final Report to CSV. Undoubtedly, my goal now is to demonstrate the capabilities and flexibility of setting up a BI system on the fly. Continue the creation of calculated fields by clicking on the "New field" button.
Creating a new field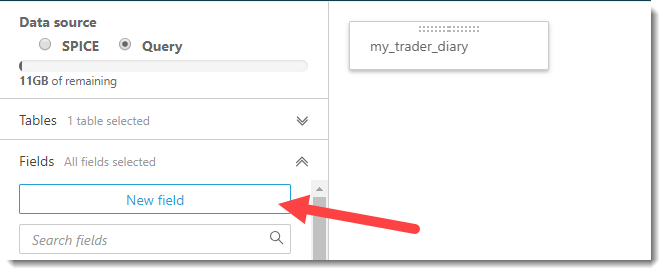
To select the year of the operation and the quarter, simple formulas are used:
Filling the formulas for the new field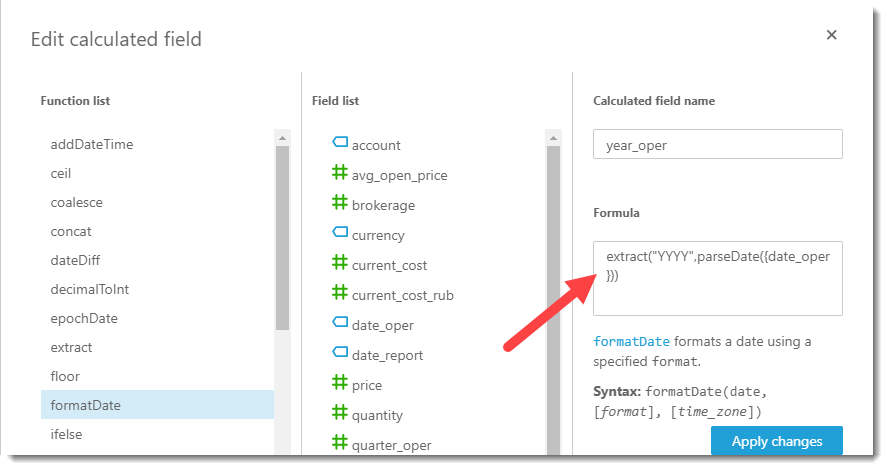
When the calculated fields are successfully created and added to the sample, we give the name to our dataset, for example, “my_pnl_analyze” and click on the “Save and visualize” button.
After that, we transfer to the main Amazon QuickSight board and the first thing we need to do is set up a filter for the report date (taking into account that the same data was collected from three sections). Select the key date 2018-10-01 and click on the Apply button and go to the Visualize tab.
Filter installation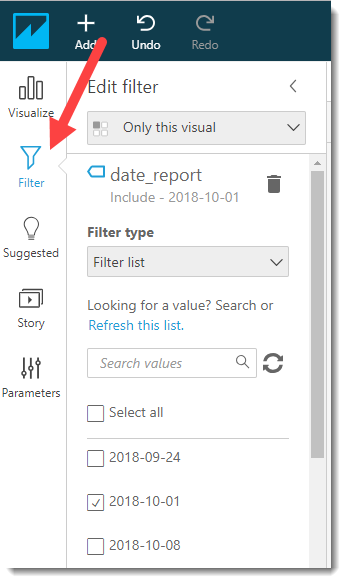
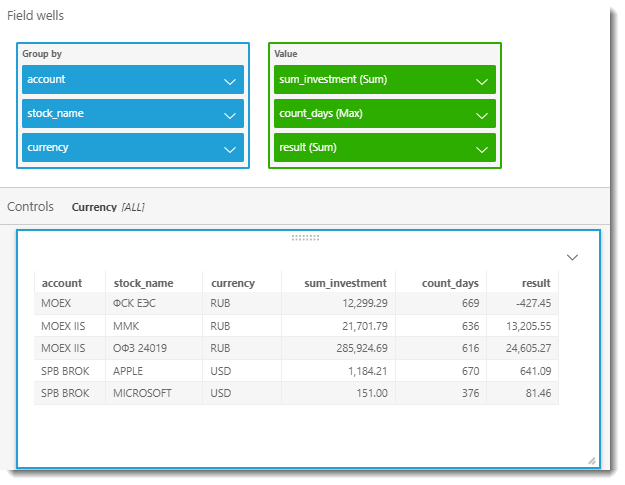
Now we can visualize the result for a portfolio in any plane, for example, for each security within a trading account, and divided in turn by currency (since the result is not comparable in different currencies) and types of transactions. Let's start with the most powerful tool of any BI - pivot tables. To save space and display flexibility, I rendered currencies into a separate control (analogue of the slice in MS Excel)
The table above shows that if an investor decides to sell all shares of FGC UES now, he will thereby fix the loss, since dividends paid in the amount of 1 509.91 p. do not cover its costs (1 763.36 p. - negative exchange difference and 174 p. - NDFL for dividends). It makes sense to wait and wait for the best times on the Exchange.
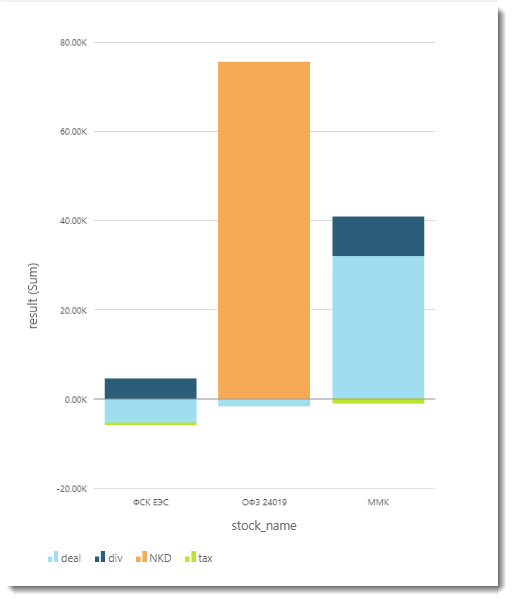
The following graph is a bar graph:
And now we will create a table that will show us how much we have invested in each paper, how many days it is in our portfolio and what is the yield for the entire period of ownership. To do this, add two new calculated fields: sum_investment and count_days.
Field sum_investment
sum_investment ( ) :
ifelse({stock_name} = ' 24019',{avg_open_price} * quantity * 10,{avg_open_price} * quantity)
, – ( – 1000).
ifelse({stock_name} = ' 24019',{avg_open_price} * quantity * 10,{avg_open_price} * quantity)
, – ( – 1000).
Count_days field
count_day ( ) :
dateDiff(parseDate({date_oper}),parseDate({date_report}))
dateDiff(parseDate({date_oper}),parseDate({date_report}))
The final table is shown in the screenshot below:
Conclusions and summary
We have reviewed with you the implementation of the report parser and how to analyze the data prepared by it “on the fly” using Amazon services. They also touched upon some business and fundamental aspects of the analysis of the investment portfolio, since this topic is almost immense and it is quite difficult to fit it in one article, I think it makes sense to put it in a separate publication or even a cycle of publications.
As regards the use of the broker's report processing tool and the approaches and algorithms involved in it, they can be used (with a corresponding modification) for processing reports of other Brokers. In any case, if you are thinking of adapting the code to your needs, I am ready to give some tips, so do not hesitate to ask questions - I will definitely try to answer them.
I am sure that this system will find its application and will have further development. For example, it is planned to add to the calculation of the full PNL portfolio for accounting for depository and other commissions (for example, withdrawal of funds), as well as redemption of bonds, etc ... The calculated fields on the Quicksight side were used for the demonstration purpose, all these additional columns will be transferred to Python and will be calculated on the side of the parser.
As an architect and main business customer of this solution, I see further modernization as follows: well, I don’t want to manually manually request these XML reports every time! Of course, there is no other possibility so far, but the Broker's API with the transfer of a token and a sampling range would be ideal for weekly receiving raw reports. The subsequent complete automatic processing on the Amazon side: from triggering an ETL-job on AWS Glue to getting finished results in the form of graphs and tables in Amazon QuickSight will allow you to fully automate the process.
The full source code can be found in my GitHub repository.
Source: https://habr.com/ru/post/426027/
All Articles