How we built the S3 DataLine repository. Experiments, testing and a little about hippos

Hello again, Alexey Pristavko is in touch, and this is the second part of my story about the object S3 DataLine storage based on the Cloudian HyperStore.
Today I will talk in detail about how our S3 storage is arranged and what difficulties we encountered in the process of its creation. Be sure to touch the "iron" theme and analyze the equipment on which we eventually stopped.
')
Go!
If during the reading you have a desire to familiarize yourself with the application architecture of the Cloudian solution, you will find its detailed analysis in the previous article . There we discussed in detail the internal structure of Cloudian, resiliency and the logic of the built-in SDS.
Summary diagram of physical equipment
As the following discussion focuses on our “agonies of choice,” I will immediately give the final list of iron to which we arrived. A small disclaimer: the choice of network equipment was largely due to its presence in our (by the way, very good) stock.
So, at the physical storage level, we have the following equipment:
| Name | Function | Configuration | Qty |
| Lenovo System x3650 M5 server | Working node | 1x Xeon E5-2630v4 2.2GHz, 4x 16GB DDR4, 14x 10TB 7.2K 6Gbps SATA 3.5 ", 2x 480GB SSD, Intel x520 Dual Port 10GbE SFP +, 2x750W HS PSU | four |
| HP ProLiant DL360 G9 Server | Load balancer node | 2 E5-2620 v3, 128G RAM, 2 600GB SSD, 4 SAS HDD, Intel x520 Dual Port 10GbE SFP + | 2 |
| Cisco C4500 Switch | Border gateway | Catalyst WS-C4500X-16SFP + | 2 |
| Cisco C3750 Switch | Port extender | Catalyst WS-C3750X-24T with C3KX-NM-10G | 2 |
| Cisco C2960 Switch | control plane | Catalyst WS-C2960 + 48PST-L | one |
For a better understanding of the architecture, we will in turn analyze all the elements and talk about their features and tasks.
Let's start with the servers. Lenovo servers have a special configuration, made jointly and in full compliance with the recommendations and specifications of Cloudian. For example, they use a controller with the function of direct access to the disks. Since in our case, RAID is organized at the level of application software, this mode increases reliability and speeds up the operation of the disk subsystem. Exactly the same servers can be purchased as a Cloudian Appliance along with all licenses.
Load balancer servers with Nginx under CentOS ensure uniform load balancing on working nodes and abstract the user from internal traffic organization. And as a nice bonus - if necessary, they will be able to organize a cache.
The Cisco 4500X pair on sixteen 10GB SFP + serves as the core and border of our small but proud storage network. Of course, iron is a bit old-fashioned, but not inferior to the “new” in reliability, it has internal redundancy, and its functionality meets all our requirements. C3750 play the role of factory extender, there is no need to push 1G transceivers into 10G slots. And to switch completely to 10GB links also doesn't make much sense yet. As the tests showed, we run into the processor and disks earlier.
The diagram below illustrates in some detail the physical organization I described:
 1. Scheme of the physical organization of the repository
Let's go through the scheme. As you can see, physical fault tolerance is implemented by duplicating and connecting each device with at least two optical links, one for each device in a pair. This gives us a guarantee of preserving physical connectivity in the circuit in the event of an accident of any network device or simultaneously two devices from different pairs.
Go below the scheme. Both pairs of Cisco (4500/4500, 3750/3750) are combined into a single logical device using the stack and VSS. The stack is assembled with two stack cables, VSS through three 10G optical links. This makes it possible to ensure that both devices in each pair interact as a unit. Such clustering allows us to work within one transparent L2-segment through both devices of a pair and make a general link aggregation using LACP, since this technology is natively supported by both server OS and Cisco IOS. On the server side, it looks as if it works with one switch instead of two, and an aggregated double capacity channel is available in the application above.
All network switching between each other and the incoming channels is made using 10G optical links, the server equipment is connected using Cisco 10G Twinax cables and 1G copper.
BGP is used for fault tolerance on the incoming channel, Round Robin DNS is used for balancing between external IP addresses. The external addresses themselves are parked on server load balancers and, if necessary, migrate between nodes using the Pacemaker / Corosync bundle.
Monitoring and control over IPMI is carried out via a direct internal link. All management interfaces (both servers and Cisco) are connected through separate control plane switches. They, in turn, are included in the data center management network. This guarantees us the impossibility of loss of communication with the equipment during work or as a result of an accident on the external network. In the most extreme case, there are attendants with KVM.
Logical network
To understand how the logical network S3 of the DataLine repository is structured, we turn to another scheme:
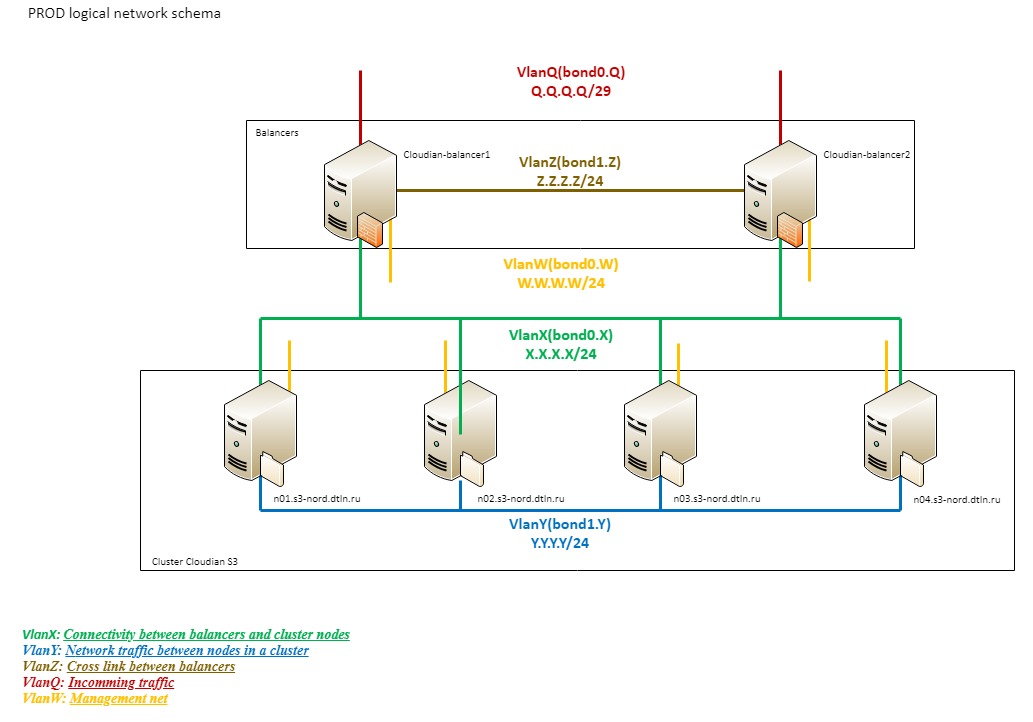
2. Scheme of storage logical network
As you can see, the network logic consists of several segments.
The external network (Q) with a total capacity of 20G is connected directly to the Provider Edge. This is followed by the Cisco 4500 and balancers.
The next logical block (X) is the VLAN between the balancers and the working nodes. From the side of the balancers the same connection is used as for the incoming traffic. The working nodes are connected via a stack of 3750 with 4 1G links (two for each 3750). All physical links are collected into a single logical also using LACP. This network is used only for processing client traffic.
All connections within the Cloudian (Y) cluster go through the third logical segment, built on top of 10G. Such an organization helps to avoid problems on the external channel due to internal traffic and vice versa. This segment is extremely heavy and important for the work of the cluster. It is through it that data and metadata are replicated, it is used by any rebalancing procedures, etc., therefore we have identified its “unsinkability” as a separate task.
Little beauty
This is how everything in the collection looks like:

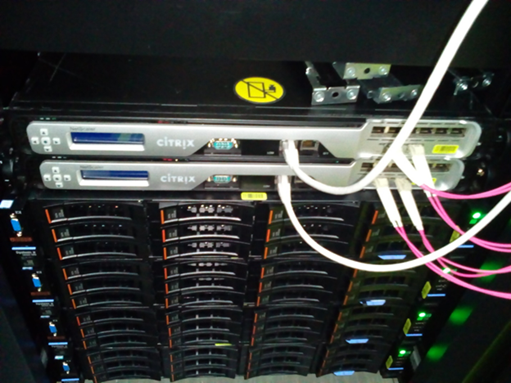
3. Network equipment and balancers full face

4. Same rear view
Pay attention to the switching. In previous articles, my colleagues have written about the importance of cable color marking, but it will not be superfluous to touch on this topic here.
We use color switching not only for the network, but also for power. This allows our engineers to navigate faster in the rack and reduces the influence of the human factor during re-switching.
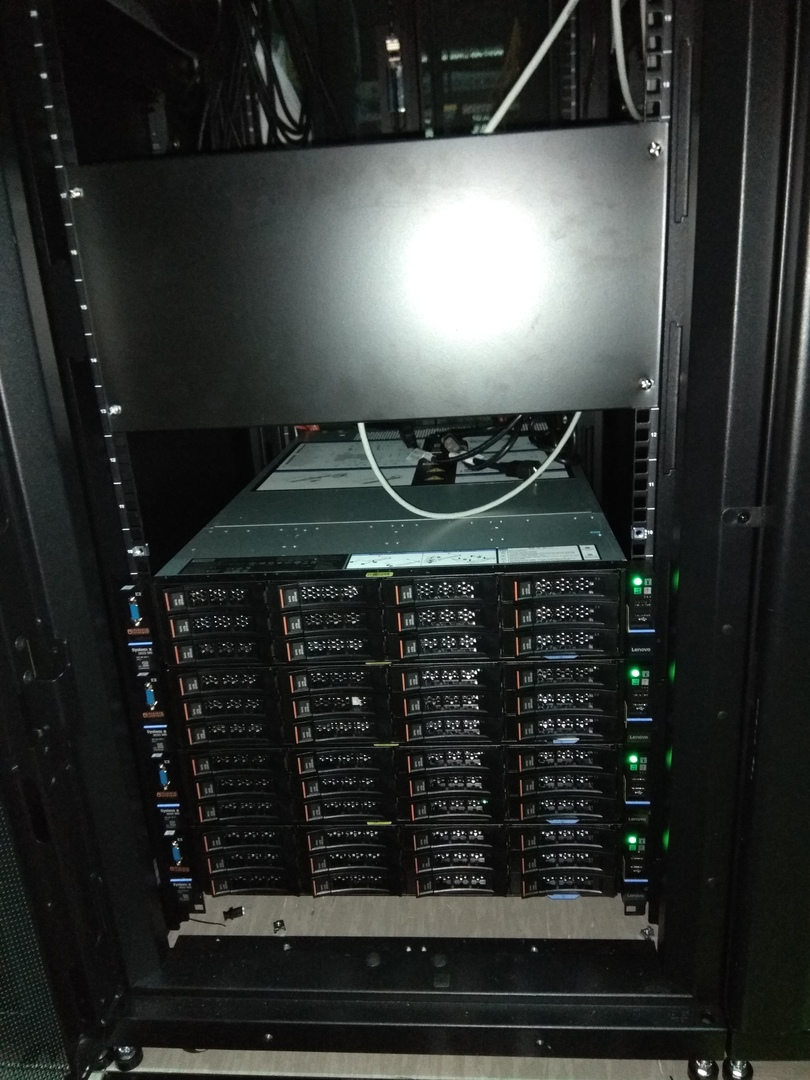
5. Work nodes

6. Rear view
This photo clearly shows how tightly the working servers are filled with disks - there are practically no empty slots even behind. By the way, such an organization of cables in compact bundles not only performs an aesthetic function, but also allows you to avoid overlapping the power supply fans, saving the iron from overheating.
Whitelisting
In the comments to the last article, I promised to tell you more about the whitelisting device.
If for some reason we agreed with the client to exclude from the accounts all work with the storage from inside the data center or via direct channels to its equipment, then we need to establish a private connection to the storage.
Remember, the first scheme was a branch on DIST'y and Cloud? In addition to the main Internet channel on 20Gb, we use an aggregated channel before the switches, to which we connect all clients at the data center level. If the client wants a direct link to the storage, we can configure the VLAN from the client to our 4500X with the construction of a separate route (or without it) and start up L3. After that, the client’s address already in Cloudian itself is set up binding to the tariff plan. Then for everyone who is connected to this tariff plan, the use of S3 from whitelisting-addresses will not be considered.
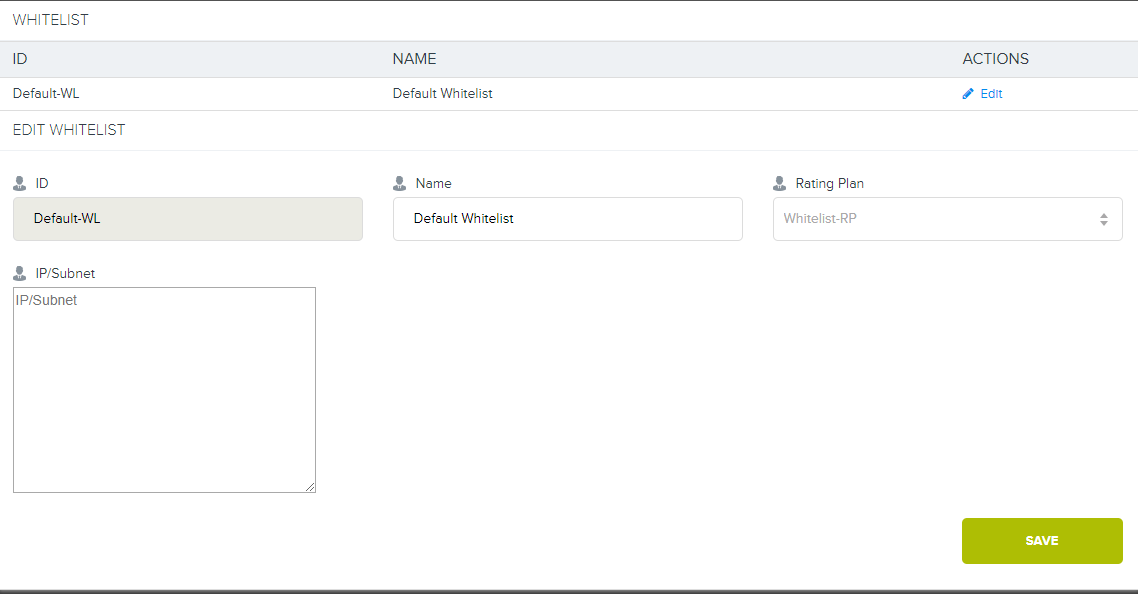
7. And this is what a special interface in Cloudian looks like.
Now we have no such tariff in the grid, but if you really want to - we can provide it.
History of construction
We are smoothly approaching the most interesting part of the story - the construction of a storage facility. There will be a lot of photos, as many as three attempts to organize traffic balancing and some harmful tips. I hope that the analysis of the troubles we encountered on the way will be useful to those who are preparing to work at 10Gb + speeds on the web.
Experimenting with 10G
Before I go directly to the essence of this section, let me make another small disclaimer.
According to the established tradition, before purchasing new auxiliary equipment, we go to the warehouse and select more or less suitable components. This allows you to quickly conduct tests and determine the future shopping list. Of course, as long as we do not achieve a 100% reliable result, nothing is spent on production.
So it was this time. And if Cisco did not throw any surprises, then with load balancers “greed” almost killed us.
First experience. Supermicro Servers
Here we were let down by the desire to conduct a quick test with minimal costs. In the warehouse, we found Supermicro servers that had everything fine except for the lack of SFP interfaces. We decided to install our favorite Intel 520DA2 on them and immediately ran into the first problem: single-unit machines, but no risers. At the same time, for some reason, our hull was not in the compatibility sheets, and there are a lot of native risers.
Following the advice of Misha Solovyov, Director for Innovative Development, we connected everything with flexible risers for mining farms. The result was such a "cadavre":

8. Prototype №1
It was necessary in some places to apply the famous blue electrical tape, so that nothing, God forbid, did not shorten. Yes, the collective farm. Yes, ashamed. But such a "configuration" is quite acceptable for the period of the experiment.

9. Rear view
What came out of this is clearly seen in the screenshot of the iperf:
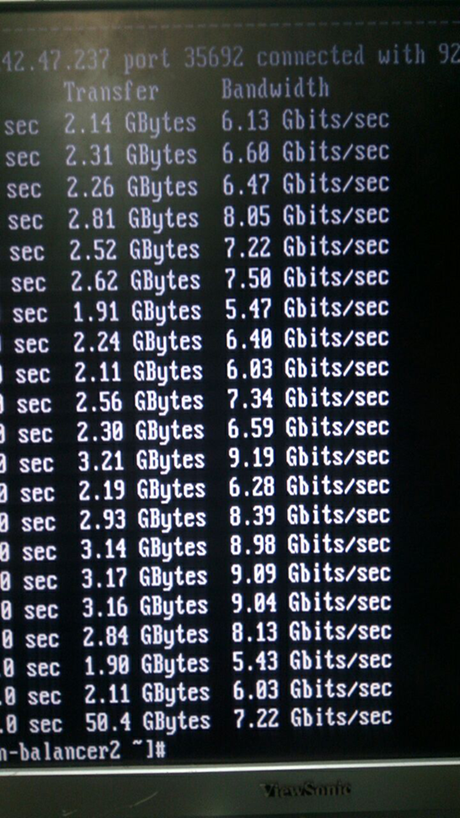
10. In fact, this is not a screenshot :)
The indicators are very interesting, right? Here we are sad. At first we thought about spyware chips, disassembled everything and straightened it out.

11. At first glance, there are no spy chips here.
They remembered the physics course: electromagnetic pickups, high-frequency signals, etc. ... Of course, it did not make sense to continue the experiment with such an amount and quality of the “collective farm”. So we finally dismantled the system and put the servers back in place.
Experience the second. Citrix Netscaler MPX8005
In the process of returning the servers to the site, we found new heroes: Citrix Netscaler MPX8005. This is a great brand iron, besides, practically unused. They look like this:
12. The slide in the rack did not fit in length, but we foresightedly decided to postpone it for later
Placed the equipment in the rack, switched and configured. These are really excellent “adult” glands, with 2 SFP slots under 10GB for each, HA, advanced algorithms, there is even L7. True, up to 5 gigabits per license, but we still used L3, and there are no such limits.
Fingers crossed, tested. No speed. On the interfaces - continuous errors about unsuitable transceivers, speed of about 5 gigabits, permanent drops. We remembered the flexible risers, sad again. Even there, the speed was higher, and fewer errors. We start to understand:
show channel LA/1 1) Interface LA/1 (802.3ad Link Aggregate) #10 flags=0x4100c020 <ENABLED, UP, AGGREGATE, UP, HAMON, HEARTBEAT, 802.1q> MTU=9000, native vlan=1, MAC=XXX, uptime 0h03m23s Requested: media NONE, speed AUTO, duplex NONE, fctl NONE, throughput 160000 Link Redundancy Throughput 80000 Actual: throughput 20000 LLDP Mode: NONE RX: Pkts(9388) Bytes(557582) Errs(0) Drops(1225) Stalls(0) TX: Pkts(10514) Bytes(574232) Errs(0) Drops(0) Stalls(0) NIC: InDisc(0) OutDisc(0) Fctls(0) Stalls(0) Hangs(0) Muted(0) bandwidthHigh: 160000 Mbits/sec, bandwidthNormal: 160000 Mbits/sec. LA mode: AUTO > show interface 10/1 1) Interface 10/1 (10G Ethernet, unsupported fiber SFP+, 10 Gbit) #1 flags=0x400c020 <ENABLED, UP, BOUND to LA/1, UP, autoneg, 802.1q> LACP <Active, Long timeout, key 1, priority 32768> MTU=9000, MAC=XXX, uptime 0h05m44s Requested: media AUTO, speed AUTO, duplex AUTO, fctl OFF, throughput 0 Actual: media FIBER, speed 10000, duplex FULL, fctl OFF, throughput 10000 LLDP Mode: TRANSCEIVER, LR Priority: 1024 RX: Pkts(8921) Bytes(517626) Errs(0) Drops(585) Stalls(0) TX: Pkts(9884) Bytes(545408) Errs(0) Drops(3) Stalls(0) NIC: InDisc(0) OutDisc(0) Fctls(0) Stalls(0) Hangs(0) Muted(0) Bandwidth thresholds are not set. > show interface 10/2 1) Interface 10/2 (10G Ethernet, unsupported fiber SFP+, 10 Gbit) #0 flags=0x400c020 <ENABLED, UP, BOUND to LA/1, UP, autoneg, 802.1q> LACP <Active, Long timeout, key 1, priority 32768> MTU=9000, MAC=XXX, uptime 0h05m58s Requested: media AUTO, speed AUTO, duplex AUTO, fctl OFF, throughput 0 Actual: media FIBER, speed 10000, duplex FULL, fctl OFF, throughput 10000 LLDP Mode: TRANSCEIVER, LR Priority: 1024 RX: Pkts(8944) Bytes(530975) Errs(0) Drops(911) Stalls(0) TX: Pkts(10819) Bytes(785347) Errs(0) Drops(3) Stalls(0) NIC: InDisc(0) OutDisc(0) Fctls(0) Stalls(0) Hangs(0) Muted(0) Bandwidth thresholds are not set. We used native Cisco transceivers, which, in theory, no problems should arise. They even checked the optics and just in case changed the transceivers - the same picture. Our car does not go, and that's it! We look more attentively.
Cisco 'beautiful' transceivers:
ix1: <Intel(R) PRO/10GbE PCI-Express Network Driver, Version - 2.7.4> port 0xe000-0xe01f mem 0xf7800000-0xf781ffff,0xf7840000-0xf7843fff irq 17 at device 0.1 on pci1 ix1: ixgbe bus speed = 5.0Gbps and PCIe lane width = 8 SFP+/SFP, vendor CISCO-AVAGO , part number XXX , 10G 0x10 1G 0x00 CT 0x00 *** Unsupported SFP+/SFP type! Normally transceivers are not detected, but unsupported!
I had to find the very best relatives:
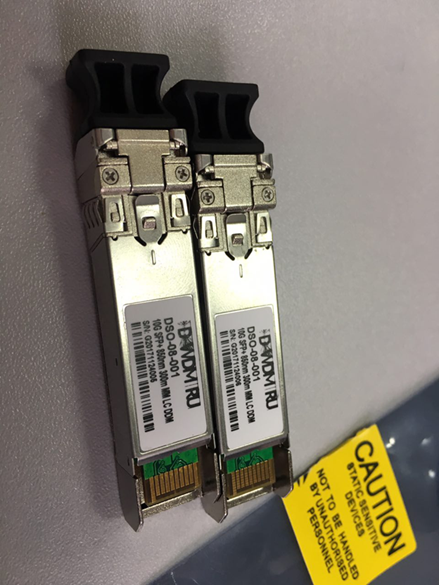
13. Most native transceivers in the wild west
ix0: <Intel(R) PRO/10GbE PCI-Express Network Driver, Version - 2.7.4> port 0xe020-0xe03f mem 0xf7820000-0xf783ffff,0xf7844000-0xf7847fff irq 16 at device 0.0 on pci1 platform: Manufacturer Citrix Inc. platform: NSMPX-8000-10G 4*CPU+6*E1K+2*IX+1*E1K+4*CVM 1620 675320 (28), manufactured at 8/10/2015 platform: serial 4NP602H7H0 platform: sysid 675320 - NSMPX-8000-10G 4*CPU+6*E1K+2*IX+1*E1K+4*CVM 1620 ix0: ixgbe bus speed = 5.0Gbps and PCIe lane width = 8 SFP+/SFP, vendor CITRIX , part number XXX , 10G 0x10 1G 0x01 CT 0x00 ix0: [ITHREAD] 10/2: Ethernet address: 00:e0:ed:45:39:f8 ix1: <Intel(R) PRO/10GbE PCI-Express Network Driver, Version - 2.7.4> port 0xe000-0xe01f mem 0xf7800000-0xf781ffff,0xf7840000-0xf7843fff irq 17 at device 0.1 on pci1 ix1: ixgbe bus speed = 5.0Gbps and PCIe lane width = 8 SFP+/SFP, vendor CITRIX , part number XXX , 10G 0x10 1G 0x01 CT 0x00 These transceivers were determined without any problems, but this did not save the situation. Updated firmware - the same. Citrix support decided to quietly keep silent (no, not because of the transceiver pedigree).
We took a deep breath and dug into the hardware specs. It turned out that the answer was before our eyes all this time: ixgbe bus speed = 5.0Gbps and PCIe lane width = 8. This is a problem with the card. She herself lacks PCIe speed. For our Citrix, the maximum performance of the PCI-e slot for a card with transceivers is 5.0Gbps, which he shouted at us all this time. As Citrix on MPX8015 (it is exactly the same hardware!) They wanted to issue 15 gigabits, it's not clear. But we understood why such "cool" balancers all this time were in stock. They cannot work correctly with 10G links in principle.
The last experience. Use the right iron and make it beautiful
Here, our patience ended with the belief in humanity, and we had to use the technology "otzhile" to get the normal hardware in the form of HP ProLiant DL360 G9 from the photos above. They did not give us any surprises, they download 10G and do not complain. :)
Stress Testing
Since we do not accept the “hujak-hujak - and production” approach, and we know from experience that an untested system after assembly with almost a 100% guarantee would not work, we decided to do load testing. In addition, with its help you can do some tuning for the future.
To generate the load, the usual tool was chosen - Apache Jmetr. It is quite good in itself, as I wrote a couple of articles back, and this is one of the most flexible solutions on the market, even though Java loves to eat. To work with S3, we used a self-written module using the AWS SDK, also in Java. In the tests, we managed to achieve a speed of 12.5 Gbit per write for files over 250 megabytes with parallel loading of chunks of 5 megabytes, and for files of less than 5 megabytes - processing about 3000 HTTP requests per second. When running both tests in parallel, it turned out about 11 Gigabits and 2200 requests per second. At the same time, there is an opportunity to improve work with mixed loads and with small objects. We are "buried" in the CPU, and the second socket is free. On the load generator, test files were taken from the RAM in order to eliminate the effect on the disk subsystem of the generator itself. To conduct tests, remembering Java’s love for RAM and the need to work with a large number of threads when loading in parallel, we used the HP DL980 g7 server as a generator. This eight-server server with 8 Intel E74870 processors and 512Gb of RAM on board.
Inside the team, the tender nickname Hippo stuck to it.

14. Our Hippo. True, something like?
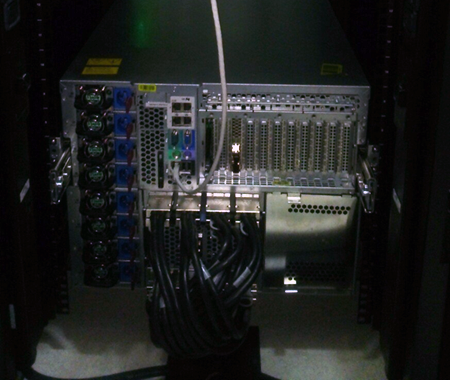
15. Rear view. The scary cables below in the center is the cross-connection of the internal inter-bridge bus
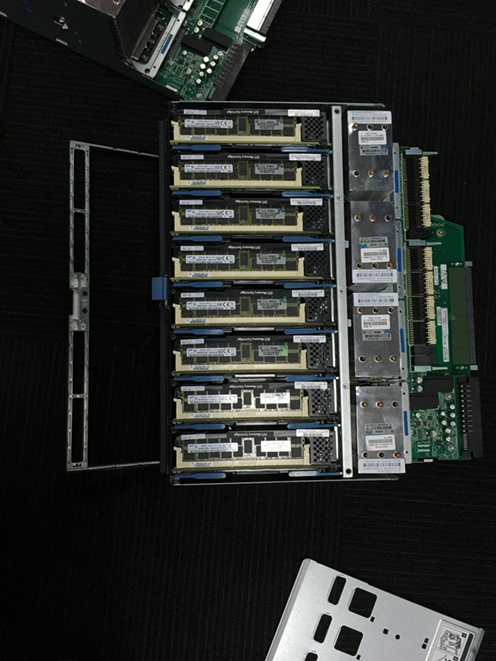
16. This is one of the two server heads. Each has 4 processors and 16 strips of 16 gigabytes of RAM
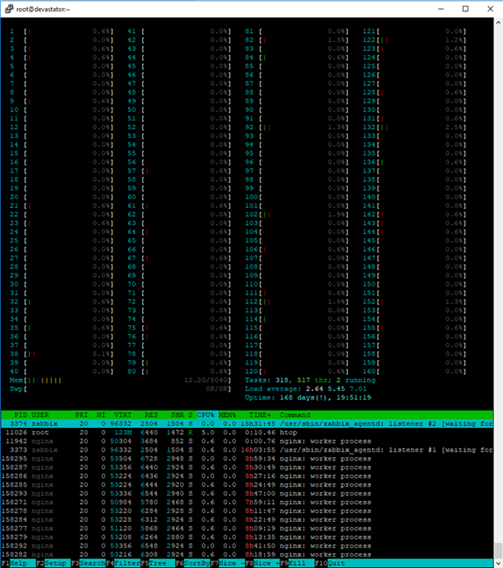
17. To use Htop comfortably in the console of such a server, you need a large monitor :)
In practice, the mixed test noticeably loaded even such a powerful server.
To arrive at the obtained performance results, we had to transfer the internal cluster network to 9k jumbo frames and slightly tune the network stack of balancers and working nodes (we use CentOS Linux), as well as optimize a number of other kernel parameters on the working nodes:
cat /etc/sysctl.conf … kernel.printk = 3 4 1 7 read_ahead_kb = 1024 write_expire = 250 read_expire = 250 fifo_batch = 128 front_merges = 0 net.core.wmem_default = 16777216 net.core.wmem_max = 16777216 net.core.rmem_default = 16777216 net.core.rmem_max = 16777216 net.core.somaxconn = 5120 net.core.netdev_max_backlog = 50000 net.ipv4.tcp_tw_reuse = 1 net.ipv4.tcp_rmem = 4096 87380 16777216 net.ipv4.tcp_wmem = 4096 65536 16777216 net.ipv4.tcp_slow_start_after_idle = 0 net.ipv4.tcp_max_syn_backlog = 30000 net.ipv4.tcp_max_tw_buckets = 2000000 fs.file-max = 196608 vm.overcommit_memory = 1 vm.overcommit_ratio = 100 vm.max_map_count = 65536 vm.dirty_ratio = 40 vm.dirty_background_ratio = 5 vm.dirty_expire_centisecs = 100 vm.dirty_writeback_centisecs = 100 net.ipv4.tcp_fin_timeout=10 net.ipv4.tcp_congestion_control=htcp net.ipv4.netfilter.ip_conntrack_max=1048576 net.core.rmem_default=65536 net.core.wmem_default=65536 net.core.rmem_max=16777216 net.core.wmem_max=16777216 net.ipv4.ip_local_port_range=1024 65535 The main settings that have been tuned are the size of buffers, the number of network connections, the number of connections to the port and connections monitored by firewalls, and also timeouts.
Cisco C3750 + LACP = pain
Another pitfall in network performance is load balancing when using LACP / LAGp. Unfortunately, the Cisco 3750 is not able to balance the load on the ports, only the source and destination addresses. In order to achieve the correct balancing of traffic, we had to hang 12 IP addresses on the bond interfaces of the working nodes, “looking” towards customers. Conventionally, 3 for each physical link. With this configuration, it was possible to do without LACP at all on the “external” interfaces of the working nodes, since all addresses are specified in the Nginx config, but then if we lost the link, we would automatically reduce the weight of the node in balancing. When “dumping” the link LACP allows you to maintain full accessibility to all addresses.
bond0.10 Link encap:Ethernet HWaddr XXX inet addr:192.168.XX Bcast:192.168.XX Mask:255.255.255.0 UP BROADCAST RUNNING MULTICAST MTU:9000 Metric:1 RX packets:2390824140 errors:0 dropped:0 overruns:0 frame:0 TX packets:947068357 errors:0 dropped:0 overruns:0 carrier:0 collisions:0 txqueuelen:0 RX bytes:18794424755066 (17.0 TiB) TX bytes:246433289523 (229.5 GiB) bond0.10:0 Link encap:Ethernet HWaddr XXX inet addr:192.168.XX Bcast:192.168.XX Mask:255.255.255.0 UP BROADCAST RUNNING MULTICAST MTU:9000 Metric:1 bond0.10:1 Link encap:Ethernet HWaddr XXX inet addr:192.168.XX Bcast:192.168.XX Mask:255.255.255.0 UP BROADCAST RUNNING MULTICAST MTU:9000 Metric:1 bond0.10:2 Link encap:Ethernet HWaddr XXX inet addr:192.168.XX Bcast:192.168.XX Mask:255.255.255.0 UP BROADCAST RUNNING MULTICAST MTU:9000 Metric:1 bond0.10:3 Link encap:Ethernet HWaddr XXX inet addr:192.168.XX Bcast:192.168.XX Mask:255.255.255.0 UP BROADCAST RUNNING MULTICAST MTU:9000 Metric:1 bond0.10:4 Link encap:Ethernet HWaddr XXX inet addr:192.168.XX Bcast:192.168.XX Mask:255.255.255.0 UP BROADCAST RUNNING MULTICAST MTU:9000 Metric:1 bond0.10:5 Link encap:Ethernet HWaddr XXX inet addr:192.168.XX Bcast:192.168.XX Mask:255.255.255.0 UP BROADCAST RUNNING MULTICAST MTU:9000 Metric:1 bond0.10:6 Link encap:Ethernet HWaddr XXX inet addr:192.168.XX Bcast:192.168.XX Mask:255.255.255.0 UP BROADCAST RUNNING MULTICAST MTU:9000 Metric:1 bond0.10:7 Link encap:Ethernet HWaddr XXX inet addr:192.168.XX Bcast:192.168.XX Mask:255.255.255.0 UP BROADCAST RUNNING MULTICAST MTU:9000 Metric:1 bond0.10:8 Link encap:Ethernet HWaddr XXX inet addr:192.168.XX Bcast:192.168.XX Mask:255.255.255.0 UP BROADCAST RUNNING MULTICAST MTU:9000 Metric:1 bond0.10:9 Link encap:Ethernet HWaddr XXX inet addr:192.168.XX Bcast:192.168.XXMask:255.255.255.0 UP BROADCAST RUNNING MULTICAST MTU:9000 Metric:1 bond0.10:10 Link encap:Ethernet HWaddr XXX inet addr:192.168.XX Bcast:192.168.XX Mask:255.255.255.0 UP BROADCAST RUNNING MULTICAST MTU:9000 Metric:1 Functional testing
Having finished the work on the repository, we met the flexify.io service. They help facilitate the migration between different object repositories. But to become a Flexify partner, you need to pass serious tests. “Why not?” - we thought. Third-party testing is always a rewarding experience.
The main task of the tests is to test the operation of the S3 protocol methods through their proxy in relation to various configurations, among which there can be any set of S3-compatible buckets supported by the service provider.
First of all, the methods working with objects in the bucket are checked. Our repository was tested using a wide range of test data, the behavior of the methods was checked for objects of various sizes and contents, for keys containing all possible combinations of Unicode characters.
In negative tests, they tried to transfer invalid data wherever possible. Special attention was paid to data integrity in the process of work.
Methods that work with buckets have also been tested, but mostly according to positive scenarios. The task of these tests was to verify that the use of methods through a proxy does not entail any serious problems, for example, data corruption or crash.
The breadth of coverage can be judged by tests that were used both through a proxy and directly. Most of the tests, especially those that work with objects, are parameterized and test a large number of different objects, ranges, etc.
Implemented tests for objects
GET Object request with no optional parameters
GET Object request multithread
GET Object request to an encrypted object with provided parameters
GET Object request
GET Object request with range that intersects file's bytes range
GET
GET Object request with a suffix range parameter
GET Object request
GET Object request with invalid range parameter
Head Object request to an existing object
Head Object request
Head Object Request Key
Head Object request to an encrypted object with sse parameters
Head object request to an encrypted object with no sse parameters
List Objects request
List Objects v2 request
List Objects request with provided Marker parameter
List Objects request with provided Prefix parameter
List Objects request with provided Marker and Prefix parameters
List of objects with Marker and Prefix parameters
List Objects request with skipped Delimiter Parameter
List Objects request with passed Marker parameter, but with skipped Delimiter parameter
List Objects request with passed non-existing Prefix
List Objects request with passed non-existing Marker
Multipart upload with native upload_file () method
Multipart upload with native upload_fileobj () method
Multipart upload with custom method
Stopping multipart upload with abort_multipart_upload () method
Performing abort_multipart_upload () method with incorrect uploadId
Key and uploadId Performing abort_multipart_upload () method
Multipart upload of 2 files with a same key simultaneously. 2nd file uploaded before 1st
Multipart upload of 2 files with a same key simultaneously. 1st file uploaded before 2nd
Multipart upload of files with a different keys simultaneously. 1st file uploaded before 2nd
Multipart upload with a part size of 512kb
Multipart upload with size
Multipart upload of a file with parts of different size
List multipart upload request
PUT Object ACL request to an object with provided grantee id
GET Object ACL
PUT Object Tagging method
GET Object Tagging method
DELETE Object Tagging method
PUT Object request with no optional parameters
PUT Object requests multithread
PUT Object requests with passed optional encryption parameters
PUT Object requests with passed empty Body Parameter
GET Object with native download_file () method
GET Object with native download_fileobj () method
GET Object with custom method using ranges
GET Object with prefix with native download_file () method
GET Object with prefix with native download_fileobj () method
GET Object with prefix with custom method using ranges
DELETE Object request to an existing object
DELETE Object request to an not existing object
DELETE Objects request to a group with existing objects
Realized tests for buckets
PUT Bucket Encryption
GET Bucket Encryption
DELETE Bucket Encryption
PUT Bucket Policy request
GET Bucket Policy request to a bucket with Policy
DELETE Bucket Policy request to a bucket with Policy
GET Bucket Policy request to a bucket with no Policy
DELETE Bucket Policy request to a bucket with no Policy
PUT Bucket Tagging
GET Bucket Tagging
DELETE Bucket Tagging
Create bucket request with existing bucket name
Create bucket request with unique bucket name
Delete bucket request with existing bucket name
Delete bucket request with unique bucket name
PUT Bucket ACL request to a bucket with provided grantee id
GET Object ACL
As you might guess, this is a fairly tough test, but we passed it on the whole positively. Some problems arose due to the lack of support for SSE and small jambs with Unicode support at that moment:
Apload failed with keys containing:
- U + 0000-U + 001F - the first 32 unreadable check characters. On Amazon, for example, only the first U + 0000 is not directly filled.
- And also U + 18D7C, U + 18DA8, U + 18DB4, U + 18DBA, U + 18DC4, U + 18DCE. These are also unreadable characters, but Amazon accepts them as keys. With all the other characters, there were no problems.
When reading the contents of the bake, there is a problem on the 66.675 key, which contains the symbol U + FFFE. It is impossible to get a complete list of keys in a bake that contains an object with such a key.
The rest of the tests were successful, and at the end of September we appeared in the list of available suppliers!
Small afterword and bonus for readers
Earlier, I wrote that Cloudian HyperStore, despite its numerous advantages, is practically not covered in the Russian-speaking segment of the Internet.
The first article was devoted to the basics of working with Cloudian. We analyzed its internal structure, architectural nuances and read the translation of official documentation.
Today I told how we built our own storehouse and what nuances and pitfalls we encountered.
Those of you who wanted to touch with hands what we are talking about already 2 articles in a row can use the feedback form on this page and personally find out what the salt is. By default, we give 15Gb for 2 weeks for free, of course, with user access. If you have a desire to share impressions of working with the repository, write to me in PM. :)
And for those who are 15 Gb for 2 weeks a little, we have a small quest! In the photos in the article we posted three Hippo. The first 50 people who find them will receive 30Gb for 4 weeks. To get an enlarged test, write in the comments the numbers of pictures where Hippo hid, and apply for the link above. Do not forget to indicate in the application link to your comment.
By tradition, if you have any questions, ask them in the comments.
I will answer them with pleasure.
Source: https://habr.com/ru/post/425973/
All Articles