Web service performance testing as part of Continuous Integration. Yandex experience
Almost all new Yandex employees are amazed at the scale of the stress experienced by our products. Thousands of hosts with hundreds of thousands of requests per second. And this is only one of the services. In this case, we must respond to requests for a split second. Even a slight change in the product can have a significant impact on performance, so it is important to test and evaluate the effect of your code on the service.
In our service of advertising technologies, testing works within the framework of the Continuous Integration methodology, in more detail about the organization of which we will tell on October 25 at the Yandex event from the inside , and today we will share with Habr's readers experience in automating the assessment of important product metrics related to service performance. You will learn how to trust the analysis machine, and not follow them on the charts. Go!

It does not go about how to test the site. There are many online tools for this. Today we will talk about a highly loaded internal backend service, which is part of a large system and prepares information for an external service. In our case, for search results pages and partner sites. If our component does not have time to respond, then the information from it will simply not be given to the user. So, the company will lose money. Therefore, it is very important to respond on time.
What important server indicators can be distinguished?
- Request per second (RPS) . The happiness of one user is of course important to us. But what if not one, but thousands of users have come to you? How many requests per second can your server withstand and not fall?
- Time per request . The site content should be rendered as quickly as possible so that the user does not get tired of waiting, and he does not go to the store for popcorn. In our case, he will not see an important piece of information on the page.
- Resident set size (RSS) . Be sure to monitor how much your program consumes memory. If the service eats all the memory, you can hardly talk about fault tolerance.
- HTTP errors .
So let's go in order.
Request per second
Our developer, who has been working on load testing for a long time, likes to talk about a critical system resource. Let's see what it is.
Each system has its own configuration characteristics that define the work. For example, queue length, response timeout, threads-worker pool, etc. And so it may happen that the capacity of your service rests on some of these resources. You can conduct an experiment. Increase each resource in turn. The resource, the increase of which will increase the capacity of your service, and will be critical for you. In a well-configured system, in order to raise capacity, it is necessary to increase not one resource, but several. But this still can be "grope." It will be great if you can customize your system so that all resources work in full force, and the service fits into the timeframe assigned to it.
To estimate how many requests your server can handle per second, you need to send a stream of requests to it. Since we have this process built into the CI system, we use a very simple "gun", with limited functionality. But from open source software, Yandex.Tank will be perfect for this task. He has detailed documentation . As a gift to the tank there is a service for viewing the results.
Small oftop. Yandex.Tank has rather rich functionality that is not limited to the automation of shelling by requests. It will also help to collect the metrics of your service, build graphs and screw the module with the logic you need. In general, we highly recommend to get to know him.
Now you need to feed requests to the Tank in order to bombard our service with them. Requests that you will attack the server can be of the same type, artificially created and multiplied. However, measurements will be much more accurate if you can collect a real pool of requests from users for a certain period of time.
Capacity can be measured in two ways.
Open load model (stress testing)
Make "users", that is, several threads that will send a request to your system. We will give the load not constant, but to increase or even give it in waves. Then it will bring us closer to real life. We increase the RPS and catch the point at which the fired service “punches” the SLA. Thus you can find the limits of the system.
To calculate the number of users, you can use the Little formula (you can read about it here ). Omitting the theory, the formula looks like this:
RPS = 1000 / T * workers, where
• T is the average request processing time (in milliseconds);
• workers - the number of threads;
• 1000 / T requests per second - this value will produce a single-stream generator.
Closed load model (load testing)
We take a fixed number of "users". You need to configure it so that the input queue corresponding to the configuration of your service is always clogged. At the same time, it is pointless to make the number of threads more than the queue limit, since we will rest on this number, and the remaining requests will be discarded by the server with a 5xx error. We look at how many requests per second the construction can issue. Such a scheme is generally not similar to the real flow of requests, but it will help show the behavior of the system at maximum load and evaluate its throughput at the current moment.
For the vast majority of systems (where the critical resource is not related to handling connections), the result will be the same. At the same time, the closed model has less noise, because the system is always in the test area of interest to us.
We are testing our service using a closed model. After shooting, the gun gives us how many requests per second our service was able to issue. Yandex.Tank this indicator is also easy to tell.
Time per request
If you go back to the previous item, it becomes obvious that with such a scheme, it does not make any sense to evaluate the response time to the request. The more we load the system, the more it will degrade and the longer it will respond. Therefore, for testing response time, the approach should be different.
To get the average response time, we use the same Yandex.Tank. Only now we will set the RPS corresponding to the average of your system in production. After the shelling, we get the response times of each request. According to the collected data, you can calculate the percentiles of the times of responses.
Next you need to understand what percentile we consider important. For example, we push off from production. We can leave 1% of requests for errors, non-responses, debit requests that work for a long time, problems with the network, etc. Therefore, we consider the response time to be meaningful, at which 99% of requests fit.
Resident set size
Directly our server works with files through mmap . Measuring the RSS rate, we want to know how much memory the program took from the operating system during its operation.
A file is written in Linux / proc / PID / smaps is an extension based on maps showing the memory consumption for each of the process mappings. If your process uses tmpfs, then smaps will contain both anonymous and non-anonymous memory. Non-anonymous memory includes, for example, files loaded into memory. Here is an example of writing to smaps. The specific file is specified, and its parameter Anonymous = 0kB.
7fea65a60000-7fea65a61000 r--s 00000000 09:03 79169191 /place/home/.../some.yabs Size: 4 kB Rss: 4 kB Pss: 4 kB Shared_Clean: 0 kB Shared_Dirty: 0 kB Private_Clean: 4 kB Private_Dirty: 0 kB Referenced: 4 kB Anonymous: 0 kB AnonHugePages: 0 kB Swap: 0 kB KernelPageSize: 4 kB MMUPageSize: 4 kB Locked: 0 kB VmFlags: rd mr me ms This is an example of anonymous memory allocation. When a process (the same mmap) makes a request to the operating system to allocate a certain size of memory, an address is allocated to it. While the process takes only virtual memory. At this point, we still do not know which physical piece of memory will be allocated. We see a nameless entry. This is an example of allocating anonymous memory. The system was requested to have a size of 24572 kB, but it was not used and in fact occupied only RSS = 4 kB.
7fea67264000-7fea68a63000 rw-p 00000000 00:00 0 Size: 24572 kB Rss: 4 kB Pss: 4 kB Shared_Clean: 0 kB Shared_Dirty: 0 kB Private_Clean: 0 kB Private_Dirty: 4 kB Referenced: 4 kB Anonymous: 4 kB AnonHugePages: 0 kB Swap: 0 kB KernelPageSize: 4 kB MMUPageSize: 4 kB Locked: 0 kB VmFlags: rd wr mr mw me ac Since the allocated non-anonymous memory is not going anywhere after stopping the process, the file will not be deleted, we are not interested in such RSS.
Before you start shooting on the server, we summarize the RSS from / proc / PID / smaps, allocated for anonymous memory, and memorize it. We conduct shelling, similar to testing time in request. After the end we consider RSS again. The difference between the initial and final state will be the amount of memory that your process used during its work.
HTTP errors
Do not forget to follow the response codes that the service returns during testing. If something went wrong in the setup of the test or the environment, and the server returned 5xx and 4x errors to all requests, then there was not much sense in such a test. We follow the share of bad answers. If there are many errors, then the test is considered invalid.
A bit about measurement accuracy
And now the most important thing. Let's go back to the previous paragraphs. The absolute values of the metrics we calculated, it turns out, are not so important to us. No, of course, you can achieve stability indicators, taking into account all the factors, errors and fluctuations. In parallel, write a scientific paper on this topic (by the way, if someone was looking for one, this could be a good option). But this is not what interests us.
The impact of a particular commit on the code relative to the previous state of the system is important for us. That is, the difference in metrics from commit to commit is important. And here it is necessary to set up a process that will compare this difference and at the same time ensure the stability of the absolute value at this interval.
Environment, requests, data, service status - all factors available to us should be recorded. This system also works for us in the framework of Continuous integration, providing us with information about all kinds of changes that have occurred within the framework of each commit. Despite this, it will not be possible to fix everything, there will be noise. We can reduce the noise, obviously, by increasing the sample, that is, we can perform several iterations of shooting. Further, after the shooting, say, 15 iterations, we can calculate the median of the resulting sample. In addition, it is necessary to find a balance between the noise and the duration of the shooting. We, for example, stopped at an error of 1%. If you want to choose a more complex and accurate statistical method in accordance with your requirements, we recommend the book , which lists the options with a description of when and what applies.
What else can be done with noise?
Note that an important role in such testing is the environment in which you conduct tests. The test bench should be reliable, other programs should not be running on it, since they can lead to degradation of your service. In addition, the results can and will depend on the profile of the load, the environment, the database and on various “magnetic storms”.
In the framework of one commit test, we perform several iterations on different hosts. First, if you use the cloud, anything can happen there. Even if the cloud is specialized, like ours, service processes still work there. Therefore, it is impossible to rely on the result from a single host. And if you have an iron host, where there is not, as in the cloud, the standard mechanism for raising the environment, then you can break it all at once and leave it at random. And he will lie to you always. Therefore, we are chasing our tests in the cloud.
From this, however, arises another question. If your measurements are made every time on different hosts, then the results may make some noise because of this as well. Then you can normalize the readings to the host. That is, according to historical data, collect the “host coefficient” and take it into account when analyzing the results.
An analysis of historical data shows that our hardware is different. The word "iron" here includes the kernel version and the consequences of uptime (apparently, non-relocatable kernel objects in memory).
Thus, for each "host" (when the host reboots, it "dies" and a "new" appears) we assign an amendment by which we multiply the RPS before the aggregation.
The amendments consider and update in an extremely clumsy way, suspiciously resembling some version of reinforcement training.
For a given vector of host corrections, we consider the objective function:
- in each test, we consider the standard deviation of the “corrected” RPS results obtained
- we take from them the average with weights equal ,
- we have tau = 1 week.
Further, one amendment (for the host, for which the sum of these weights is the greatest) is fixed at 1.0 and we are looking for the values of all other corrections that give the minimum of the objective function.
In order to validate the results on historical data, we consider the corrections on the old data, we consider the corrected result on the fresh ones, compared with the uncorrected.
Another option for adjusting the results and reducing noise is normalization to "synthetics". Before launching a trustable service, run a “synthetic program” on the host, from which you can evaluate the state of the host and calculate the correction factor. But in our case, we use the amendments on the hosts, but this idea remained the idea. Perhaps some of you will like it.
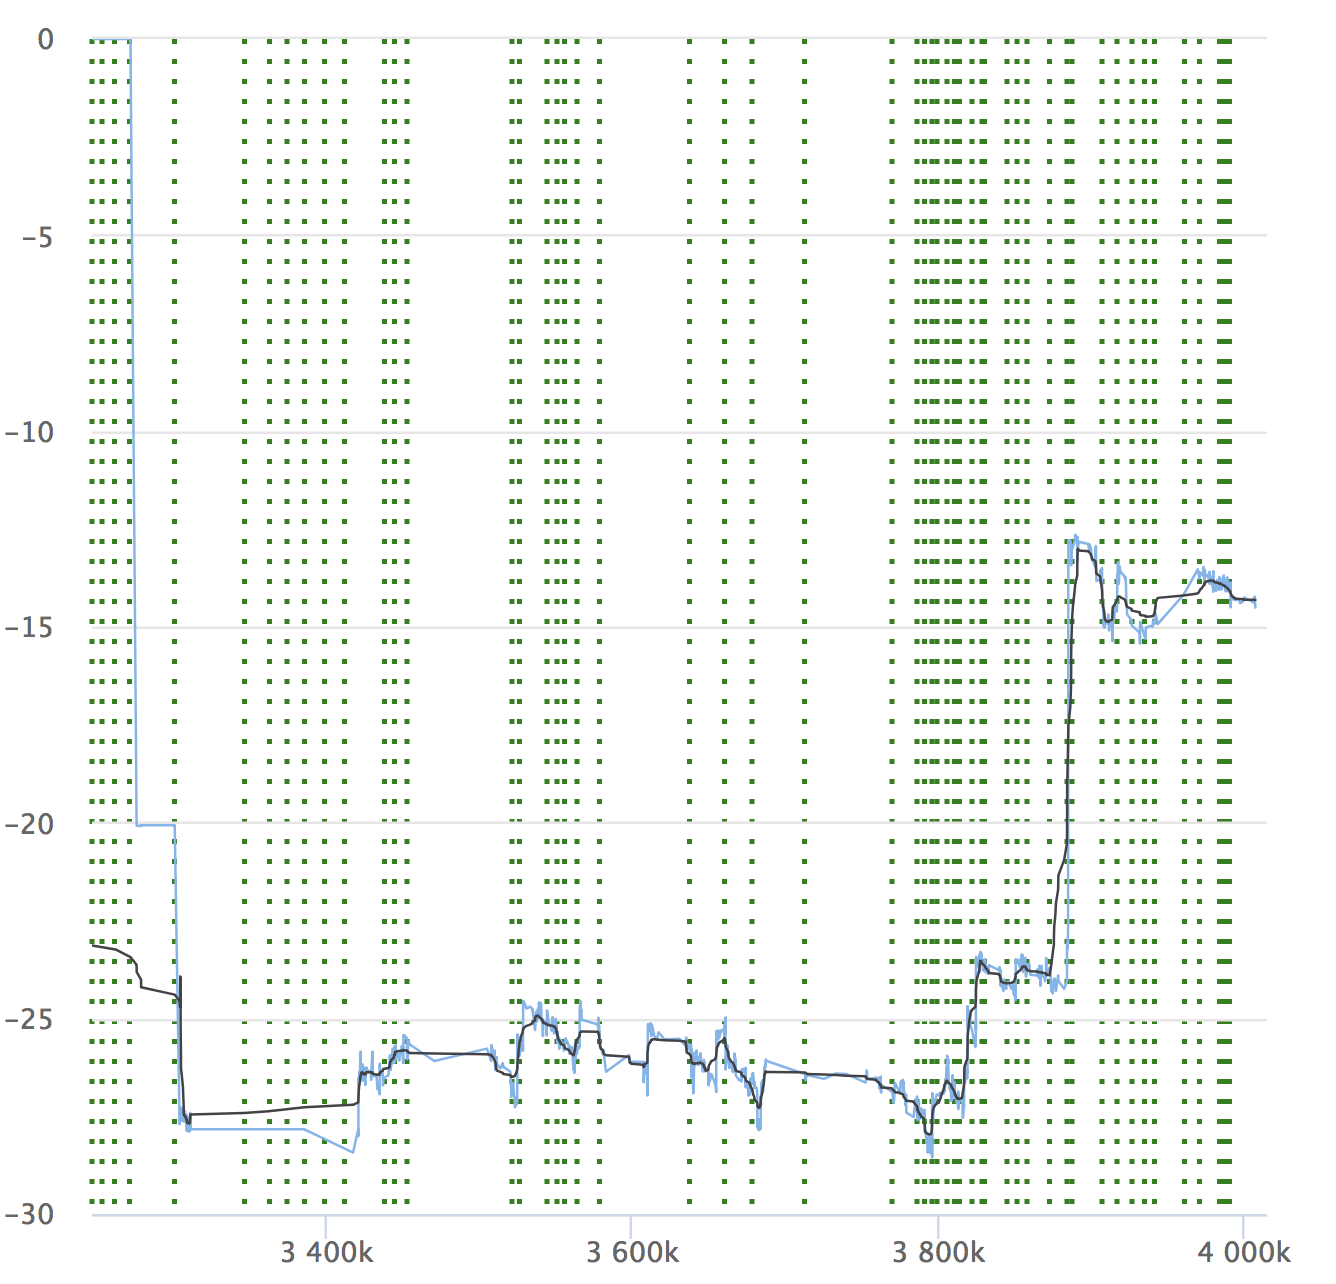
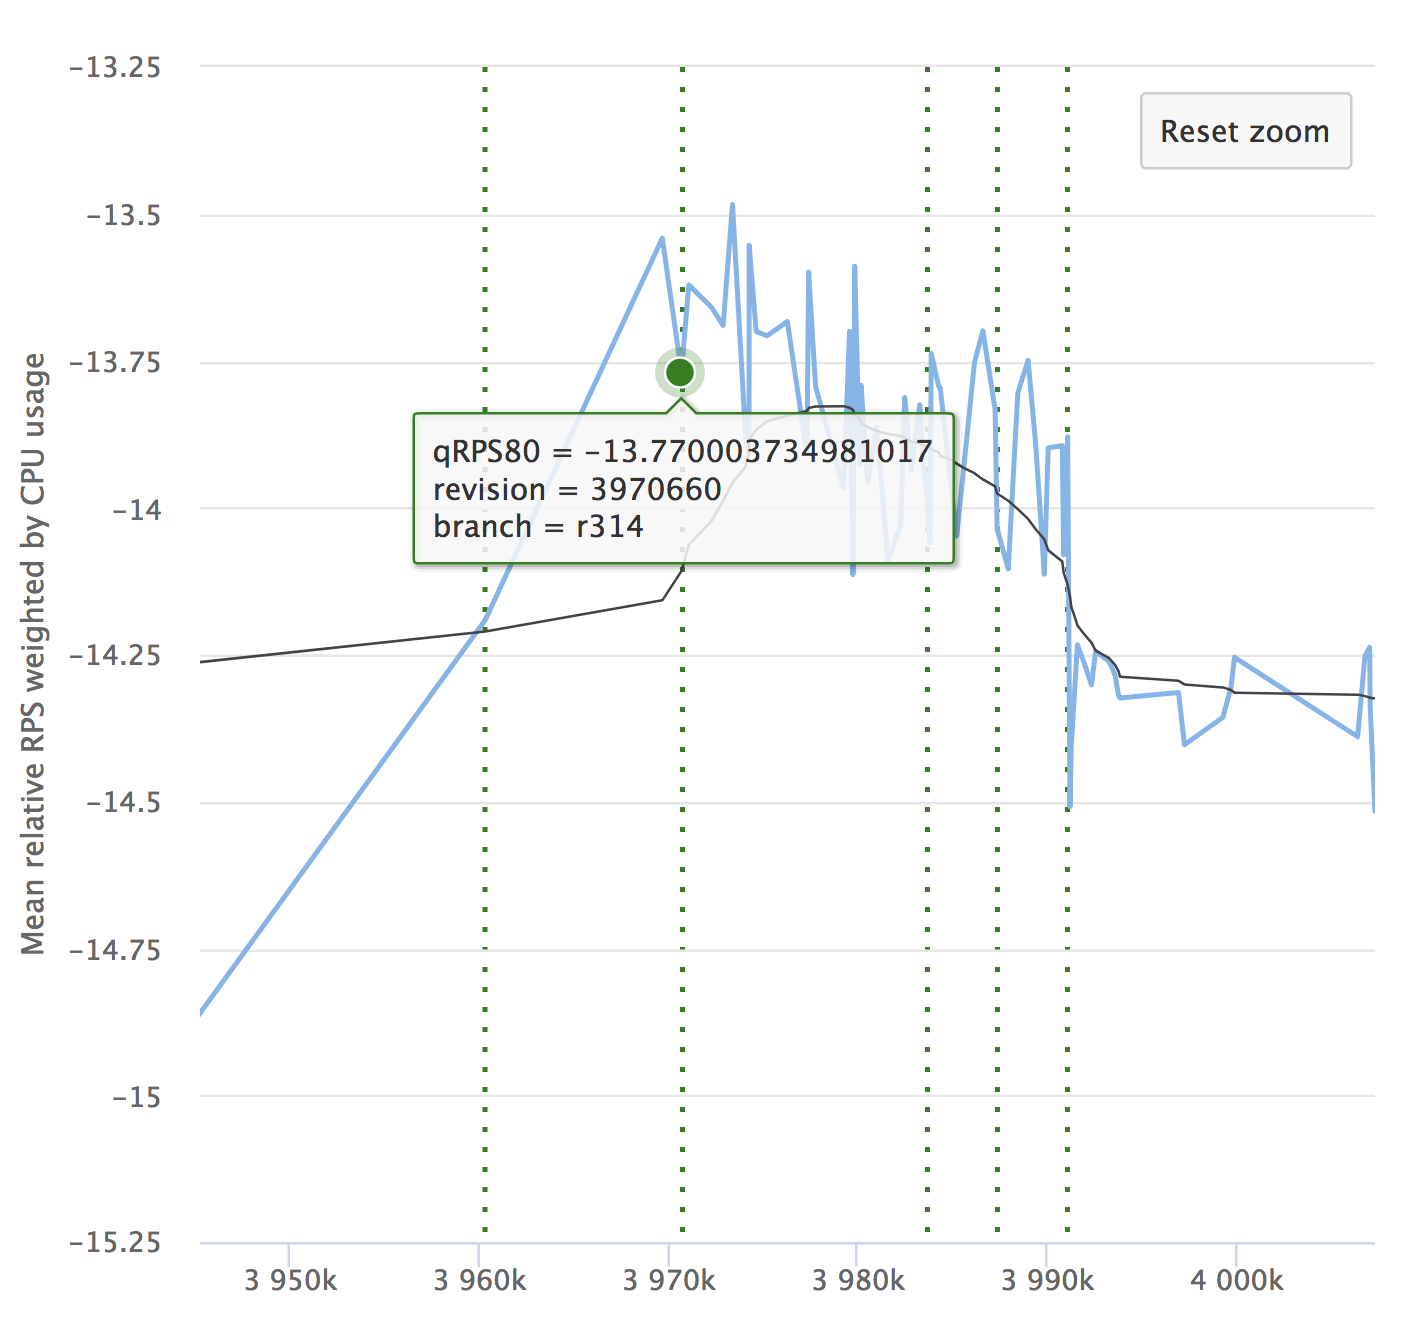
Despite the automation and all its advantages, do not forget about the dynamics of your indicators. It is important to ensure that the service does not degrade over time. Small drawdowns can be overlooked, they can accumulate, and over a large time period your indicators can subside. Here is an example of our graphs for which we look at the RPS. It shows the relative value on each checked commit, its number and the opportunity to see where the release was allotted.
If you have read the article, it means you’ll be interested to see the report on Yandex.Tank and the analysis of load testing results.
We also remind that in more detail about the organization of Continuous Integration we will tell on October 25 at the Yandex event from the inside . Come to visit!
')
Source: https://habr.com/ru/post/425867/
All Articles