A tool to help you choose the best product ideas.

Let's imagine that you manage a product that helps small businesses to provide technical support to their customers. You are looking for ways to increase the level of engagement and retention of your customers. You have two ideas:
- A dashboard that will allow business owners to monitor engagement statistics.
- Chat bot that helps business owners automate communication with consumers.
Dashboard is a feature that has already been discussed several times with users and you feel that it has great potential, but also realize the risk that only one large user will use dashboards. Chat bot is what everyone in your company likes and is squeezed by the management - it looks like a very necessary thing for customers, this is a cool project. And yes, chat bots are in fashion now.
What will you choose?

Such prioritization issues are the heart of product management. The cost of an error for the wrong choice can be quite high: the cost of development + the cost of deployment in production + the cost of support + costs of lost profits + all other costs.
We often have temptations to make decisions on weak signals: majority votes, opinion of authoritative people ( HiPPO ), industry trends, etc., but, as experience shows, this is a bad heuristic, this approach is no better than tossing a coin.
In this article I will demonstrate that, in my opinion, is the best way to find successful ideas. This approach includes three components:
- ICE coefficient
- Confidence level
- Gradual incremental validation
ICE coefficient
ICE calculation is a prioritization method invented by Shaun Ellis, the man who helped grow companies like DropBox, Eventbrite and the term growth hacking . The calculation of the ICE coefficient was originally intended to prioritize growth experiments, but can also be applied to any other ideas.
You calculate the coefficient for each idea using the following formula:
ICE = Impact () * Confidence () * Ease (),
Where:
- Influence is an assessment of how positively the idea will affect the key metric that you are trying to improve.
- Simplicity (implementation) is an assessment of how much effort and resources will be needed to implement an idea. This is an inversion of the classic labor cost estimate (in person-weeks) - the less effort, the greater the Simplicity.
- Confidence - shows how much we are confident in what impact will be exerted, and also to some extent speaks about the simplicity of implementation. I wrote a whole article explaining why prioritization by effort and value does not work . [ translation of this article in Habré ]. In short, the point is that we are all very bad in the estimates and naively do not suspect it. The Confidence Index serves as an antidote, it helps us to be more accurate in our assumptions.
All three indicators are filled with values on relative scales from 1 to 10, so none of them are overvalued. Each team determines for itself what the indicators 1-10 correspond to, so that each equivalent is relevant. Ultimately, the goal of the assessment is to get an “Ideas Bank”, which looks something like this:
| The idea of the project | Impact, I [0-10] | Confidence, C [0-10] | Simplicity, E [0-10] | ICE [I x C x E] |
|---|---|---|---|---|
| Community tab | 7 | 2 | eight | 112 |
| Update flow | five | five | 3 | 75 |
| Adding PayPal Billing | eight | one | five | 40 |
| Fix bug with check | one | four | 3 | 12 |
Let's look at an example to see how it works.
The first version of ICE
You decided to calculate ICE coefficients for two ideas - a dashboard and a chat bot. At an early stage, you use gross values, based on your own intuition.
Impact - you assume that dashboards will increase retention significantly, but only for some users, so set 5 out of 10. Chat bot, on the other hand, can affect a large number of users, therefore you put 8 out of 10.
Simplicity - you think that dashboards will require 10 man-weeks of development, and chat bot - 20, based solely on data from similar previous projects. You will get better estimates from the development team later, but for now use this simple table (compiled with the team) to convert the estimates into the value of the Simplicity parameter:
| Man weeks | Simplicity |
|---|---|
| Less than 1 week | ten |
| 1-2 weeks | 9 |
| 3-4 weeks | eight |
| 5-6 weeks | 7 |
| 6-7 weeks | 6 |
| 8-9 weeks | five |
| 10-12 weeks | four |
| 13-16 weeks | 3 |
| 17-25 weeks | 2 |
| 26 weeks or more | one |
As a result, the dashboard gets the Simplicity value of 4 out of 10, and the chat bot - 2.
We count the confidence indicator
There is only one way to calculate the Confidence indicator - look at the supporting evidence. To this end, I created a tool that describes the type tests and evidence that you may have, and the values of the Assurance parameter that they have. When you use this tool, consider what artifacts you already have, how many there are and what you need to do to get even more value.
Text on the picture - Level of Confidence:
- About zero:
- Own confidence.
- Presentation.
- Thematic support - consistent with the vision / strategy, current trends / buzzwords, external research, macro trends, product methodology.
- Very low:
- Someone's opinion - the team, management, external experts, investors, the media, someone else thinks that the idea is good.
- Estimates and plans - calculations on napkins, assessment of feasibility, timeline of the project, business model.
- Low - unofficial evidence: based on several aspects of product data, frequent requests for sales, 1-3 interested customers, some of the competitors already have this ...
- Medium-low:
- Market data is evidence based on surveys, smoke tests, all competitors already have this ...
- Evidence from users / clients - based on a large amount of product data, requests from top users, interviews with 20+ users, usability results, MVP launch results.
- Medium - test results: based on long-term user research, results of launching a larger scale MVP, alpha, beta versions, A / B experiments.
- High - data after launch.
Note. If other evidence is used in your product or industry, you can create your own version of the Reliance Tool, just consider what is strong and what is weak evidence. More information in an earlier post (eng.).
Let's go back to our example and look at the Confidence Tool in action.
- Confirming evidence for a chat bot: your own confidence (you think this is a good idea), thematic support (the industry thinks it is a good idea) and the opinions of others (your leaders and colleagues think it is a good idea). This gives you a confidence level of 0.1 out of 10, i.e. about zero. The tool clearly does not consider opinion as a reliable indicator. Interesting.
- The following evidence is available for dashboards: self-confidence (you think this is a good idea), unofficial evidence (a handful of customers asked for it). In fact, this increases the value of the Confidence parameter to a whopping 0.5 out of 10, which means a low level of confidence. Unfortunately, users poorly predict their future behavior.
Calculation of ICE:
| Idea | Influence | Simplicity | Confidence | Ice |
|---|---|---|---|---|
| Dashboard | four | four | 0.5 | eight |
| Chat bot | eight | 2 | 0.1 | 1.6 |
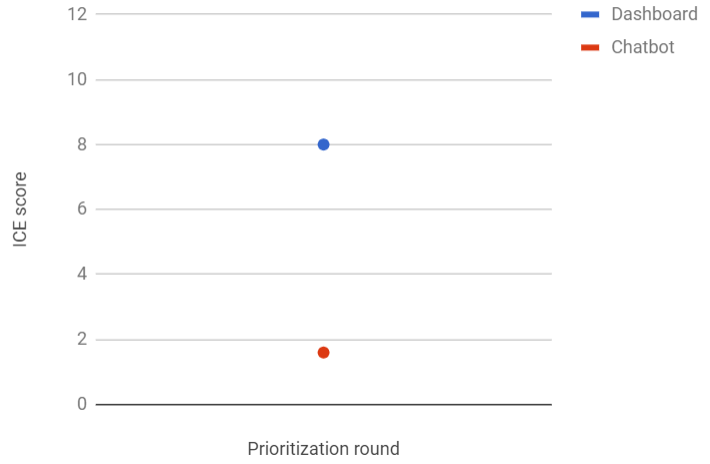
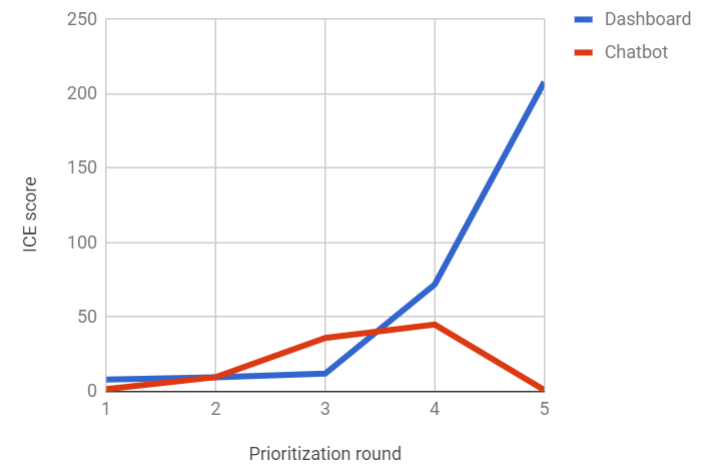
The text in the picture: along the Y axis - the ICE score, along the X axis - the prioritization round. The blue dot is a dashboard, the red dot is a chat bot.
At the moment, dashboards look like a more appropriate idea, but the Tool shows that the level of confidence is low. So far, just not enough information to make a decision.
Estimates and Verification
Next, you meet with colleagues from the development and UX, and then discuss both ideas together. Both projects at first glance seem to be quite feasible. Development Timlid returns with approximate estimates of labor costs: dashboards take 12 man-weeks to run, and chat bot - 16. According to your scale of simplicity, this means indicators 4 and 3, respectively.
In parallel with this, you make calculations on a napkin and update the “Influence” column. Upon closer inspection, the dashboard looks slightly less promising and gets 3. The chat bot still looks solid, at 8.
Using the Confidence Tool shows that both ideas now pass the “Evaluations and Plans” test and get new indicators for the Confidence parameter. Dashboard now has 0.8, chat bot - 0.4.
| Idea | Influence | Simplicity | Confidence | Ice |
|---|---|---|---|---|
| Dashboard | 3 | four | 0.8 | 9.6 |
| Chat bot | eight | 3 | 0.4 | 9.6 |
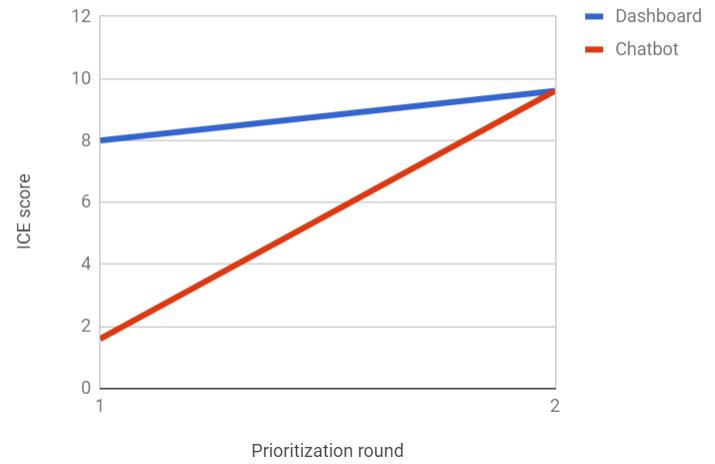
Thus, the chat bot eliminated the gap. However, the level of confidence is still low for a good reason - these are mainly figures obtained from the air, and you understand that you need to gather more evidence.
Market data
You send a survey to current users, asking them to choose one of 5 potential features, the list includes a chat bot and a dashboard. You get hundreds of answers. The results are very positive for chatbot - this is feature number 1, 38% of respondents chose it. Dashboards ranked third with 17% of the vote.
This gives both features a little bit of support from market data, but the chat bot is above 1.5. Dashboards also get an increased value for the “Confidence” column, but so far only up to 1.
| Idea | Influence | Simplicity | Confidence | Ice |
|---|---|---|---|---|
| Dashboard | 3 | four | one | 12 |
| Chat bot | eight | 3 | 1.5 | 36 |
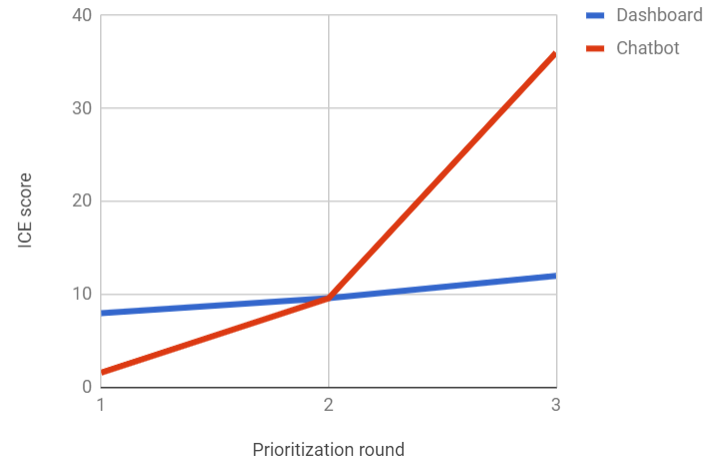
Chat bot is becoming a strong leader. It seems your colleagues and the industry were right. Is it time to pull the trigger? Probably not. Projects are quite expensive and we still have only a little confidence in success. Unfortunately, the survey results do not create a strong enough signal. We continue to work!
Evidence from clients
To learn more, you do research with ten current users, showing them interactive prototypes of each of the features. In parallel, you conduct a telephone interview and interview 20 respondents who must choose one of two candidate functions.
The study shows a more detailed picture:
- 8 out of 10 customers found dashboards useful and said they would use it at least once a week. Their understanding of the functionality coincides with what you wanted to convey and they had no difficulty in working with dashboards. Telephone interviews confirmed understanding and desire to use on average once a week.
- 9 out of 10 study participants said they would use a chat bot, their level of enthusiasm was very high. Everyone immediately understood how a chat bot could help them and many asked to get access as soon as possible. However, major usability issues were identified, plus some users voiced concern that their clients might be unhappy with the bot's unnatural responses.
This qualitative research gave food for thought. Dashboards look more popular than previously thought. A chat bot now looks like a project with higher risks and more potential. Looking at the Reliance Tool, you set the dashboard and chat bot to the values 3 and 2.5, respectively. You update Influence values to 6 for dashboards and 9 for chat bot. Also, from the results of usability research, you understand that the chat bot UI will require more work, so you reduce the Simplicity parameter to 2.
| Idea | Influence | Simplicity | Confidence | Ice |
|---|---|---|---|---|
| Dashboard | 6 | four | 3 | 72 |
| Chat bot | 9 | 2 | 2.5 | 45 |
The table has changed again and now the dashboard is in the lead. You bring results to your team and management. The forecast, based strictly on ICE, declares dashboards to be the winner, on the other hand, the level of Confidence is still far from high. I do not want to let go of a potentially good feature, so the team decides to continue testing both.
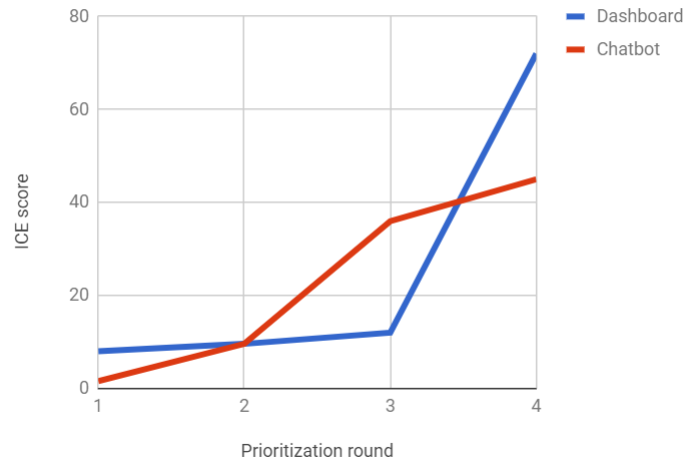
Latest tests and winner!
You decided to start creating a chat bot MVP - development took six weeks and you launched it for the 200 respondents who participated in the previous survey, who voiced a desire to participate in beta testing. 167 included a feature, but the number of uses dropped dramatically from day to day, and by the end of the second week only 24 people were active users. In subsequent surveys and calls, the picture became clearer. The chat bot is more difficult to use and much less useful than the participants expected; worse, it is unfriendly to customers who seem to appreciate personal contact. In fact, this feature makes business owners work harder.
Analyzing the results, you and the team come to the conclusion that launching a convenient chat bot version that will meet customer expectations will require at least 40-50 additional person-weeks (Simplicity = 1) and this is very risky. It is also clear that a much smaller number of users perceive a chat bot as convenient than originally expected. Therefore, you have reduced the Impact to 2. This changes the original idea in a fundamental way, so that you can no longer trust the results of user research and accept them, so reduce the Confidence Index to 0.5.
MVP Dashboard launched in five weeks for another 200 users. The results are very good. 87% of participants use it, the majority daily, the outflow is small. Feedback is extremely positive, most ask for access to full functionality. You understand that the Impact is more than you expected - 8. The development team estimates that the revision of the full version will take 10 weeks, therefore Simplicity 4. According to the tool, you set Confidence to 6.5 out of 10.
| Idea | Influence | Simplicity | Confidence | Ice |
|---|---|---|---|---|
| Dashboard | eight | four | 6.5 | 208 |
| Chat bot | 2 | one | 0.5 | one |
Now prioritization is very simple. Nobody argues that dashboard is the feature that should be dealt with. You leave a chat bot in your Ideas Bank to record future finds, but it is naturally sorted to the very end because of the low ICE rate.
Total
1. Stop investing in bad ideas.
This example illustrates how risky it is to bet on features that require a lot of effort and are based on flair, opinions, market trends, etc. Most of the ideas are more like a chat bot than a dashboard. They bring less results and cost much more than you think. The only way to find winning ideas is to test them and reduce the level of uncertainty.
2. Worry about results, not features.
It looks like a time consuming and slow way to create products, but in fact it is a more efficient way than alternatives. Testing to determine the Confidence indicator not only reduces the amount of wasted effort to bad ideas, but also focuses teams on short and tangible learning milestones with quick measurable results, which improves focus and performance. In the process, we learn a lot about our product, users, market and as a result we have the best final product, which has already been tested by customers. For this reason, we are less often surprised by the results of the launch and corrections are required much less.
3. Let thousands of flowers bloom
In reality, we often have to make a choice not between two ideas, but between dozens. By limiting the amount of effort to each, given the level of Confidence, we are able to test in parallel a multitude of ideas, avoiding the traps of the traditional approach to development. You can read more about this in the article “Why you should stop using grocery roadmap and try GIST” .

In this example, the team tests four ideas in parallel, launching several step-projects. Each one improves the idea incrementally, as a result of testing, increasing the level of confidence in the results.
4. How to drag management and stakeholders to your side
What worries people most of all when I explain this topic is the question of how to “sell” it to management and stakeholders. Can we actually force them to limit their level of influence on the product? Well, you will be surprised. I heard from many executives that they would prefer not to make decisions on product issues, but if the team offers weak options, they feel the need to get involved. That there are weak and strong options is, of course, a subjective opinion, as long as you show not just a polished presentation, but come with real, credible evidence. You will be very surprised when you understand how much easier the discussion is. On the other hand, the next time your CEO comes up with a regular batch of must-have ideas, try to show him how such ideas are evaluated: what indicators of Influence, Simplicity and Confidence do you indicate which ICE coefficient is finally obtained, how does the comparison with others ideas and how you can test them to increase your confidence.
Most intelligent people will agree that this is a good way. If they are still not convinced, throw off a link to this translation or the original post Itamar , where he is ready to defend this approach in the comments.
In the united company “Wheels | Roof | Market ”we are looking for product managers who are ready to experiment, quickly and inexpensively testing hypotheses. You can apply for a job on Headhunter and the corporate website .
')
Source: https://habr.com/ru/post/425833/
All Articles