How Yandex created a global precipitation forecast using radars and satellites
The Yandex team. There is a tradition to talk about new technologies in Habré. We have already described how machine learning methods allowed us to create a more accurate weather forecast, as well as how neural networks and radar data help predict precipitation.
Today we will tell Habr readers about the new technology, with the help of which we were able to achieve precipitation prediction up to minutes even where radar data is simply not available. And satellite imagery helped us in this.
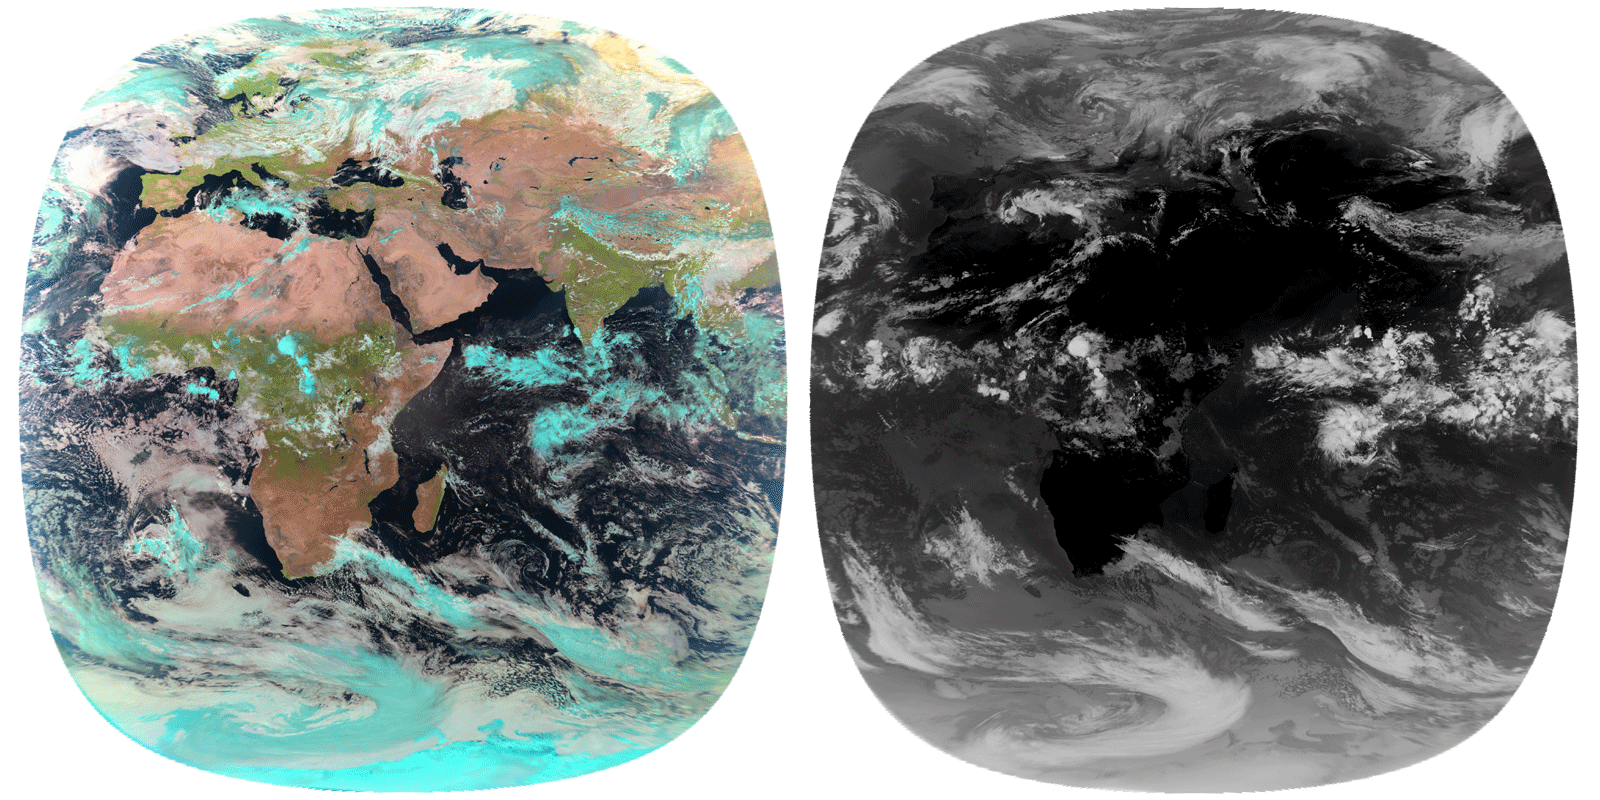
Pictures of the satellite Meteosat-8 from space (source: EUMETSAT )
Residents of the central part of Russia were incredibly lucky, because it is here that Rosgidromet's meteorological radars are installed - modern tools that allow you to receive a precipitation map within a radius of 250 kilometers from the radar installation point. At the same time, the spatial resolution of this map is 2x2 kilometers per pixel, and the interval between two successive images is only 10 minutes.
')
 The left shows what the weather radar looks like (source: LEMP )
What does this mean for the average person who is interested in the weather? In areas covered by a radar umbrella, precipitation can be reported with an accuracy to a residential quarter. Such data greatly clarify the traditional weather forecast, because they carry information about what happened just a few tens of minutes ago. More details about the benefits of radar are written in our previous article . Now consider their shortcomings.
The main one is poor scalability, due to the huge cost of such a measuring instrument and the complexity of the design. Recall that now radar covered only part of the European territory of Russia, as well as Barabinsk and Vladivostok. In addition, radar observations suffer from buildings around - for example, high buildings can block the view in entire sectors, which affects the quality of the precipitation fields obtained from radar images. An example of how observations of several months averaged over each of the available radars may appear is shown in the illustration below.
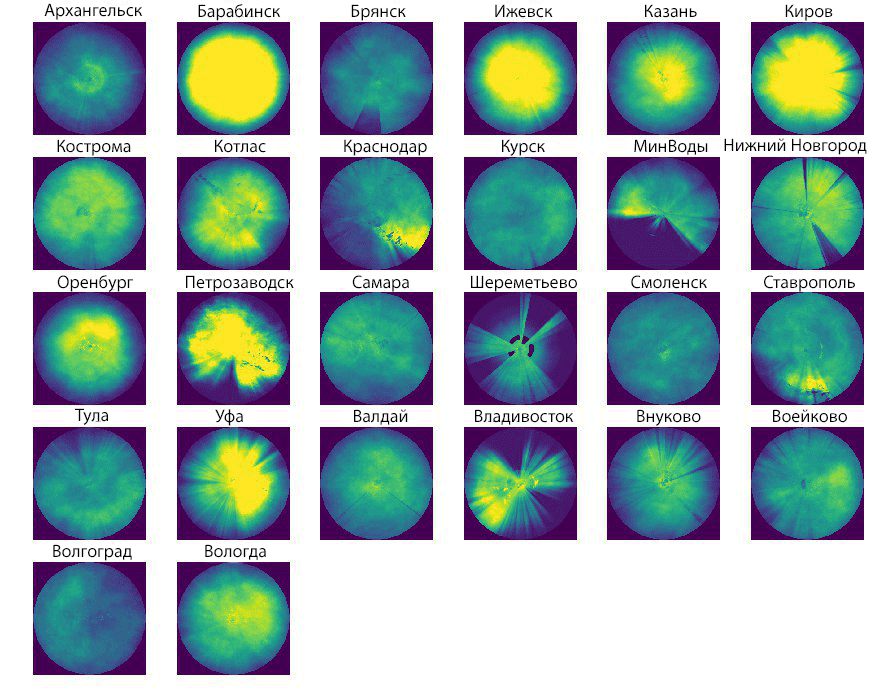
Averaged data on radar measurements over several months
As you can see, the quality of radars installed in Sheremetyevo and Vladivostok suffers greatly, and a whole sector falls out in Mineralnye Vody.
 We see this on complaints from our users. Also, in case of low precipitation, the radar may not be visible over all 250 kilometers due to the curvature of the Earth’s surface, which affects the ability to determine precipitation closer to the visibility limit. In addition, radar fails, sometimes for a long time, because of which our users suffer, who are used to rainfall maps and rain warnings. Because of this, for example, there are unexpected “explosions” in the field of precipitation, as it was recently in Vologda. Which, of course, becomes the reason for the squall of all kinds of memes.
In order not to be tied to radars, we decided to literally make a space product, as the title picture hints at. In addition to radar measurements, there are similar approaches to estimating precipitation based on satellite images. There is a grouping of special meteorological satellites (about 30 devices are in orbit): both polar-orbital satellites that cover the Earth with images just like a thread is wound on a ball, and geostationary satellites - satellites are at an altitude of about 36,000 kilometers from the Earth’s surface and rotate synchronously with Earth's rotation over the equator. The peculiarity of the orbit of satellites of the second type allows one to constantly “hang” over the same point and receive the same pictures as at the beginning of the article. The satellite grouping of geostationaries makes it possible to cover almost the entire Earth with observations using European satellites ( Meteosat ), American ( GOES ) and Japanese ( Himawari ) for these purposes. Products based on them have a spatial resolution of 0.5 to 3 kilometers per pixel, but there is a problem. The satellites hang over the equator, so our latitudes fall on the very edge of the image, because of which the data suffer from geometric distortions.
The idea of using satellite images for weather forecasting is not new - information from them is used in traditional global weather forecasting models. In addition, useful information is extracted from satellite images: from monitoring volcanic ash and forest fires to searching for phytoplankton. Of course, satellite imagery is also used to monitor precipitation and its short-term forecasting. For example, there are standard algorithms for detecting areas with precipitation - SAFNWC , but they work well only for the case of convective precipitation. According to our strict metrics that we use for the radar science, such algorithms, alas, turn out to be outsiders. We wanted to make a quality product comparable to the current solution on radar data, but at the same time globally scalable. To do this, we took the strengths of each of the approaches and applied the magic of machine learning.
After the first experiments on standard algorithms, we decided that satellite science would be in Weather. But then the first problem arose: where to get satellite images? In the digital age, it would seem, there should be no problems with obtaining satellite information. On the Internet you can find everything ... except what you need. With satellites, the situation is as follows: to quickly receive images from space, you must install a receiving station. The standard set includes a satellite dish, a DVB-S tuner and a computer on which images are stored and processed. Yes, the technology is completely analogous to satellite television, only the dish is slightly larger than human growth, and the tuner is slightly more expensive.
Thus, in our new DC in Vladimir, we have our own satellite information receiving station. Data for it comes from the second-generation European satellites of the Meteosat series. To cover the western part of the territory of Russia, we chose the satellite Meteosat-8, which hangs over the Indian Ocean at a longitude of 41.5 °. Pictures are taken every 15 minutes - during them a full scan of the visible region of the satellite takes place, after which the scan begins anew. Because of this, the pictures are 15 minutes behind real time. The shooting takes place in 12 channels: 11 channels in the visible and infrared ranges with a resolution of 3x3 kilometers, and 1 channel in the visible spectrum with a resolution of 1x1 kilometers (an example of shooting in different channels is shown on the right, source: EUMETSAT ). The full picture has a resolution of 3712x3712 pixels or about 14 megapixels, like a camera of a modern smartphone.
The picture is divided into 8 parts (stripes by latitude), which sometimes affects the quality of the data - the loss of one part can render the entire picture useless.
Since our first experiments showed that the quality of the product when using traditional approaches suffers, we decided to use what brought us success in the case of ordinary science. Neural networks came to the rescue. We used information from 11 channels of satellite imagery as input parameters, and we studied them on radar images combined into a single field on a 2x2 km grid. We used traditional approaches that solve similar problems in computer vision. Until recently, two architectures based on ResNet-like (for irina-rud ) and U-Net-like (for illusionww ) models competed .
ResNet is used in image classification tasks and can be very deep, while increasing the number of layers gives a steady increase in quality. However, this architecture has drawbacks in use - we have to apply a trained model at every point of our geographic grid. As an alternative, U-net was chosen - the convolutional neural network architecture, which is usually used in image segmentation tasks. It was originally developed for biomedical purposes for quick work with large images. With this architecture, we can quickly test our hypotheses, in addition, we can use the trained model not pointwise, which significantly affects the speed of processing satellite images. Below is a comparison of the metrics obtained for the two architectures. Since we managed to bring the U-net model in quality to ResNet, but at the same time U-net allows us to process satellite images faster, we used it as a production solution.

This graph shows the F1 measure - the standard metric in classification problems, which shows how our satellite deposits differ from radar ones. With a perfect match, it should be equal to one. As can be seen from the graph, the quality of precipitation detection depends on the time of day, as the image in the visible range is an important source of information.
The task is complicated by the fact that it is necessary not only to highlight the cloud in the image, but also to determine whether it will rain from it. During the experiments, we found that information from 11 channels is not enough. To make a high-quality product, it is important to take into account such parameters as the angle of the sun above the horizon, the height of the relief, data for the coming hours from the meteorological model, for example, moisture storage of clouds, humidity in the atmosphere at various levels, etc.
 As a result, the trained model allows precipitation with high accuracy. So the figure shows the deposition of precipitation by satellites and a radar field. Here, violet is the color of satellites outside the radar, crimson is the intersection of radar and satellites, blue is what satellites detect but do not detect radar, and red is what only radars have detected. The figure shows a slight systematic shift to the north, due to the fact that we detect rain not from below the clouds, as radars do, but from above, from space and at an angle. This problem will be fixed in the next release, which will affect the increase in accuracy.
Since the technology is quite new, we decided not to abandon the radar, and leave them in places where our users have become accustomed to using science. Here the problem arises: how to display products that differ in measurement method in one interface. We decided on a bold experiment - to show radar and satellites in a single, user-friendly interface of the radar science, expanding the area using satellites. For this, a huge amount of work has been done, as we need, first, to coordinate the satellites and radars in time, and, second, to glue them properly on the border of the radar visibility.
To bring 15-minute satellite images to 10-minute intervals, already familiar to our users, we use Optical Flow to create intermediate frames between consecutive satellite images. Optical flow or optical flow is a technology that is used in computer vision to determine the shifts between images. Using two images, we can construct a field of image displacement vectors at each point — one that allows us to get the following from the previous image. With the help of transfer vectors, we can also get intermediate frames to bring them to a single time scale at 10-minute intervals. The same algorithm ( due to bonext and ruguevara ) is still used to forecast 2 hours ahead with a 10-minute resolution for satellite images, and radars are computed using the old proven algorithm based on neural networks described in our radar science article. In the next update, we plan to fully switch to transferring the entire precipitation field using neural network architecture.
When gluing up heterogeneous data, of course, sometimes artifacts arise, for example, as in the figure to the left.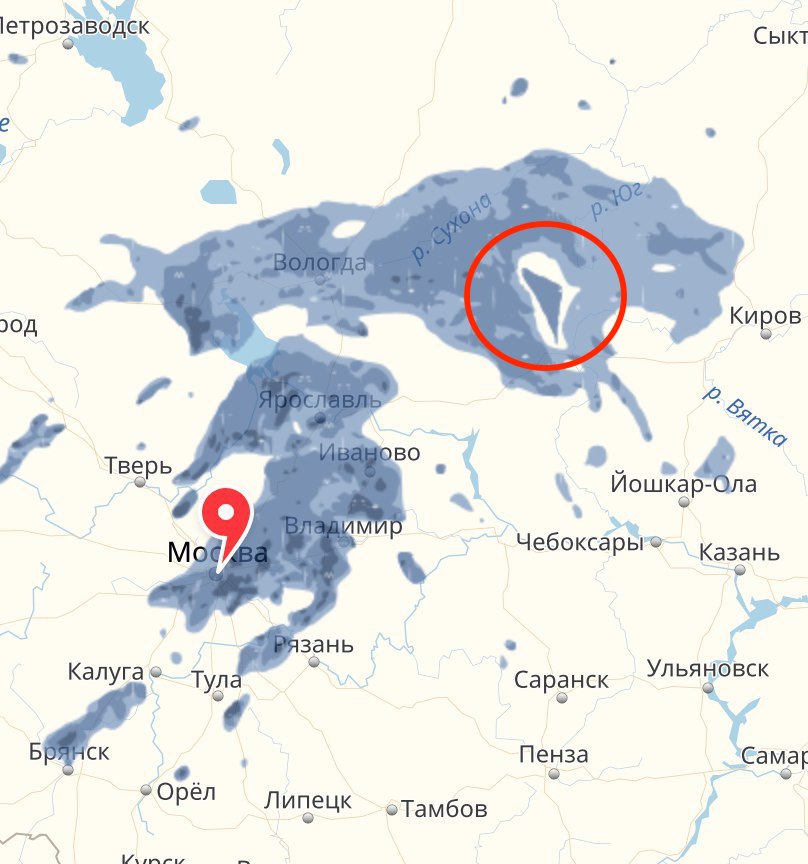 The problem typical for radars is noticeable here: on the border of visibility, they do not see precipitation, and information from a satellite that successfully detects rain falls into the triangle between them. Thinking about solving the problem of gluing two data areas of different nature, we remembered such a task as inpainting. Nvidia in its recent article Image Inpainting for Irregular Holes Using Partial Convolutions shows how neural networks are able to restore image details by irregular masks. At Yet Another Conference, it was described how Dmitry Ulyanov restored the fresco using inpainting. We plan to use the same approach in our case, and there are already successful developments that will soon go to production, which will allow us to correctly take into account heterogeneous information from various sources about the fact of rain.
Right now, 100% of our users are working with science, built on both radar and satellite measurements (thanks to space support of imalion and the work of backend and front teams). We hope our users who have been waiting for science in their city have begun to use it and receive timely information about the impending precipitation. At the moment, the zone bounded by the visible area of the satellite itself in the north and east (just east of the Ob River) is covered. In the south, we have so far limited the zone to the bottom of Cyprus, and in the west to Switzerland. Now you can look at the approaching fronts still on the way to your city and watch the beautiful weather quirks. And the difference in coverage is visible to the naked eye.
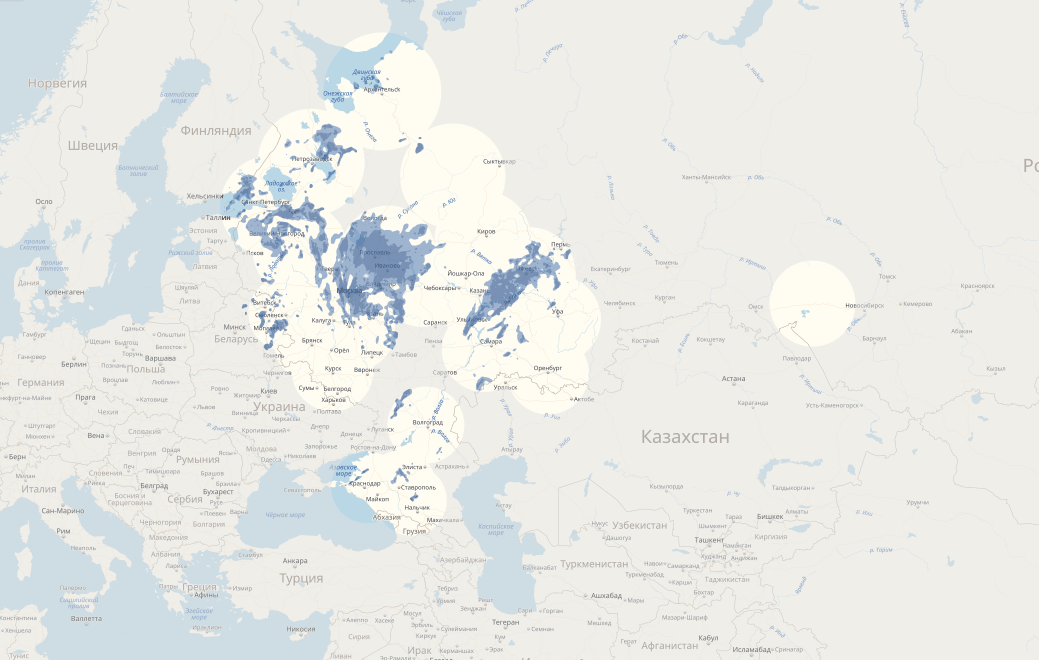
Thus, we have covered most of Russia, the CIS and some tourist destinations. Of course, we have not forgotten about the eastern part of our country - we are already working with the Japanese satellite Himawari, which hangs over Australia and will soon allow us to enjoy our eastern frontier with science.
And then - a global map of precipitation for the whole world, free from childhood diseases, with increased accuracy of precipitation detection, a single transfer algorithm and the correct gluing of all precipitation data.
Stay with us, use science, share your impressions and reviews.
Today we will tell Habr readers about the new technology, with the help of which we were able to achieve precipitation prediction up to minutes even where radar data is simply not available. And satellite imagery helped us in this.
Pictures of the satellite Meteosat-8 from space (source: EUMETSAT )
About radar and science
Residents of the central part of Russia were incredibly lucky, because it is here that Rosgidromet's meteorological radars are installed - modern tools that allow you to receive a precipitation map within a radius of 250 kilometers from the radar installation point. At the same time, the spatial resolution of this map is 2x2 kilometers per pixel, and the interval between two successive images is only 10 minutes.
')
The left shows what the weather radar looks like (source: LEMP )What does this mean for the average person who is interested in the weather? In areas covered by a radar umbrella, precipitation can be reported with an accuracy to a residential quarter. Such data greatly clarify the traditional weather forecast, because they carry information about what happened just a few tens of minutes ago. More details about the benefits of radar are written in our previous article . Now consider their shortcomings.
The main one is poor scalability, due to the huge cost of such a measuring instrument and the complexity of the design. Recall that now radar covered only part of the European territory of Russia, as well as Barabinsk and Vladivostok. In addition, radar observations suffer from buildings around - for example, high buildings can block the view in entire sectors, which affects the quality of the precipitation fields obtained from radar images. An example of how observations of several months averaged over each of the available radars may appear is shown in the illustration below.
Averaged data on radar measurements over several months
As you can see, the quality of radars installed in Sheremetyevo and Vladivostok suffers greatly, and a whole sector falls out in Mineralnye Vody.
We see this on complaints from our users. Also, in case of low precipitation, the radar may not be visible over all 250 kilometers due to the curvature of the Earth’s surface, which affects the ability to determine precipitation closer to the visibility limit. In addition, radar fails, sometimes for a long time, because of which our users suffer, who are used to rainfall maps and rain warnings. Because of this, for example, there are unexpected “explosions” in the field of precipitation, as it was recently in Vologda. Which, of course, becomes the reason for the squall of all kinds of memes.Satellites as a source of information
In order not to be tied to radars, we decided to literally make a space product, as the title picture hints at. In addition to radar measurements, there are similar approaches to estimating precipitation based on satellite images. There is a grouping of special meteorological satellites (about 30 devices are in orbit): both polar-orbital satellites that cover the Earth with images just like a thread is wound on a ball, and geostationary satellites - satellites are at an altitude of about 36,000 kilometers from the Earth’s surface and rotate synchronously with Earth's rotation over the equator. The peculiarity of the orbit of satellites of the second type allows one to constantly “hang” over the same point and receive the same pictures as at the beginning of the article. The satellite grouping of geostationaries makes it possible to cover almost the entire Earth with observations using European satellites ( Meteosat ), American ( GOES ) and Japanese ( Himawari ) for these purposes. Products based on them have a spatial resolution of 0.5 to 3 kilometers per pixel, but there is a problem. The satellites hang over the equator, so our latitudes fall on the very edge of the image, because of which the data suffer from geometric distortions.
Satellite Image Forecast
The idea of using satellite images for weather forecasting is not new - information from them is used in traditional global weather forecasting models. In addition, useful information is extracted from satellite images: from monitoring volcanic ash and forest fires to searching for phytoplankton. Of course, satellite imagery is also used to monitor precipitation and its short-term forecasting. For example, there are standard algorithms for detecting areas with precipitation - SAFNWC , but they work well only for the case of convective precipitation. According to our strict metrics that we use for the radar science, such algorithms, alas, turn out to be outsiders. We wanted to make a quality product comparable to the current solution on radar data, but at the same time globally scalable. To do this, we took the strengths of each of the approaches and applied the magic of machine learning.
Meteosat as a source of information
After the first experiments on standard algorithms, we decided that satellite science would be in Weather. But then the first problem arose: where to get satellite images? In the digital age, it would seem, there should be no problems with obtaining satellite information. On the Internet you can find everything ...
except what you need. With satellites, the situation is as follows: to quickly receive images from space, you must install a receiving station. The standard set includes a satellite dish, a DVB-S tuner and a computer on which images are stored and processed. Yes, the technology is completely analogous to satellite television, only the dish is slightly larger than human growth, and the tuner is slightly more expensive.Thus, in our new DC in Vladimir, we have our own satellite information receiving station. Data for it comes from the second-generation European satellites of the Meteosat series. To cover the western part of the territory of Russia, we chose the satellite Meteosat-8, which hangs over the Indian Ocean at a longitude of 41.5 °.
Pictures are taken every 15 minutes - during them a full scan of the visible region of the satellite takes place, after which the scan begins anew. Because of this, the pictures are 15 minutes behind real time. The shooting takes place in 12 channels: 11 channels in the visible and infrared ranges with a resolution of 3x3 kilometers, and 1 channel in the visible spectrum with a resolution of 1x1 kilometers (an example of shooting in different channels is shown on the right, source: EUMETSAT ). The full picture has a resolution of 3712x3712 pixels or about 14 megapixels, like a camera of a modern smartphone.The picture is divided into 8 parts (stripes by latitude), which sometimes affects the quality of the data - the loss of one part can render the entire picture useless.
Precipitation detection
Since our first experiments showed that the quality of the product when using traditional approaches suffers, we decided to use what brought us success in the case of ordinary science. Neural networks came to the rescue. We used information from 11 channels of satellite imagery as input parameters, and we studied them on radar images combined into a single field on a 2x2 km grid. We used traditional approaches that solve similar problems in computer vision. Until recently, two architectures based on ResNet-like (for irina-rud ) and U-Net-like (for illusionww ) models competed .
ResNet is used in image classification tasks and can be very deep, while increasing the number of layers gives a steady increase in quality. However, this architecture has drawbacks in use - we have to apply a trained model at every point of our geographic grid. As an alternative, U-net was chosen - the convolutional neural network architecture, which is usually used in image segmentation tasks. It was originally developed for biomedical purposes for quick work with large images. With this architecture, we can quickly test our hypotheses, in addition, we can use the trained model not pointwise, which significantly affects the speed of processing satellite images. Below is a comparison of the metrics obtained for the two architectures. Since we managed to bring the U-net model in quality to ResNet, but at the same time U-net allows us to process satellite images faster, we used it as a production solution.
This graph shows the F1 measure - the standard metric in classification problems, which shows how our satellite deposits differ from radar ones. With a perfect match, it should be equal to one. As can be seen from the graph, the quality of precipitation detection depends on the time of day, as the image in the visible range is an important source of information.
The task is complicated by the fact that it is necessary not only to highlight the cloud in the image, but also to determine whether it will rain from it. During the experiments, we found that information from 11 channels is not enough. To make a high-quality product, it is important to take into account such parameters as the angle of the sun above the horizon, the height of the relief, data for the coming hours from the meteorological model, for example, moisture storage of clouds, humidity in the atmosphere at various levels, etc.
As a result, the trained model allows precipitation with high accuracy. So the figure shows the deposition of precipitation by satellites and a radar field. Here, violet is the color of satellites outside the radar, crimson is the intersection of radar and satellites, blue is what satellites detect but do not detect radar, and red is what only radars have detected. The figure shows a slight systematic shift to the north, due to the fact that we detect rain not from below the clouds, as radars do, but from above, from space and at an angle. This problem will be fixed in the next release, which will affect the increase in accuracy.Satellite science
Since the technology is quite new, we decided not to abandon the radar, and leave them in places where our users have become accustomed to using science. Here the problem arises: how to display products that differ in measurement method in one interface. We decided on a bold experiment - to show radar and satellites in a single, user-friendly interface of the radar science, expanding the area using satellites. For this, a huge amount of work has been done, as we need, first, to coordinate the satellites and radars in time, and, second, to glue them properly on the border of the radar visibility.
To bring 15-minute satellite images to 10-minute intervals, already familiar to our users, we use Optical Flow to create intermediate frames between consecutive satellite images. Optical flow or optical flow is a technology that is used in computer vision to determine the shifts between images. Using two images, we can construct a field of image displacement vectors at each point — one that allows us to get the following from the previous image. With the help of transfer vectors, we can also get intermediate frames to bring them to a single time scale at 10-minute intervals. The same algorithm ( due to bonext and ruguevara ) is still used to forecast 2 hours ahead with a 10-minute resolution for satellite images, and radars are computed using the old proven algorithm based on neural networks described in our radar science article. In the next update, we plan to fully switch to transferring the entire precipitation field using neural network architecture.
When gluing up heterogeneous data, of course, sometimes artifacts arise, for example, as in the figure to the left.
The problem typical for radars is noticeable here: on the border of visibility, they do not see precipitation, and information from a satellite that successfully detects rain falls into the triangle between them. Thinking about solving the problem of gluing two data areas of different nature, we remembered such a task as inpainting. Nvidia in its recent article Image Inpainting for Irregular Holes Using Partial Convolutions shows how neural networks are able to restore image details by irregular masks. At Yet Another Conference, it was described how Dmitry Ulyanov restored the fresco using inpainting. We plan to use the same approach in our case, and there are already successful developments that will soon go to production, which will allow us to correctly take into account heterogeneous information from various sources about the fact of rain.What's next?
Right now, 100% of our users are working with science, built on both radar and satellite measurements (thanks to space support of imalion and the work of backend and front teams). We hope our users who have been waiting for science in their city have begun to use it and receive timely information about the impending precipitation. At the moment, the zone bounded by the visible area of the satellite itself in the north and east (just east of the Ob River) is covered. In the south, we have so far limited the zone to the bottom of Cyprus, and in the west to Switzerland. Now you can look at the approaching fronts still on the way to your city and watch the beautiful weather quirks. And the difference in coverage is visible to the naked eye.
Thus, we have covered most of Russia, the CIS and some tourist destinations. Of course, we have not forgotten about the eastern part of our country - we are already working with the Japanese satellite Himawari, which hangs over Australia and will soon allow us to enjoy our eastern frontier with science.
And then - a global map of precipitation for the whole world, free from childhood diseases, with increased accuracy of precipitation detection, a single transfer algorithm and the correct gluing of all precipitation data.
Stay with us, use science, share your impressions and reviews.
Source: https://habr.com/ru/post/425517/
All Articles