What's new in the first CTP edition of SQL Server 2019
On September 24, the first CTP release of SQL Server 2019 was introduced, and let me say that it is filled with all sorts of improvements and new features (many of which can be found in the form of a preview in the SQL Azure database). I had an exceptional opportunity to get to know this a little earlier, which allowed me to expand the idea of change, even if only superficially. You can also read the latest publications from the SQL Server team and updated documentation .
Without going into details, I'm going to discuss the following new kernel functions: performance, troubleshooting, security, availability, and development. At the moment I have a little more details than the others, and some of them are already prepared for publication. I will return to this section, as well as to many other articles and documentation, and publish them. I hasten to inform you that this is not a comprehensive review, but only part of the functionality that I managed to “touch”, up to CTP 2.0. There is still a lot to talk about.
Table variables have a poor reputation, mostly in the area of valuation. By default, SQL Server assumes that a table variable can contain only one row, which sometimes leads to an inadequate choice of plan, when the variable will contain several times more rows. OPTION (RECOMPILE) is usually used as a workaround, but it requires changing the code and it is wasteful with respect to resources — to perform a rebuilding each time, while the number of lines is most often the same. To emulate a rebuild, trace flag 2453 was entered, but it also requires a launch with a flag, and only works when a significant change occurs in the rows.
In compatibility level 150, deferred construction is performed if table variables are present and the query plan is not built until the table variable is filled once. The cost estimate will be made based on the results of the first use of the table variable, without further rebuilding. This is a trade-off between constant rebuilding, to get an accurate cost, and the complete absence of rebuilding with a constant cost of 1. If the number of lines remains relatively constant, then this is a good indicator (and even better if the number exceeds 1), but it may be less profitable if there is a large variation in the number of lines.
')
I presented a deeper analysis in a recent article Table Variables: Delayed Construction in SQL Server , and Brent Ozar also talked about this in the article Fast Table Variables (And new problems of parameter analysis) .
SQL Server 2017 has batch mode feedback on memory, which is described in detail here . Essentially, for any memory allocation associated with a query plan that includes batch mode operators, SQL Server will evaluate the memory used by the query and compare it with the requested memory. If the requested memory is too little or too much, which leads to drains in tempdb or a waste of memory, then the next time you start, the allocated memory for the corresponding query plan will be adjusted. This behavior will either reduce the amount allocated and increase concurrency, or increase it to improve performance.
Now we get the same behavior for queries in string mode, under compatibility level 150. If the query was forced to merge data to disk, then for subsequent runs, the allocated memory will be increased. If, in fact, the request was completed, it took half the memory than was allocated, then for subsequent requests it will be adjusted to the bottom. Brett Ozar describes this in more detail in his article Conditional Memory Allocation .
Beginning with SQL Server 2012, queries on column index tables benefited from improved performance in batch mode. Performance improvements are due to the request handler performing batch rather than line-by-line processing. Strings are also processed by the storage core in batches, which makes it possible to avoid parallelism exchange operators. Paul White ( @SQL_Kiwi ) reminded me that if you use an empty column-storage table to make batch mode operations possible, the processed rows will be packaged by an invisible operator. However, this crutch can nullify any improvements received from batch processing. Some information about this is in response to the Stack Exchange .
At compatibility level 150, SQL Server 2019 will automatically select batch mode in certain cases as the golden mean, even when there are no column indices. You might think that why not just create a column index and the matter is in a hat? Or continue to use the crutch mentioned above? This approach was also extended to traditional objects with line-by-line storage, because columnar indexes are not always possible for several reasons, including functional limitations (for example, triggers), costs during high-load update or delete operations, and the lack of support from third-party manufacturers. And from that crutch nothing good can be expected.
I created a very simple table with 10 million rows and one clustered index on an integer column and launched this query:
The plan clearly shows the search by clustered index and parallelism, but not a word about the column index (as shown by SentryOne Plan Explorer ):
But if you dig a little deeper, you can see that almost all operators were executed in batch mode, even sorting and scalar calculations:

You can disable this feature by remaining at a lower compatibility level by changing the database configuration or by using the DISALLOW_BATCH_MODE hint in the query:
In this case, an additional exchange operator appears, all operators are executed in row mode, and the query execution time is increased almost three times.

Up to a certain level, you can see it in the diagram, but in the details tree of the plan, you can also see the effect of the selection condition, unable to eliminate rows, until sorting has occurred:

The choice of packet mode is not always a good step - the heuristics included in the decision-making algorithm takes into account the number of rows, the types of expected operators and the expected benefits of the packet mode.
This new aggregate function is intended for data warehousing scenarios and is equivalent to COUNT (DISTINCT ()). However, instead of performing expensive sorting, to determine the actual quantity, the new function relies on statistics to obtain relatively accurate data. It should be understood that the error lies within 2% of the exact amount, and in 97% of cases that are the norm for high-level analytics, these are the values displayed on the indicators or used for quick assessments.
In my system, I created a table with integer columns that include unique values in the range from 100 to 1,000,000, and string columns, with unique values in the range from 100 to 100,000. There were no indexes in it except the clustered primary key in the first integer column. Here are the results of running COUNT (DISTINCT ()) and APPROX_COUNT_DISTINCT () on these columns, from which you can see small discrepancies (but always within 2%):
The win is huge, if there is a memory limit, which applies to most of us. If you look at the query plans, in this particular case, you can see a huge difference in memory consumption by the hash match operator:

Note that you will usually notice only significant performance improvements if you are already memory bound. In my system, execution lasted a little longer due to the strong CPU utilization of the new function:

Perhaps the difference would be more significant if I had larger tables, less memory, available SQL Server, higher concurrency, or some combination of the above.
Do you have a specific query that works better under a certain compatibility level different from the current database? This is now possible, due to new query hints, supporting six different levels of compatibility and five different models for estimating the number of elements. The following are available compatibility levels, an example of syntax, and a compatibility level model that is used in each case. See how this affects your ratings, even for system views:

In short: there is no longer any need to remember the trace flags, or to ask whether you need to worry about whether the TF 4199 patch for the query optimizer is being distributed, or whether it has been canceled by some other update package. Please note that these additional hints recently were also added for SQL Server 2017 in cumulative update No. 10 (see Pedro Lopez’s blog for details). You can see all available hints with the following command:
But do not forget that prompts are an exceptional measure, they are often suitable for getting out of a difficult situation, but they should not be planned for long-term use, as with subsequent updates their behavior may change.
To understand this improvement, we need to remember a few points. In SQL Server 2014, the DMV view sys.dm_exec_query_profiles appeared, allowing the user performing the query to collect diagnostic information about all the operators in all parts of the query. The collected information becomes available after the completion of the query and allows you to determine which operators actually spent the main resources and why. Any user who failed to make a specific request could get this data for any session that included the STATISTICS XML or STATISTICS PROFILE statement, or for all sessions, using the extended query_post_execution_showplan event, although this event may affect overall performance.
Management Studio 2016 has added functionality that allows you to display data streams passing through the query plan in real time based on information collected from the DMV, which makes it even more powerful to find and fix problems. Plan Explorer also offers the ability to visualize data passing through a query, both in real time and in playback mode.
Starting with SQL Server 2016 SP1, you can also enable the light version of collecting this data for all sessions using the 7412 trace flag or the extended property query_thread_profile, which allows you to immediately get up-to-date information about any session without having to include it explicitly (in particular, things that adversely affect performance). More on this in Pedro Lopez's blog .
In SQL Server 2019, this feature is enabled by default, so you do not need to run any sessions with extended events or use any trace flags and STATISTICS instructions in any query. Just look at the data from the DMV at any time for all parallel sessions. But it is possible to disable this mode using LIGHTWEIGHT_QUERY_PROFILING, however, this syntax does not work in CTP 2.0 and will be fixed in subsequent editions.
In current versions of SQL Server, when cloning a database, only original object statistics from clustered column indexes are used, not counting updates made in the table after its creation. If you use a clone to tune queries and other performance tests, which are based on power estimates, then these examples may not be appropriate. Parikshit Savyani described the limitations in this publication and provided a temporary solution - before creating a clone, you need to make a script that executes DBCC SHOW_STATISTICS ... WITH STATS_STREAM for each object. It is expensive and, of course, easy to forget.
In SQL Server 2019, this updated statistics will be automatically available in the clone, so you can test various query scenarios and get objective plans based on real statistics without manually starting STATS_STREAM for all tables.
In current versions, the sys.sp_estimate_data_compression_savings procedure has the following check:
This means that it allows you to check the compression of a line or page (or see the result of deleting the current compression). In SQL Server 2019, this check now looks like this:
This is great news because it allows you to roughly predict the effect of adding a column index to a table that does not contain it, or convert tables or partitions to an even more compressed format of column storage, without having to restore this table to another system. I had a talitsa with 10 million rows, for which I performed a stored procedure with each of the five parameters:
Results:

As in the case of other types of compression, the accuracy depends entirely on the available strings and the representativeness of the remaining data. Nevertheless, it is quite a powerful way to get presumptive results without much difficulty.
For a long time, the DBCC PAGE and DBCC IND commands were used to gather information about pages containing a section, index, or table. But they are undocumented and unsupported, and it can be tedious enough to automate the solution of problems associated with several indexes or pages.
Later, a dynamic administrative function (DMF) sys.dm_db_database_page_allocations appeared, which returns a set representing all pages in the specified object. Still undocumented and flawed, which can be a real problem on large tables: even to get information about a single page, it has to read the entire structure, which can be quite expensive.
In SQL Server 2019, another DMF appeared - sys.dm_db_page_info. Basically, it returns all the information about the page, without the overhead of the DMF distribution. However, to use the function in current builds, you must know in advance the number of the page you are looking for. Perhaps such a step was made intentionally, because This is the only way to ensure performance. So if you are trying to identify all pages in an index or table, you still need to use DMF distributions. In the next article I will describe this question in more detail.
Currently, persistent encryption protects sensitive data during transmission and in memory by encrypting / decrypting at each end of the process. Unfortunately, this often leads to serious limitations when working with data, such as the inability to perform calculations and filtering, so you have to pass the entire data set to the client to perform, say, a search by range.
A secure environment (enclave) is a protected area of memory where such calculations and filtering can be delegated ( virtualization-based security is used in Windows) —the data remains encrypted in the kernel, but can be safely decrypted or encrypted in a secure environment. You just need to add the ENCLAVE_COMPUTATIONS parameter to the primary key using SSMS, for example, by selecting the checkbox “Allow calculations in a secure environment”:
Now you can encrypt data almost instantly compared to the old method (in which the master, the Set-SqlColumnEncyption cmdlet or your application, would have to completely get the entire set from the database, encrypt it, and send it back):
I think that for many organizations this improvement will be the main news, however in the current CTP some of these subsystems are still being improved, so by default they are turned off, but here you can see how to turn them on.
Managing SSL and TLS certificates has always been a pain, and many people have had to do the tedious work of creating their own scripts to deploy and maintain their enterprise certificates. The updated Configuration Manager for SQL Server 2019 helps you quickly view and verify certificates of any instance, find certificates that will expire soon, and synchronize certificate deployments across all replications in the availability group or all nodes in a failover cluster instance.
I have not tried all these operations, but they should work for previous versions of SQL Server, if management occurs from the SQL Server 2019 Configuration Manager.
The SQL Server team has added the ability to classify data in SSMS 17.5, allowing you to define any columns that may contain sensitive information or contradict various standards (HIPAA, SOX, PCI, and GDPR, of course). The wizard will use an algorithm that suggests columns that are expected to cause problems, but you can either adjust its proposal by removing these columns from the list or add your own. Extended properties are used to store the classification; The report embedded in SSMS uses the same information to display its data. Outside the report, these properties are not so obvious.
In SQL Server 2019, a new instruction for this metadata has appeared, already available in the SQL Azure database, called ADD SENSITIVITY CLASSIFICATION. It allows you to do the same thing as the master in SSMS, but the information is no longer stored in the extended property, and any access to this data is automatically displayed in the audit as a new XML column data_sensitivity_information. It contains all types of information that were affected during the audit.
As a quick example, suppose I have a table for external contractors:
Looking at this structure, it becomes clear that all four columns are either potentially vulnerable to leakage, or should be accessible only to a limited circle of people. You can get by with permissions, but at least you need to focus on them. Thus, we can classify these columns in different ways:
Now, instead of looking in sys.extended_properties, you can see them in sys.sensitivity_classifications:
And if we conduct an audit sample (or DML) for this table, we do not need to specifically change anything; after creating the classification,
Of course, this does not solve all the issues of compliance with standards, but it can give a real advantage. Using the wizard to automatically identify columns and transfer sp_addextendedproperty calls to ADD SENSITIVITY CLASSIFICATION commands can greatly simplify the task of adhering to standards. Later, I will write a separate article about it.
You can also automate the creation (or updating) of permissions based on the label in the metadata — creating a dynamic SQL script that prohibits access to all confidential (GDPR) columns, which allows you to manage users, groups or rolesb. I will work this question in the future.
SQL Server 2017 now has the ability to pause and resume index rebuilding in real time, which can be very useful if you need to change the number of processors in use, continue from the moment of suspension after the failure occurred, or simply eliminate the gap between the service windows. I talked about this feature in a previous article .
In SQL Server 2019, you can use the same syntax to create real-time indexes, pause and continue, and also to limit the execution time (setting the pause time):
If this query takes too long, then you can perform ALTER INDEX in a different session to suspend (even if the index does not physically exist yet):
In current builds, the degree of concurrency cannot be reduced when resuming, as is the case with rebuilding. When trying to reduce DOP:
We get the following:
In fact, if you try to do this, and then execute the command without additional parameters, you will get the same error, at least on the current builds. I think that the renewal attempt was registered somewhere and the system wanted to use it again. To continue, you must specify the correct (or higher) DOP value:
To make it clear: you can increase the DOP, when you resume the suspended creation of the index, but not lower.
An additional benefit of all this is that you can set up creating and / or resuming indexes in real time as the default mode, using the ELEVATE_ONLINE and ELEVATE_RESUMABLE sentences for the new database.
In addition to the renewable index creation, we also get the ability to create or rebuild clustered column indexes in real time. This is a significant change, allowing you to no longer spend the time of service windows to maintain such indexes or (for more convincing) to convert indexes from line-by-column to column-based:
One warning: if the existing traditional clustered index was created in real time, then its conversion to a clustered column index is also possible only in this mode. If it is part of a primary key, embedded or not ...
We get this error:
You must first remove the constraint to convert it to a clustered column index, but both of these operations can be performed in real time:
This works, but on large tables it will probably take longer than if the primary key was implemented as a unique clustered index. I can not say for sure whether this is a deliberate restriction or just a restriction of the current CTP.
Redirect replication connection from the secondary to the primary server
This feature allows you to configure redirection without listening, so that you can switch the connection to the primary server, even if the secondary connection is directly specified in the connection string. This feature can be used when clustering technology does not support listening, using AGs without a cluster, or when there is a complex redirection pattern in a multi-subnet scenario. This will prevent the connection from, for example, writing operations for replication in read-only mode (and failures, respectively).
Graph relationships now support the MERGE operator for a node or boundary tables using MERGE predicates; now one operator can update an existing edge or insert a new one. The new edge constraint will allow you to determine which nodes can connect an edge.
SQL Server 2012 added support for UTF-16 and additional characters by setting sorting by specifying a name with the _SC suffix, such as Latin1_General_100_CI_AI_SC, to use Unicode columns (nchar / nvarchar). In SQL Server 2017, you can import and export UTF-8 data from and to these columns using tools like BCP and BULK INSERT .
In SQL Server 2019, there are new collations to support the forced storage of UTF-8 data in its original form. So you can easily create char or varchar columns and correctly store UTF-8 data using new sorting parameters with the _SC_UTF8 suffix, like Latin1_General_100_CI_AI_SC_UTF8. This can help improve compatibility with external applications and databases, without the cost of processing and storing nvarchar.
As I recall, SQL Server users complain about this vague error message:
In the CTP builds I experimented with, an interesting error message was noticed that was not there before:
I don't think anything else is needed here; this is an excellent (albeit very late) improvement, and promises to make many happy. However, this functionality will not be available in CTP 2.0; I just give the opportunity to look a little ahead. Brent Ozar listed all the new messages he found in the current CTP, and spiced them up with several helpful comments in his sys.messages article : discovering additional functions .
SQL Server 2019 offers some nice additional features that will help improve your work with your favorite relational database platform, and there are a number of changes that I haven’t mentioned. Powerful memory, clustering for machine learning services, replication and distributed transactions in Linux, Kubernetes, connectors for Oracle / Teradata / MongoDB, AG synchronous replications have risen to Java support (implementation is similar to Python / R) and, equally important, new spurt, called "Big Data Cluster". To use some of these features, you must register using this EAP form .
Upcoming Bob Ward Book, Pro SQL Server on Linux - Including Container-Based Deployment with Docker and Kubernetesmay give some clues about a number of other things that will soon appear. And this publication by Brent Ozar speaks of a possible future correction of a scalar user-defined function.
But even in this first public CTP there is something essential for almost everyone, and I urge you to try it yourself!
Without going into details, I'm going to discuss the following new kernel functions: performance, troubleshooting, security, availability, and development. At the moment I have a little more details than the others, and some of them are already prepared for publication. I will return to this section, as well as to many other articles and documentation, and publish them. I hasten to inform you that this is not a comprehensive review, but only part of the functionality that I managed to “touch”, up to CTP 2.0. There is still a lot to talk about.
Performance
Table Variables: Deferred Plan
Table variables have a poor reputation, mostly in the area of valuation. By default, SQL Server assumes that a table variable can contain only one row, which sometimes leads to an inadequate choice of plan, when the variable will contain several times more rows. OPTION (RECOMPILE) is usually used as a workaround, but it requires changing the code and it is wasteful with respect to resources — to perform a rebuilding each time, while the number of lines is most often the same. To emulate a rebuild, trace flag 2453 was entered, but it also requires a launch with a flag, and only works when a significant change occurs in the rows.
In compatibility level 150, deferred construction is performed if table variables are present and the query plan is not built until the table variable is filled once. The cost estimate will be made based on the results of the first use of the table variable, without further rebuilding. This is a trade-off between constant rebuilding, to get an accurate cost, and the complete absence of rebuilding with a constant cost of 1. If the number of lines remains relatively constant, then this is a good indicator (and even better if the number exceeds 1), but it may be less profitable if there is a large variation in the number of lines.
')
I presented a deeper analysis in a recent article Table Variables: Delayed Construction in SQL Server , and Brent Ozar also talked about this in the article Fast Table Variables (And new problems of parameter analysis) .
Feedback on the allocated memory in string mode
SQL Server 2017 has batch mode feedback on memory, which is described in detail here . Essentially, for any memory allocation associated with a query plan that includes batch mode operators, SQL Server will evaluate the memory used by the query and compare it with the requested memory. If the requested memory is too little or too much, which leads to drains in tempdb or a waste of memory, then the next time you start, the allocated memory for the corresponding query plan will be adjusted. This behavior will either reduce the amount allocated and increase concurrency, or increase it to improve performance.
Now we get the same behavior for queries in string mode, under compatibility level 150. If the query was forced to merge data to disk, then for subsequent runs, the allocated memory will be increased. If, in fact, the request was completed, it took half the memory than was allocated, then for subsequent requests it will be adjusted to the bottom. Brett Ozar describes this in more detail in his article Conditional Memory Allocation .
Batch mode for line storage
Beginning with SQL Server 2012, queries on column index tables benefited from improved performance in batch mode. Performance improvements are due to the request handler performing batch rather than line-by-line processing. Strings are also processed by the storage core in batches, which makes it possible to avoid parallelism exchange operators. Paul White ( @SQL_Kiwi ) reminded me that if you use an empty column-storage table to make batch mode operations possible, the processed rows will be packaged by an invisible operator. However, this crutch can nullify any improvements received from batch processing. Some information about this is in response to the Stack Exchange .
At compatibility level 150, SQL Server 2019 will automatically select batch mode in certain cases as the golden mean, even when there are no column indices. You might think that why not just create a column index and the matter is in a hat? Or continue to use the crutch mentioned above? This approach was also extended to traditional objects with line-by-line storage, because columnar indexes are not always possible for several reasons, including functional limitations (for example, triggers), costs during high-load update or delete operations, and the lack of support from third-party manufacturers. And from that crutch nothing good can be expected.
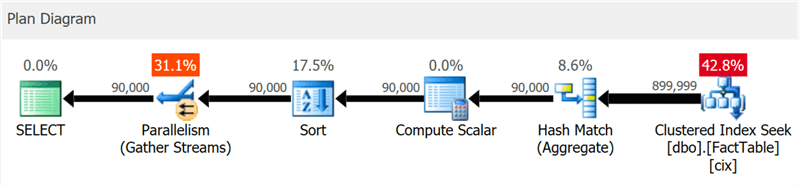
I created a very simple table with 10 million rows and one clustered index on an integer column and launched this query:
SELECT sa5, sa2, SUM(i1), SUM(i2), COUNT(*) FROM dbo.FactTable WHERE i1 > 100000 GROUP BY sa5, sa2 ORDER BY sa5, sa2; The plan clearly shows the search by clustered index and parallelism, but not a word about the column index (as shown by SentryOne Plan Explorer ):
But if you dig a little deeper, you can see that almost all operators were executed in batch mode, even sorting and scalar calculations:
You can disable this feature by remaining at a lower compatibility level by changing the database configuration or by using the DISALLOW_BATCH_MODE hint in the query:
SELECT … OPTION (USE HINT ('DISALLOW_BATCH_MODE')); In this case, an additional exchange operator appears, all operators are executed in row mode, and the query execution time is increased almost three times.
Up to a certain level, you can see it in the diagram, but in the details tree of the plan, you can also see the effect of the selection condition, unable to eliminate rows, until sorting has occurred:
The choice of packet mode is not always a good step - the heuristics included in the decision-making algorithm takes into account the number of rows, the types of expected operators and the expected benefits of the packet mode.
APPROX_COUNT_DISTINCT
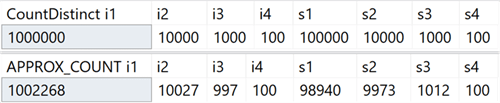
This new aggregate function is intended for data warehousing scenarios and is equivalent to COUNT (DISTINCT ()). However, instead of performing expensive sorting, to determine the actual quantity, the new function relies on statistics to obtain relatively accurate data. It should be understood that the error lies within 2% of the exact amount, and in 97% of cases that are the norm for high-level analytics, these are the values displayed on the indicators or used for quick assessments.
In my system, I created a table with integer columns that include unique values in the range from 100 to 1,000,000, and string columns, with unique values in the range from 100 to 100,000. There were no indexes in it except the clustered primary key in the first integer column. Here are the results of running COUNT (DISTINCT ()) and APPROX_COUNT_DISTINCT () on these columns, from which you can see small discrepancies (but always within 2%):
The win is huge, if there is a memory limit, which applies to most of us. If you look at the query plans, in this particular case, you can see a huge difference in memory consumption by the hash match operator:
Note that you will usually notice only significant performance improvements if you are already memory bound. In my system, execution lasted a little longer due to the strong CPU utilization of the new function:
Perhaps the difference would be more significant if I had larger tables, less memory, available SQL Server, higher concurrency, or some combination of the above.
Tips for using the compatibility level within a query
Do you have a specific query that works better under a certain compatibility level different from the current database? This is now possible, due to new query hints, supporting six different levels of compatibility and five different models for estimating the number of elements. The following are available compatibility levels, an example of syntax, and a compatibility level model that is used in each case. See how this affects your ratings, even for system views:
In short: there is no longer any need to remember the trace flags, or to ask whether you need to worry about whether the TF 4199 patch for the query optimizer is being distributed, or whether it has been canceled by some other update package. Please note that these additional hints recently were also added for SQL Server 2017 in cumulative update No. 10 (see Pedro Lopez’s blog for details). You can see all available hints with the following command:
SELECT name FROM sys.dm_exec_valid_use_hints; But do not forget that prompts are an exceptional measure, they are often suitable for getting out of a difficult situation, but they should not be planned for long-term use, as with subsequent updates their behavior may change.
Troubleshooting
Simplified Default Profiling
To understand this improvement, we need to remember a few points. In SQL Server 2014, the DMV view sys.dm_exec_query_profiles appeared, allowing the user performing the query to collect diagnostic information about all the operators in all parts of the query. The collected information becomes available after the completion of the query and allows you to determine which operators actually spent the main resources and why. Any user who failed to make a specific request could get this data for any session that included the STATISTICS XML or STATISTICS PROFILE statement, or for all sessions, using the extended query_post_execution_showplan event, although this event may affect overall performance.
Management Studio 2016 has added functionality that allows you to display data streams passing through the query plan in real time based on information collected from the DMV, which makes it even more powerful to find and fix problems. Plan Explorer also offers the ability to visualize data passing through a query, both in real time and in playback mode.
Starting with SQL Server 2016 SP1, you can also enable the light version of collecting this data for all sessions using the 7412 trace flag or the extended property query_thread_profile, which allows you to immediately get up-to-date information about any session without having to include it explicitly (in particular, things that adversely affect performance). More on this in Pedro Lopez's blog .
In SQL Server 2019, this feature is enabled by default, so you do not need to run any sessions with extended events or use any trace flags and STATISTICS instructions in any query. Just look at the data from the DMV at any time for all parallel sessions. But it is possible to disable this mode using LIGHTWEIGHT_QUERY_PROFILING, however, this syntax does not work in CTP 2.0 and will be fixed in subsequent editions.
Clustered column index statistics are now available in cloned databases
In current versions of SQL Server, when cloning a database, only original object statistics from clustered column indexes are used, not counting updates made in the table after its creation. If you use a clone to tune queries and other performance tests, which are based on power estimates, then these examples may not be appropriate. Parikshit Savyani described the limitations in this publication and provided a temporary solution - before creating a clone, you need to make a script that executes DBCC SHOW_STATISTICS ... WITH STATS_STREAM for each object. It is expensive and, of course, easy to forget.
In SQL Server 2019, this updated statistics will be automatically available in the clone, so you can test various query scenarios and get objective plans based on real statistics without manually starting STATS_STREAM for all tables.
Compression prediction for column storage
In current versions, the sys.sp_estimate_data_compression_savings procedure has the following check:
if (@data_compression not in ('NONE', 'ROW', 'PAGE')) This means that it allows you to check the compression of a line or page (or see the result of deleting the current compression). In SQL Server 2019, this check now looks like this:
if (@data_compression not in ('NONE', 'ROW', 'PAGE', 'COLUMNSTORE', 'COLUMNSTORE_ARCHIVE')) This is great news because it allows you to roughly predict the effect of adding a column index to a table that does not contain it, or convert tables or partitions to an even more compressed format of column storage, without having to restore this table to another system. I had a talitsa with 10 million rows, for which I performed a stored procedure with each of the five parameters:
EXEC sys.sp_estimate_data_compression_savings @schema_name = N'dbo', @object_name = N'FactTable', @index_id = NULL, @partition_number = NULL, @data_compression = N'NONE'; -- repeat for ROW, PAGE, COLUMNSTORE, COLUMNSTORE_ARCHIVE Results:
As in the case of other types of compression, the accuracy depends entirely on the available strings and the representativeness of the remaining data. Nevertheless, it is quite a powerful way to get presumptive results without much difficulty.
New feature to get information about the page
For a long time, the DBCC PAGE and DBCC IND commands were used to gather information about pages containing a section, index, or table. But they are undocumented and unsupported, and it can be tedious enough to automate the solution of problems associated with several indexes or pages.
Later, a dynamic administrative function (DMF) sys.dm_db_database_page_allocations appeared, which returns a set representing all pages in the specified object. Still undocumented and flawed, which can be a real problem on large tables: even to get information about a single page, it has to read the entire structure, which can be quite expensive.
In SQL Server 2019, another DMF appeared - sys.dm_db_page_info. Basically, it returns all the information about the page, without the overhead of the DMF distribution. However, to use the function in current builds, you must know in advance the number of the page you are looking for. Perhaps such a step was made intentionally, because This is the only way to ensure performance. So if you are trying to identify all pages in an index or table, you still need to use DMF distributions. In the next article I will describe this question in more detail.
Security
Permanent encryption using a secure environment (enclave)
Currently, persistent encryption protects sensitive data during transmission and in memory by encrypting / decrypting at each end of the process. Unfortunately, this often leads to serious limitations when working with data, such as the inability to perform calculations and filtering, so you have to pass the entire data set to the client to perform, say, a search by range.
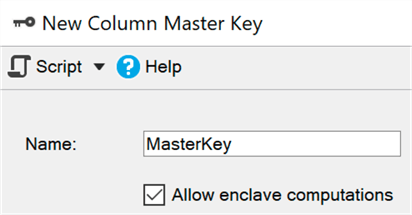
A secure environment (enclave) is a protected area of memory where such calculations and filtering can be delegated ( virtualization-based security is used in Windows) —the data remains encrypted in the kernel, but can be safely decrypted or encrypted in a secure environment. You just need to add the ENCLAVE_COMPUTATIONS parameter to the primary key using SSMS, for example, by selecting the checkbox “Allow calculations in a secure environment”:
Now you can encrypt data almost instantly compared to the old method (in which the master, the Set-SqlColumnEncyption cmdlet or your application, would have to completely get the entire set from the database, encrypt it, and send it back):
ALTER TABLE dbo.Patients ALTER COLUMN SSN char(9) -- currently not encrypted! ENCRYPTED WITH ( COLUMN_ENCRYPTION_KEY = ColumnEncryptionKeyName, ENCRYPTION_TYPE = Randomized, ALGORITHM = 'AEAD_AES_256_CBC_HMAC_SHA_256' ) NOT NULL; I think that for many organizations this improvement will be the main news, however in the current CTP some of these subsystems are still being improved, so by default they are turned off, but here you can see how to turn them on.
Certificate Management in Configuration Manager
Managing SSL and TLS certificates has always been a pain, and many people have had to do the tedious work of creating their own scripts to deploy and maintain their enterprise certificates. The updated Configuration Manager for SQL Server 2019 helps you quickly view and verify certificates of any instance, find certificates that will expire soon, and synchronize certificate deployments across all replications in the availability group or all nodes in a failover cluster instance.
I have not tried all these operations, but they should work for previous versions of SQL Server, if management occurs from the SQL Server 2019 Configuration Manager.
Built-in data classification and auditing
The SQL Server team has added the ability to classify data in SSMS 17.5, allowing you to define any columns that may contain sensitive information or contradict various standards (HIPAA, SOX, PCI, and GDPR, of course). The wizard will use an algorithm that suggests columns that are expected to cause problems, but you can either adjust its proposal by removing these columns from the list or add your own. Extended properties are used to store the classification; The report embedded in SSMS uses the same information to display its data. Outside the report, these properties are not so obvious.
In SQL Server 2019, a new instruction for this metadata has appeared, already available in the SQL Azure database, called ADD SENSITIVITY CLASSIFICATION. It allows you to do the same thing as the master in SSMS, but the information is no longer stored in the extended property, and any access to this data is automatically displayed in the audit as a new XML column data_sensitivity_information. It contains all types of information that were affected during the audit.
As a quick example, suppose I have a table for external contractors:
CREATE TABLE dbo.Contractors ( FirstName sysname, LastName sysname, SSN char(9), HourlyRate decimal(6,2) ); Looking at this structure, it becomes clear that all four columns are either potentially vulnerable to leakage, or should be accessible only to a limited circle of people. You can get by with permissions, but at least you need to focus on them. Thus, we can classify these columns in different ways:
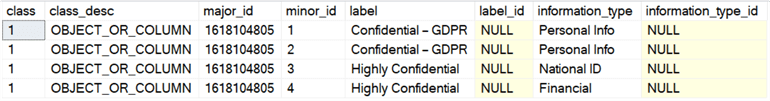
ADD SENSITIVITY CLASSIFICATION TO dbo.Contractors.FirstName, dbo.Contractors.LastName WITH (LABEL = 'Confidential – GDPR', INFORMATION_TYPE = 'Personal Info'); ADD SENSITIVITY CLASSIFICATION TO dbo.Contractors.SSN WITH (LABEL = 'Highly Confidential', INFORMATION_TYPE = 'National ID'); ADD SENSITIVITY CLASSIFICATION TO dbo.Contractors.HourlyRate WITH (LABEL = 'Highly Confidential', INFORMATION_TYPE = 'Financial'); Now, instead of looking in sys.extended_properties, you can see them in sys.sensitivity_classifications:
And if we conduct an audit sample (or DML) for this table, we do not need to specifically change anything; after creating the classification,
SELECT * will record in the audit log this type of information in the new data_sensitivity_information column: <sensitivity_attributes> <sensitivity_attribute label="Confidential - GDPR" information_type="Personal Info" /> <sensitivity_attribute label="Highly Confidential" information_type="National ID" /> <sensitivity_attribute label="Highly Confidential" information_type="Financial" /> </sensitivity_attributes> Of course, this does not solve all the issues of compliance with standards, but it can give a real advantage. Using the wizard to automatically identify columns and transfer sp_addextendedproperty calls to ADD SENSITIVITY CLASSIFICATION commands can greatly simplify the task of adhering to standards. Later, I will write a separate article about it.
You can also automate the creation (or updating) of permissions based on the label in the metadata — creating a dynamic SQL script that prohibits access to all confidential (GDPR) columns, which allows you to manage users, groups or rolesb. I will work this question in the future.
Availability
Renewable index creation in real time
SQL Server 2017 now has the ability to pause and resume index rebuilding in real time, which can be very useful if you need to change the number of processors in use, continue from the moment of suspension after the failure occurred, or simply eliminate the gap between the service windows. I talked about this feature in a previous article .
In SQL Server 2019, you can use the same syntax to create real-time indexes, pause and continue, and also to limit the execution time (setting the pause time):
CREATE INDEX foo ON dbo.bar(blat) WITH (ONLINE = ON, RESUMABLE = ON, MAX_DURATION = 10 MINUTES); If this query takes too long, then you can perform ALTER INDEX in a different session to suspend (even if the index does not physically exist yet):
ALTER INDEX foo ON dbo.bar PAUSE; In current builds, the degree of concurrency cannot be reduced when resuming, as is the case with rebuilding. When trying to reduce DOP:
ALTER INDEX foo ON dbo.bar RESUME WITH (MAXDOP = 2); We get the following:
Msg 10666, Level 16, State 1, Line 3 Cannot resume index build as required DOP 4 (DOP operation was started with) is not available. Please ensure sufficient DOP is available or abort existing index operation and try again. The statement has been terminated. In fact, if you try to do this, and then execute the command without additional parameters, you will get the same error, at least on the current builds. I think that the renewal attempt was registered somewhere and the system wanted to use it again. To continue, you must specify the correct (or higher) DOP value:
ALTER INDEX foo ON dbo.bar RESUME WITH (MAXDOP = 4); To make it clear: you can increase the DOP, when you resume the suspended creation of the index, but not lower.
An additional benefit of all this is that you can set up creating and / or resuming indexes in real time as the default mode, using the ELEVATE_ONLINE and ELEVATE_RESUMABLE sentences for the new database.
Creating / Rebuilding Clustered Column Indexes in Real Time
In addition to the renewable index creation, we also get the ability to create or rebuild clustered column indexes in real time. This is a significant change, allowing you to no longer spend the time of service windows to maintain such indexes or (for more convincing) to convert indexes from line-by-column to column-based:
CREATE TABLE dbo.splunge ( id int NOT NULL ); GO CREATE UNIQUE CLUSTERED INDEX PK_Splunge ON dbo.splunge(id); GO CREATE CLUSTERED COLUMNSTORE INDEX PK_Splunge ON dbo.splunge WITH (DROP_EXISTING = ON, ONLINE = ON); One warning: if the existing traditional clustered index was created in real time, then its conversion to a clustered column index is also possible only in this mode. If it is part of a primary key, embedded or not ...
CREATE TABLE dbo.splunge ( id int NOT NULL CONSTRAINT PK_Splunge PRIMARY KEY CLUSTERED (id) ); GO -- or after the fact -- ALTER TABLE dbo.splunge ADD CONSTRAINT PK_Splunge PRIMARY KEY CLUSTERED(id); We get this error:
Msg 1907, Level 16 Cannot recreate index 'PK_Splunge'. The new index definition does not match the constraint being enforced by the existing index. You must first remove the constraint to convert it to a clustered column index, but both of these operations can be performed in real time:
ALTER TABLE dbo.splunge DROP CONSTRAINT PK_Splunge WITH (ONLINE = ON); GO CREATE CLUSTERED COLUMNSTORE INDEX PK_Splunge ON dbo.splunge WITH (ONLINE = ON); This works, but on large tables it will probably take longer than if the primary key was implemented as a unique clustered index. I can not say for sure whether this is a deliberate restriction or just a restriction of the current CTP.
Redirect replication connection from the secondary to the primary server
This feature allows you to configure redirection without listening, so that you can switch the connection to the primary server, even if the secondary connection is directly specified in the connection string. This feature can be used when clustering technology does not support listening, using AGs without a cluster, or when there is a complex redirection pattern in a multi-subnet scenario. This will prevent the connection from, for example, writing operations for replication in read-only mode (and failures, respectively).Development
Additional features of the graph
Graph relationships now support the MERGE operator for a node or boundary tables using MERGE predicates; now one operator can update an existing edge or insert a new one. The new edge constraint will allow you to determine which nodes can connect an edge.
UTF-8
SQL Server 2012 added support for UTF-16 and additional characters by setting sorting by specifying a name with the _SC suffix, such as Latin1_General_100_CI_AI_SC, to use Unicode columns (nchar / nvarchar). In SQL Server 2017, you can import and export UTF-8 data from and to these columns using tools like BCP and BULK INSERT .
In SQL Server 2019, there are new collations to support the forced storage of UTF-8 data in its original form. So you can easily create char or varchar columns and correctly store UTF-8 data using new sorting parameters with the _SC_UTF8 suffix, like Latin1_General_100_CI_AI_SC_UTF8. This can help improve compatibility with external applications and databases, without the cost of processing and storing nvarchar.
Easter eggs I found
As I recall, SQL Server users complain about this vague error message:
Msg 8152 String or binary data would be truncated. In the CTP builds I experimented with, an interesting error message was noticed that was not there before:
Msg 2628 String or binary data would be truncated in table '%.*ls', column '%.*ls'. Truncated value: '%.*ls' I don't think anything else is needed here; this is an excellent (albeit very late) improvement, and promises to make many happy. However, this functionality will not be available in CTP 2.0; I just give the opportunity to look a little ahead. Brent Ozar listed all the new messages he found in the current CTP, and spiced them up with several helpful comments in his sys.messages article : discovering additional functions .
Conclusion
SQL Server 2019 offers some nice additional features that will help improve your work with your favorite relational database platform, and there are a number of changes that I haven’t mentioned. Powerful memory, clustering for machine learning services, replication and distributed transactions in Linux, Kubernetes, connectors for Oracle / Teradata / MongoDB, AG synchronous replications have risen to Java support (implementation is similar to Python / R) and, equally important, new spurt, called "Big Data Cluster". To use some of these features, you must register using this EAP form .
Upcoming Bob Ward Book, Pro SQL Server on Linux - Including Container-Based Deployment with Docker and Kubernetesmay give some clues about a number of other things that will soon appear. And this publication by Brent Ozar speaks of a possible future correction of a scalar user-defined function.
But even in this first public CTP there is something essential for almost everyone, and I urge you to try it yourself!
Source: https://habr.com/ru/post/424441/
All Articles