Fight for resources, part 2: Playing with Cgroups settings
We started exploring Control Groups (Cgroups) in Red Hat Enterprise Linux 7 — a kernel-level mechanism that allows you to control the use of system resources; we briefly reviewed the theoretical foundations and now move on to the practice of managing CPU, memory, and I / O resources.

However, before you change something, it is always useful to know how everything is arranged now.
There are two tools with which you can see the status of active cgroups in the system. First, it is systemd-cgls - the command issuing a tree-like list of cgroups and running processes. Her output looks like this:
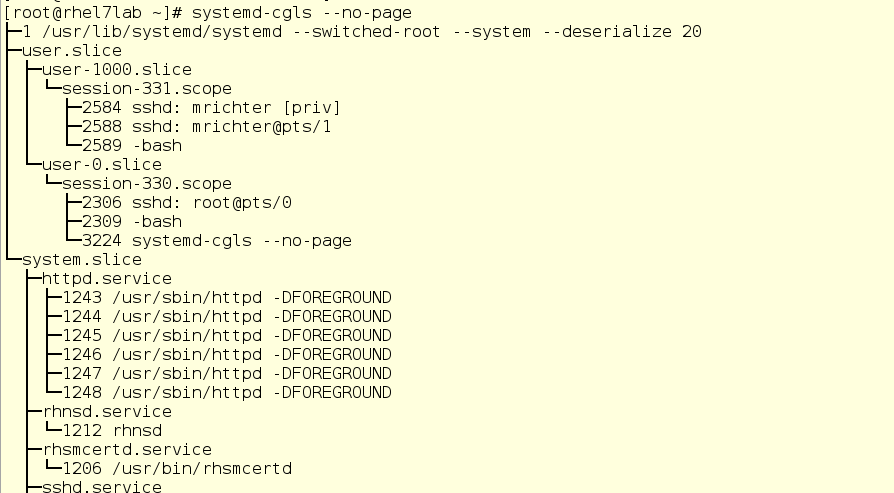
Here we see the top level cgroups: user.slice and system.slice. We don’t have virtual machines, so under load these top-level groups get 50% of CPU resources (since the slice machine is not active). There are two child slice in user.slice: user-1000.slice and user-0.slice. User slices are identified by User ID (UID), so it can be difficult to determine the owner, except by running processes. In our case, using ssh sessions, you can see that user 1000 is mrichter, and user 0 is root.
')
The second command we will use is systemd-cgtop. It shows a picture of the use of resources in real time (the output of systemd-cgls, by the way, is also updated in real time). On the screen, it looks like this:
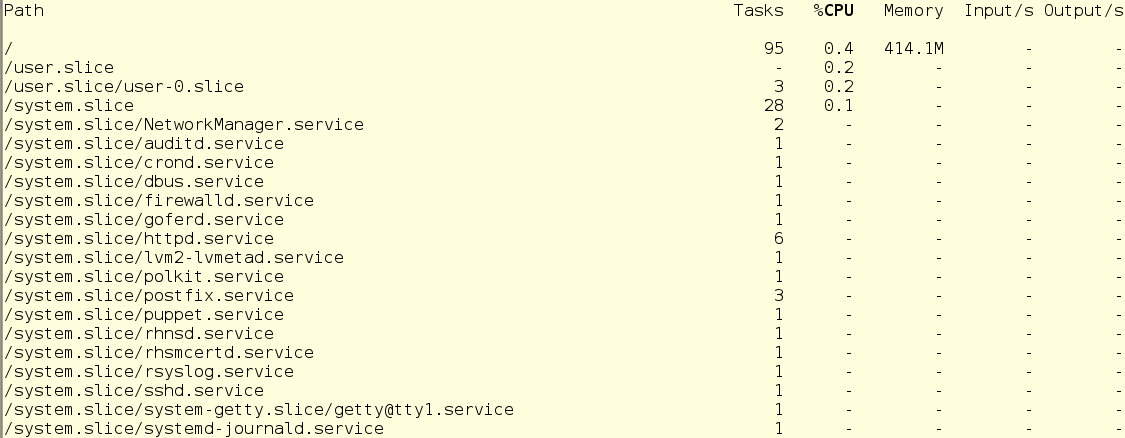
With systemd-cgtop, there is one problem - it only shows statistics for the services and slices for which resource accounting is enabled. Accounting is enabled by creating drop-in conf files in the appropriate subdirectories in / etc / systemd / system. For example, the drop-in in the screenshot below includes accounting for CPU and memory resources for the sshd service. To do this on your own, simply create the same drop-in in a text editor. In addition, accounting can be enabled using the systemctl command set-property sshd.service CPUAccounting = true MemoryAccounting = true.
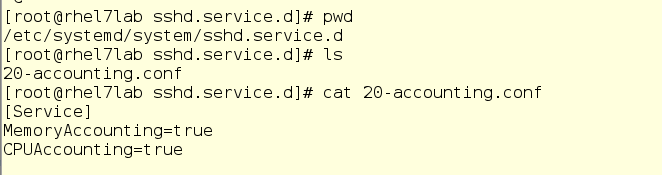
After creating the drop-in, it is necessary to enter the systemctl daemon-reload command, as well as the systemctl restart <service_name> command for the corresponding service. As a result, you will see statistics on the use of resources, but this will create an additional burden, since resources will also be spent on record keeping. Therefore, accounting should be included prudently and only for those services and cgroups that need to be monitored in a similar way. However, often instead of systemd-cgtop, you can do with top or iotop.
Now let's see how the change in the processor ball (CPU Shares) affects the performance. For example, we will have two unprivileged users and one system service. The user with the login mrichter has a UID of 1000, which can be checked using the / etc / passwd file.

This is important because custom slices are named by the UID, not by the account name.
Now we will go over the drop-ins directory and see if there is already something for his slice.
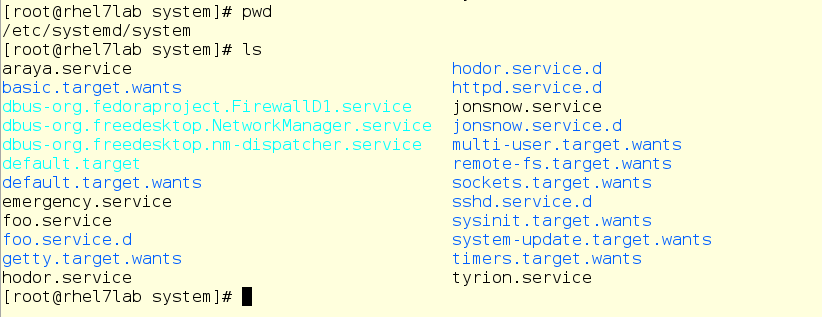
No, nothing. Although there is something else - take a look at things related to foo.service:
If you are familiar with the systemd unit files, you will see a completely normal unit file that runs the command / usr / bin / sha1sum / dev / zero as a service (in other words, a daemon). What matters for us is that foo will take literally all the processor resources that the system will allow him to use. In addition, here we have a drop-in setting the value of CPU balls equal to 2048 for the foo service. By default, as you remember, it is set to 1024, so under load foo will receive a double share of CPU resources within the system.slice , its parent top-level slice (since foo is a service).
Now run foo through the systemctl and see what the top command shows us:
Since there are practically no other working things in the system, the foo service (pid 2848) consumes almost all the CPU time of a single CPU.
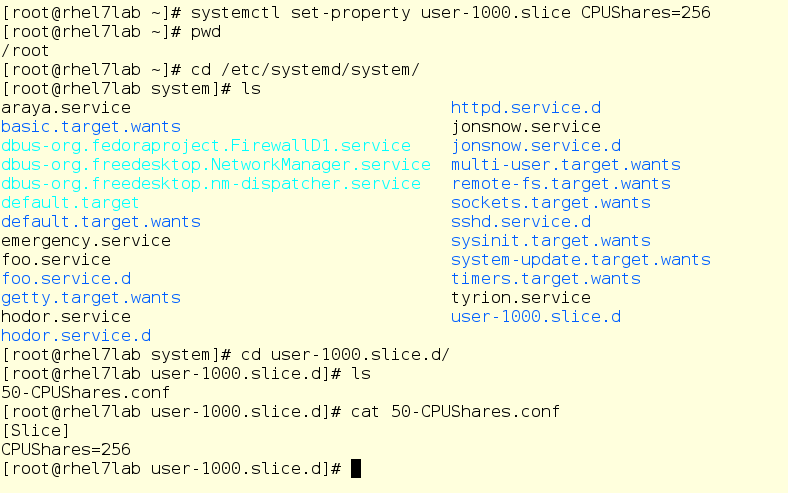
Now we enter mrichter into the equation of the user. First, we cut down the CPU ball to 256, then it will enter the system and launch foo.exe, in other words, the same program, but as a user process.
So mrichter launched foo. And this is what the top command now shows:
Strange, yes? The user mrichter seems to be supposed to get 10 percent of CPU time, since he has a ball = 256, and foo.service - as many as 2048, no?
Now we enter into the dorf equation. This is another regular user with a standard CPU ball equal to 1024. He will also run foo, and we will again see how the distribution of processor time changes.
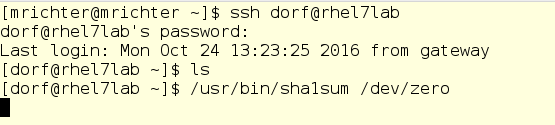
dorf is a user of the old school, he just starts the process, without any clever scripts and other things. And we again look at the top output:
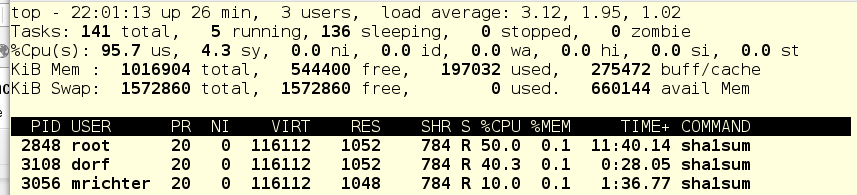
So ... let's look at the cgroups tree and try to figure out what's what:

If you remember, there are usually three top-level cgroups on the system: System, User and Machine. Since there are no virtual machines in our example, only the System and User slices remain. Each of them has a CPU ball of 1024, and therefore, under load, it receives half of the CPU time. Since foo.service lives in System, and there are no other contenders for CPU time in this slice, foo.service receives 50% of the CPU resources.
Further, in the User slice, users live dorf and mrichter. The first ball is 1024, the second - 256. Therefore, dorf gets four times more CPU time than the mrichter. Now let's see what top shows: foo.service - 50%, dorf - 40%, mrichter - 10%.
Translating this into a use-case language, it can be said that dorf has a higher priority. Accordingly, the cgroups are configured so that the mrichter user is cut back on resources while they are needed by dorf. Indeed, after all, while mrichter was alone in the system, he received 50% of the CPU time, since no one else competed for CPU resources in the User slice.
In fact, CPU balls are a way to provide a certain "guaranteed minimum" of CPU time, even for users and services with lower priority.
In addition, we have a way to set a hard quota for CPU resources, a certain limit in absolute numbers. We will do this for the user mrichter and see how the picture of the distribution of resources changes.

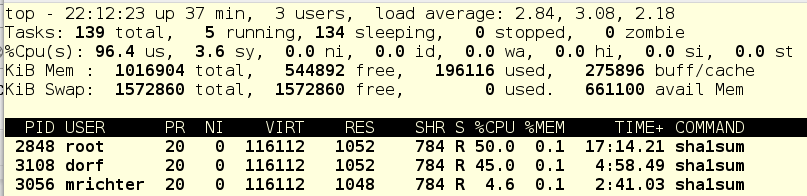
And now let's kill the tasks of user dorf, and this is what happens:
For mrichter, an absolute CPU limit of 5% is registered, so foo.service gets the rest of the CPU time.
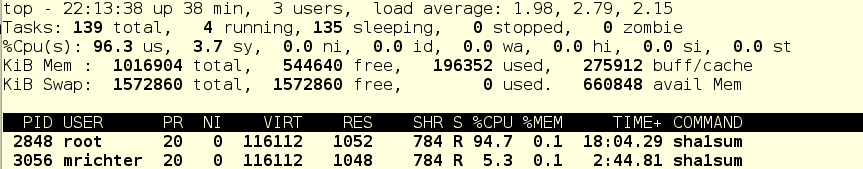
Continue bullying and stop foo.service:

What we see here: mrichter has 5% of CPU time, and the remaining 95% of the system is idle. Shaped mockery, yes.
In fact, this approach allows you to effectively tame services or applications that like to suddenly bump and pull all processor resources to the detriment of other processes.
So, we learned how to control the current situation with cgroups. Now let's dig a little deeper and see how cgroups are implemented at the virtual file system level.
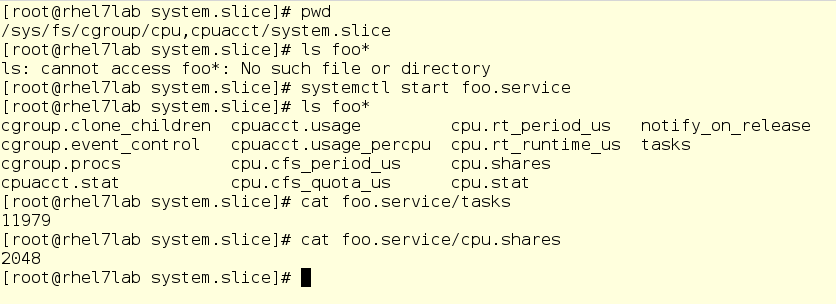
The root directory for all working cgroups is located at / sys / fs / cgroup. When the system boots, it fills up as services and other tasks start. When you start and stop services, their subdirectories appear and disappear.
In the screenshot below, we moved to a subdirectory for the CPU controller, namely in the System slice. As you can see, there is no subdirectory for foo here yet. Run foo and check a couple of things, namely, its PID and its current CPU ball:
Important caveat: here you can change values on the fly. Yes, in theory it looks cool (and in reality, too), but it can turn into a big mess. Therefore, before you change something, carefully weigh everything and never play on combat servers. But in any case, the virtual file system is what it takes to dig deeper as you study how cgroups work.
However, before you change something, it is always useful to know how everything is arranged now.
There are two tools with which you can see the status of active cgroups in the system. First, it is systemd-cgls - the command issuing a tree-like list of cgroups and running processes. Her output looks like this:
Here we see the top level cgroups: user.slice and system.slice. We don’t have virtual machines, so under load these top-level groups get 50% of CPU resources (since the slice machine is not active). There are two child slice in user.slice: user-1000.slice and user-0.slice. User slices are identified by User ID (UID), so it can be difficult to determine the owner, except by running processes. In our case, using ssh sessions, you can see that user 1000 is mrichter, and user 0 is root.
')
The second command we will use is systemd-cgtop. It shows a picture of the use of resources in real time (the output of systemd-cgls, by the way, is also updated in real time). On the screen, it looks like this:
With systemd-cgtop, there is one problem - it only shows statistics for the services and slices for which resource accounting is enabled. Accounting is enabled by creating drop-in conf files in the appropriate subdirectories in / etc / systemd / system. For example, the drop-in in the screenshot below includes accounting for CPU and memory resources for the sshd service. To do this on your own, simply create the same drop-in in a text editor. In addition, accounting can be enabled using the systemctl command set-property sshd.service CPUAccounting = true MemoryAccounting = true.
After creating the drop-in, it is necessary to enter the systemctl daemon-reload command, as well as the systemctl restart <service_name> command for the corresponding service. As a result, you will see statistics on the use of resources, but this will create an additional burden, since resources will also be spent on record keeping. Therefore, accounting should be included prudently and only for those services and cgroups that need to be monitored in a similar way. However, often instead of systemd-cgtop, you can do with top or iotop.
We change the CPU-balls for fun and with benefit
Now let's see how the change in the processor ball (CPU Shares) affects the performance. For example, we will have two unprivileged users and one system service. The user with the login mrichter has a UID of 1000, which can be checked using the / etc / passwd file.
This is important because custom slices are named by the UID, not by the account name.
Now we will go over the drop-ins directory and see if there is already something for his slice.
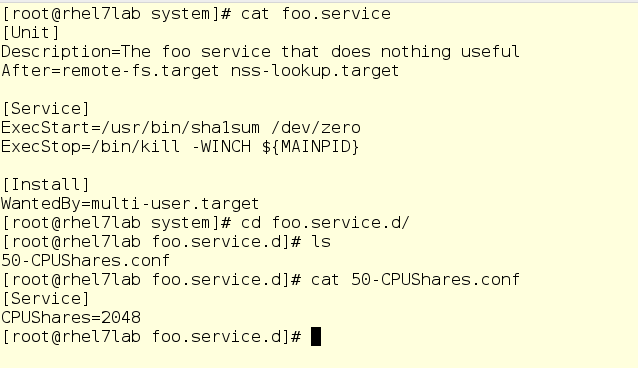
No, nothing. Although there is something else - take a look at things related to foo.service:
If you are familiar with the systemd unit files, you will see a completely normal unit file that runs the command / usr / bin / sha1sum / dev / zero as a service (in other words, a daemon). What matters for us is that foo will take literally all the processor resources that the system will allow him to use. In addition, here we have a drop-in setting the value of CPU balls equal to 2048 for the foo service. By default, as you remember, it is set to 1024, so under load foo will receive a double share of CPU resources within the system.slice , its parent top-level slice (since foo is a service).
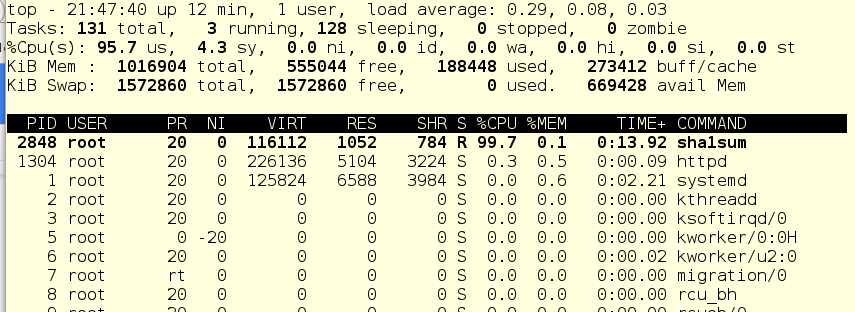
Now run foo through the systemctl and see what the top command shows us:
Since there are practically no other working things in the system, the foo service (pid 2848) consumes almost all the CPU time of a single CPU.
Now we enter mrichter into the equation of the user. First, we cut down the CPU ball to 256, then it will enter the system and launch foo.exe, in other words, the same program, but as a user process.
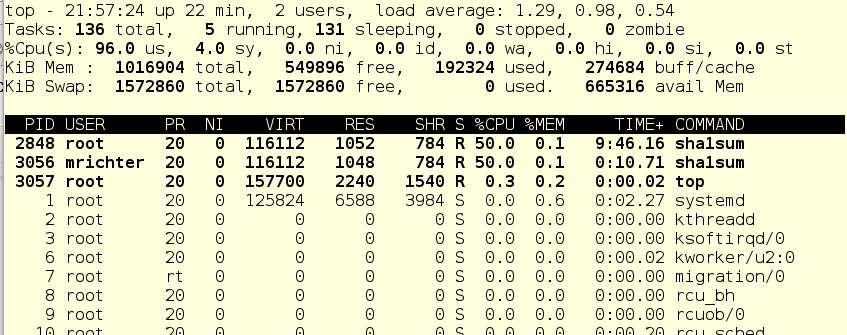
So mrichter launched foo. And this is what the top command now shows:
Strange, yes? The user mrichter seems to be supposed to get 10 percent of CPU time, since he has a ball = 256, and foo.service - as many as 2048, no?
Now we enter into the dorf equation. This is another regular user with a standard CPU ball equal to 1024. He will also run foo, and we will again see how the distribution of processor time changes.
dorf is a user of the old school, he just starts the process, without any clever scripts and other things. And we again look at the top output:
So ... let's look at the cgroups tree and try to figure out what's what:
If you remember, there are usually three top-level cgroups on the system: System, User and Machine. Since there are no virtual machines in our example, only the System and User slices remain. Each of them has a CPU ball of 1024, and therefore, under load, it receives half of the CPU time. Since foo.service lives in System, and there are no other contenders for CPU time in this slice, foo.service receives 50% of the CPU resources.
Further, in the User slice, users live dorf and mrichter. The first ball is 1024, the second - 256. Therefore, dorf gets four times more CPU time than the mrichter. Now let's see what top shows: foo.service - 50%, dorf - 40%, mrichter - 10%.
Translating this into a use-case language, it can be said that dorf has a higher priority. Accordingly, the cgroups are configured so that the mrichter user is cut back on resources while they are needed by dorf. Indeed, after all, while mrichter was alone in the system, he received 50% of the CPU time, since no one else competed for CPU resources in the User slice.
In fact, CPU balls are a way to provide a certain "guaranteed minimum" of CPU time, even for users and services with lower priority.
In addition, we have a way to set a hard quota for CPU resources, a certain limit in absolute numbers. We will do this for the user mrichter and see how the picture of the distribution of resources changes.
And now let's kill the tasks of user dorf, and this is what happens:
For mrichter, an absolute CPU limit of 5% is registered, so foo.service gets the rest of the CPU time.
Continue bullying and stop foo.service:
What we see here: mrichter has 5% of CPU time, and the remaining 95% of the system is idle. Shaped mockery, yes.
In fact, this approach allows you to effectively tame services or applications that like to suddenly bump and pull all processor resources to the detriment of other processes.
So, we learned how to control the current situation with cgroups. Now let's dig a little deeper and see how cgroups are implemented at the virtual file system level.
The root directory for all working cgroups is located at / sys / fs / cgroup. When the system boots, it fills up as services and other tasks start. When you start and stop services, their subdirectories appear and disappear.
In the screenshot below, we moved to a subdirectory for the CPU controller, namely in the System slice. As you can see, there is no subdirectory for foo here yet. Run foo and check a couple of things, namely, its PID and its current CPU ball:
Important caveat: here you can change values on the fly. Yes, in theory it looks cool (and in reality, too), but it can turn into a big mess. Therefore, before you change something, carefully weigh everything and never play on combat servers. But in any case, the virtual file system is what it takes to dig deeper as you study how cgroups work.
Source: https://habr.com/ru/post/424367/
All Articles