Splunk: Machine learning to a new level
Just over a year ago, we reviewed the Splunk Machine Learning Toolkit application, which allows us to analyze machine data on the Splunk platform using various machine learning algorithms.
Today we want to talk about the updates that have appeared over the past year. A lot of new versions have been released, various algorithms and visualizations have been added that will allow Splunk to analyze the data to a new level.
New algorithms
Before talking about algorithms, it should be noted that there is an ML-SPL API with which you can load any open source algorithm from more than 300 algorithms in the Python language. However, to do this, you need to be able to program in Python to some extent.
')
Therefore, we will pay attention to those algorithms that were previously available only after manipulations with Python, and are now embedded in the application and can easily be used by everyone.
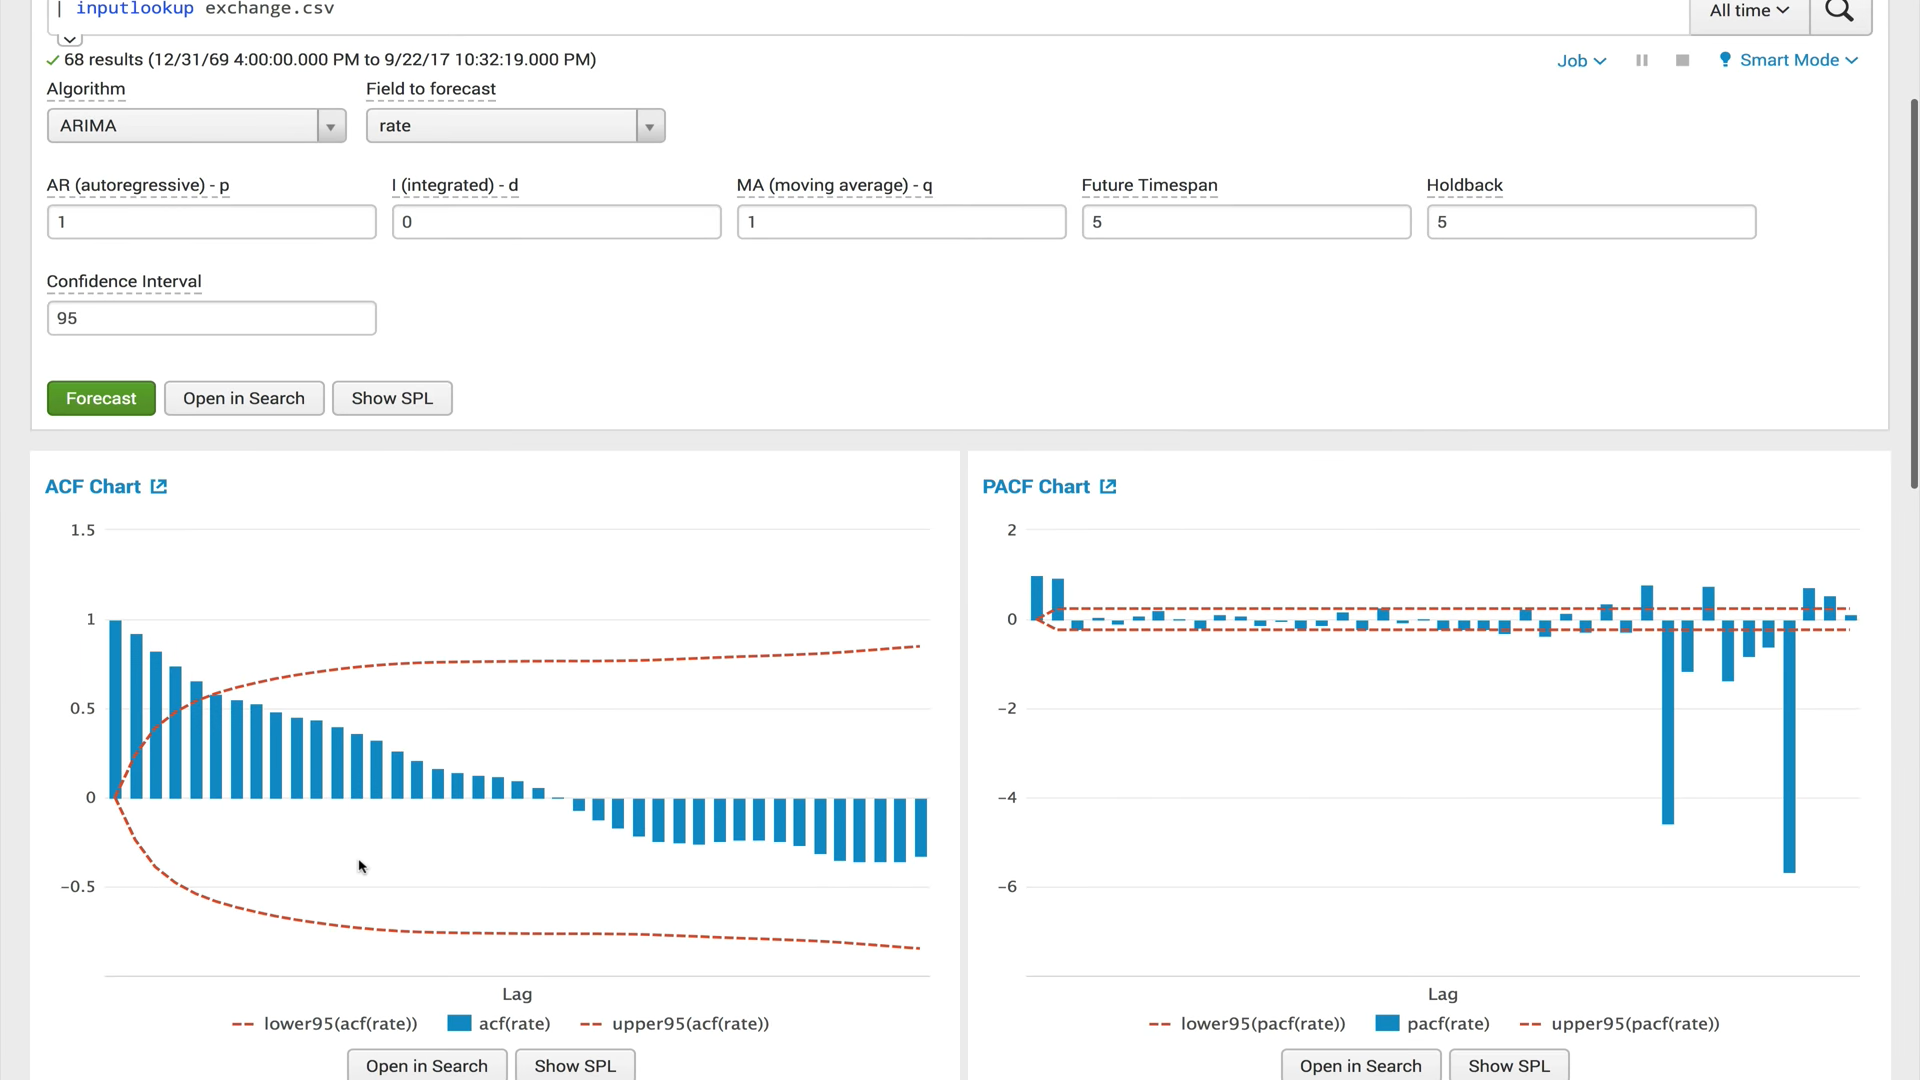
ACF (autocorrelation function)
The autocorrelation function shows the relationship between the function and its shifted copy by the amount of the time shift. ACF helps to find repetitive areas or determine the frequency of a signal that is hidden due to overlaps of noise and oscillations at other frequencies.
PACF (partial autocorrelation function)
The private autocorrelation function shows the correlation between two variables, minus the effect of all internal autocorrelation values. Private autocorrelation at a certain lag is similar to ordinary autocorrelation, but when calculating it, the influence of autocorrelations with smaller lags is excluded. In practice, private autocorrelation gives a more “clean" picture of periodic dependencies.
ARIMA (integrated autoregression and moving average process)
The ARIMA model is one of the most popular models for making short-term forecasts. The autoregression values express the dependence of the current value of the time series on the previous ones, and the moving average of the model determines the effect of previous forecast errors (also called white noise) on the current value.
Gradient Boosting Classifier and Gradient Boosting Regressor
Gradient boosting is a machine learning method used for regression and classification problems that creates a prediction model in the form of an ensemble of weak models, usually decision trees. He builds a model in stages, when each successive algorithm seeks to compensate for the shortcomings of the composition of all previous algorithms. Initially, the concept of boosting arose in papers in connection with the question whether it is possible, having many bad (slightly different from random definition) learning algorithms, to get good. Over the past 10 years, boosting has remained one of the most popular methods of machine learning, along with neural networks. The main reasons are simplicity, versatility, flexibility (the ability to build various modifications), and, most importantly, a high generalizing ability.
X-means
X-means clustering algorithm is an advanced k-means algorithm that automatically determines the number of clusters based on the Bayesian Information Criterion (BIC). This algorithm is convenient to use when there is no preliminary information about the number of clusters into which this data can be divided.
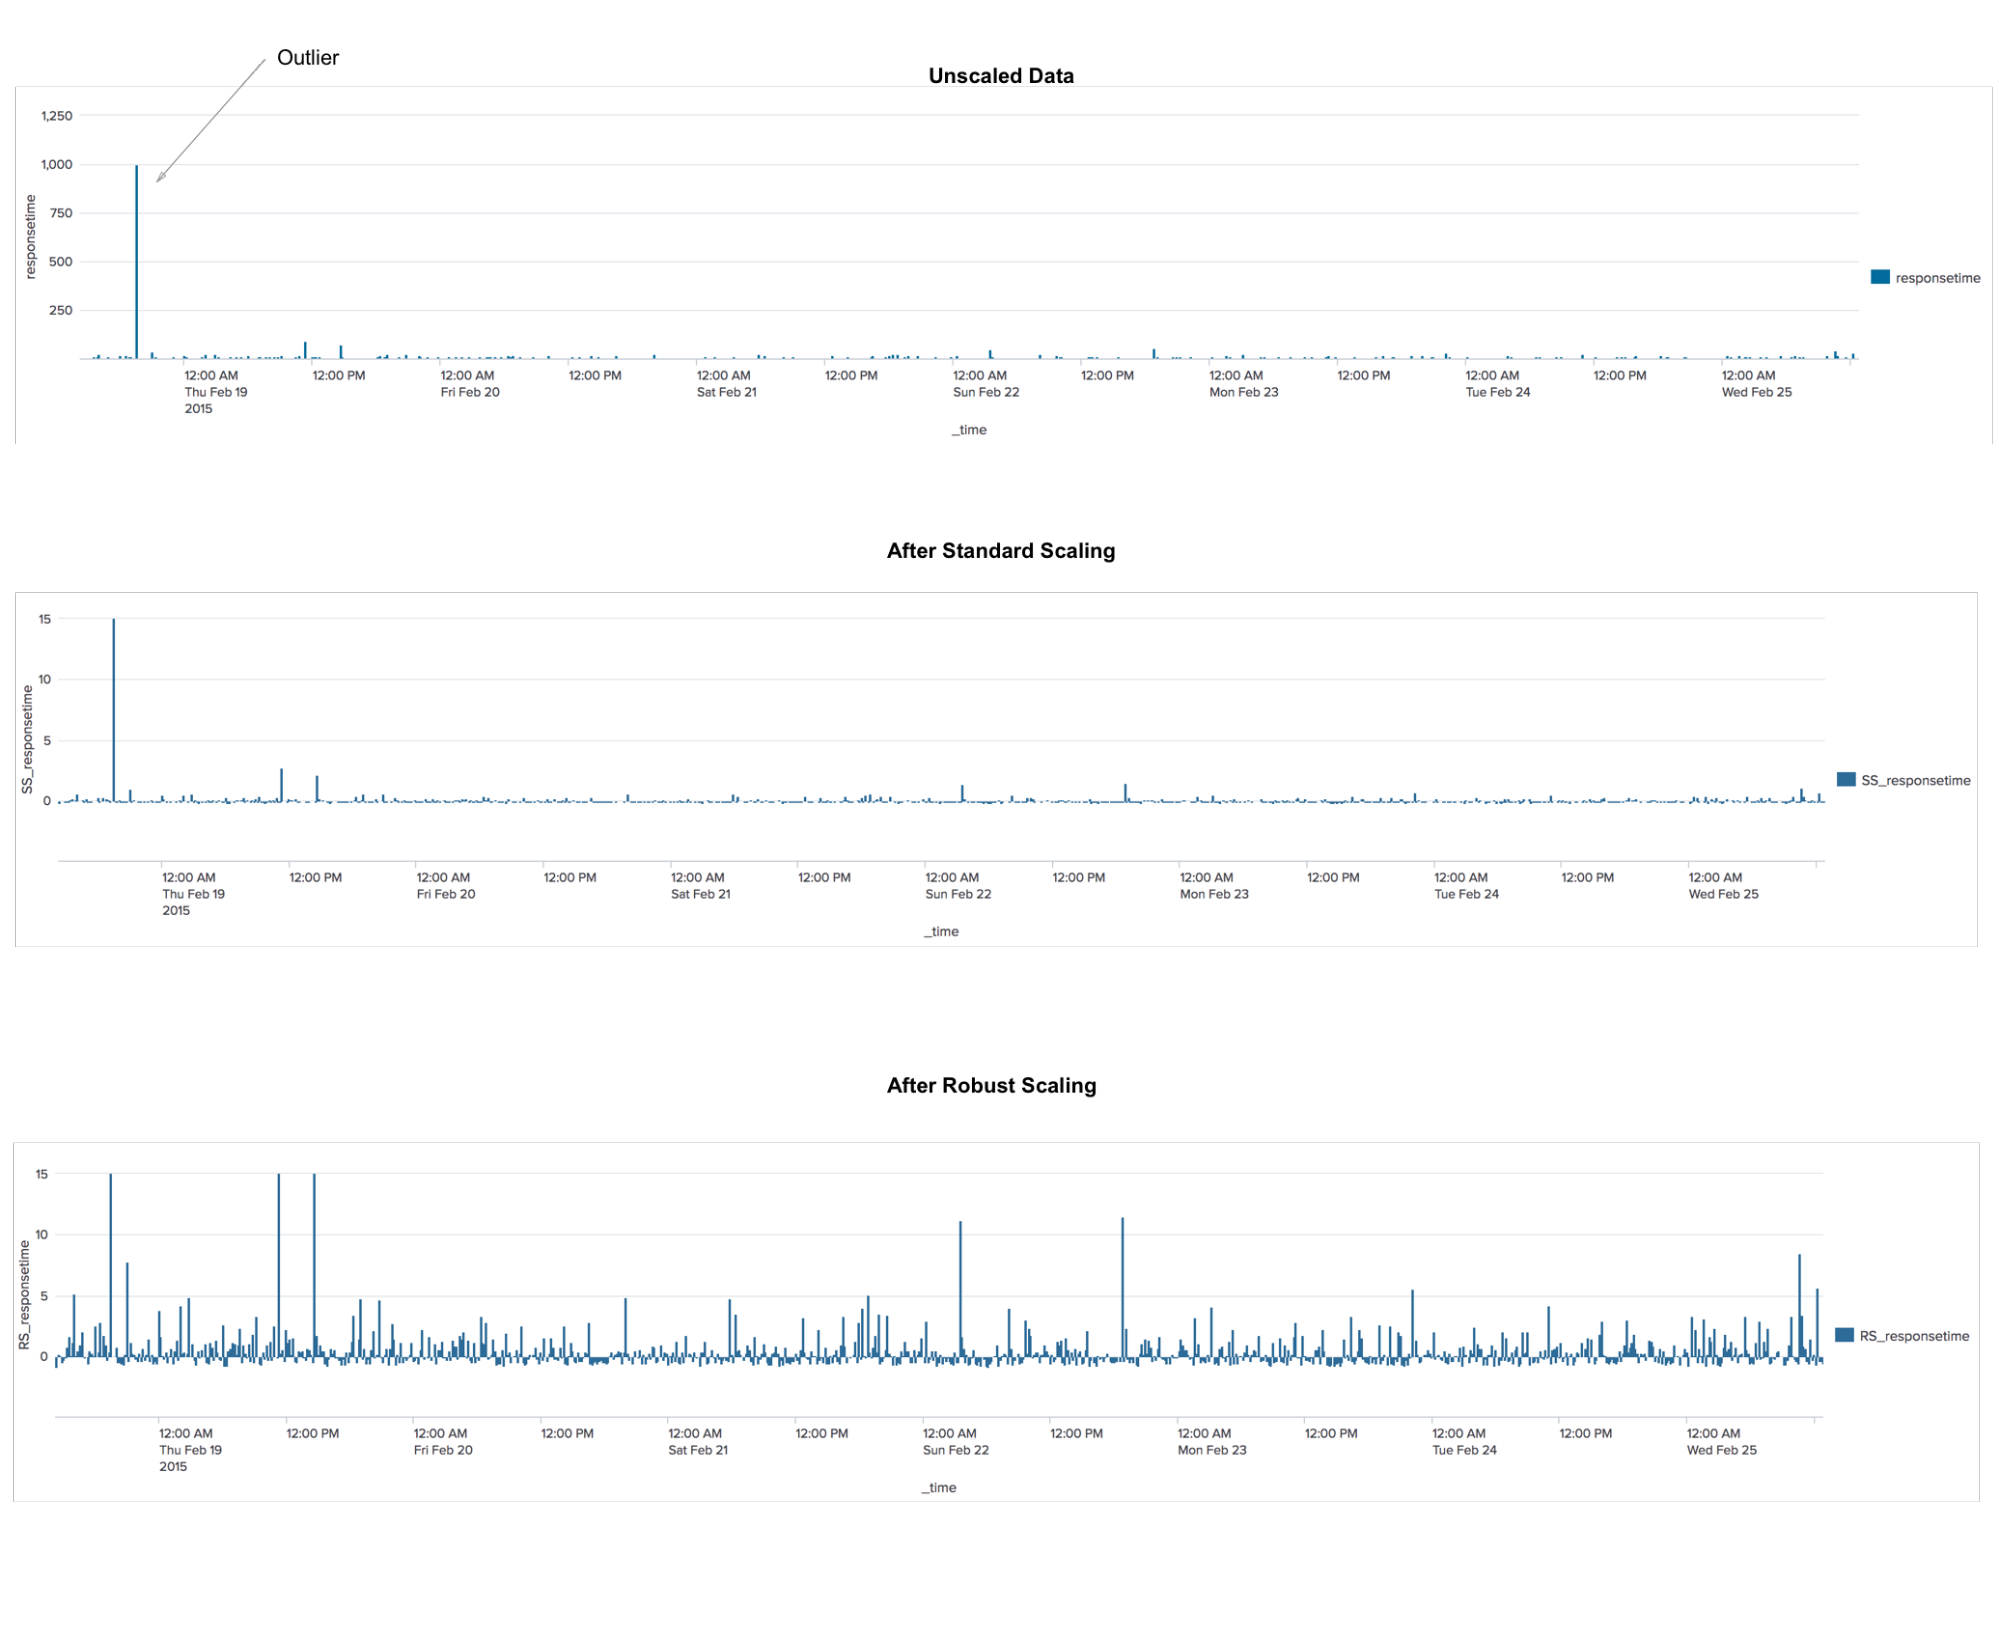
RobustScaler
This is a preprocessing algorithm. The application is similar to the StandardScaler algorithm, which converts the data so that for each feature the average will be 0, and the variance will be equal to 1, with the result that all signs will have the same scale. However, this scaling does not guarantee the receipt of any specific minimum and maximum values of features. RobustScaler is similar to StandardScaler in the sense that as a result of its use, the signs will have the same scale. However, RobustScaler uses medians and quartiles instead of mean and variance. This allows the RobustScaler to ignore outliers or measurement errors, which may be a problem for other scaling methods.
Tfidf
A statistical measure used to assess the importance of a word in the context of a document that is part of a collection of documents. The principle is this: if a word is often found in a document, while it is rarely found in all other documents, then this word is of great importance for that document.
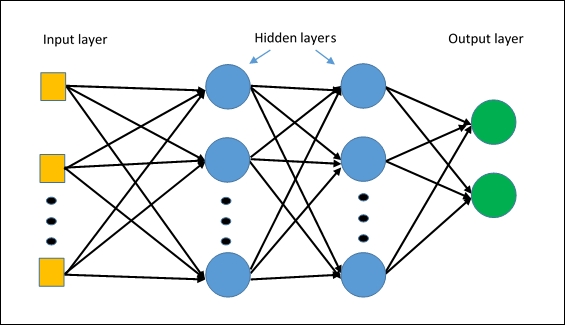
MLPClassifier
The first neural network algorithm in Splunk. The algorithm is based on a multilayer perceptron , which will allow to capture non-linear relationships in the data.
Administration
In the new versions, the administration of the application has changed significantly.
First, a role model of access to various models and experiments has been added.
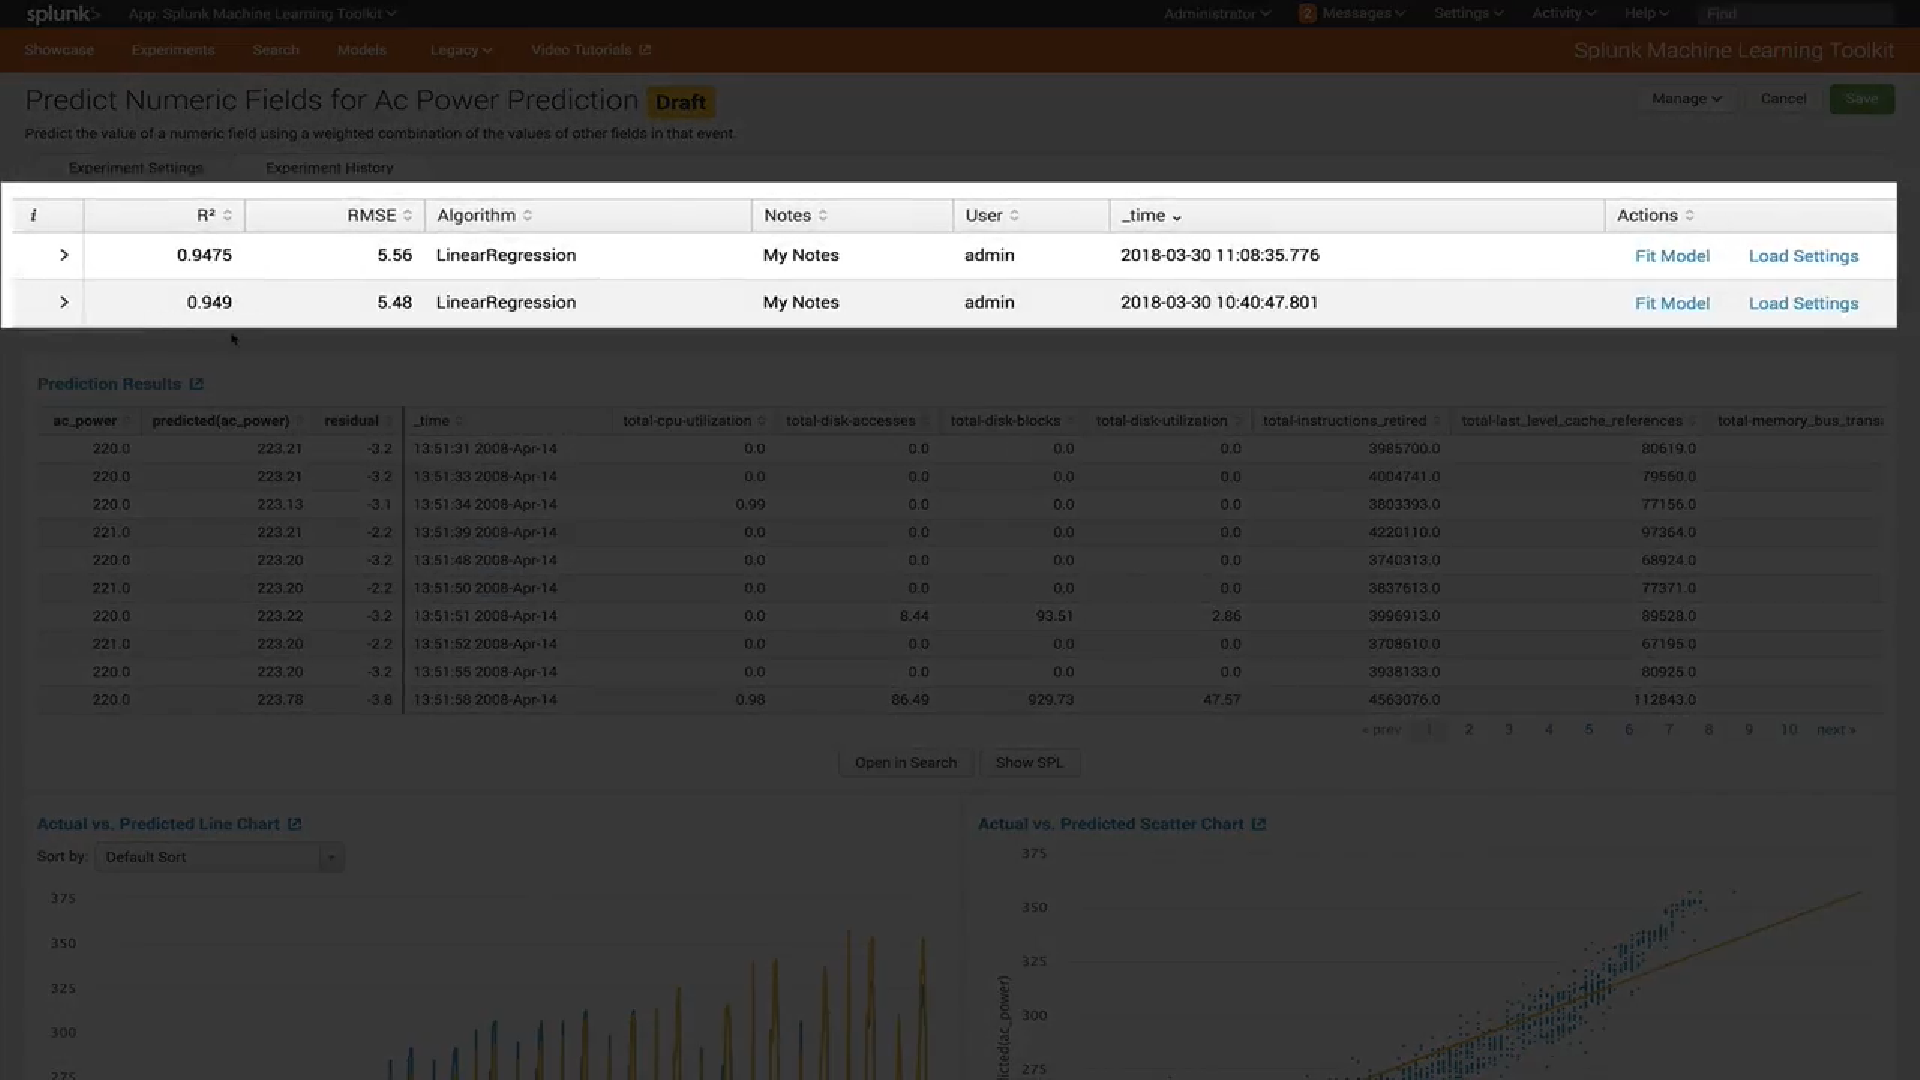
Second, a new model management interface has been introduced. Now you can easily see which types of models you have, check the settings of each model (for example, which variables were used to train it) and view or update the settings for sharing each model.
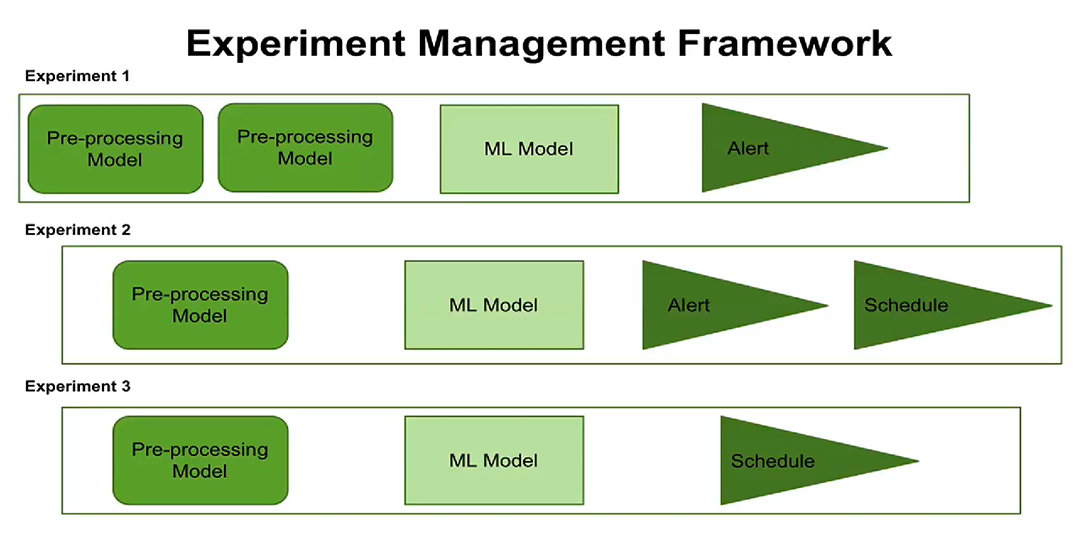
Third, the emergence of the concept of control experiments. Now you can configure the execution of experiments on a schedule, set up alerts. Users can see when each experiment is scheduled to run, which processing steps and parameters are configured for each experiment.
The new concept of managing experiments now gives you the opportunity to create and manage several experiments at once, record when these experiments were performed and what results were obtained.
Visualization
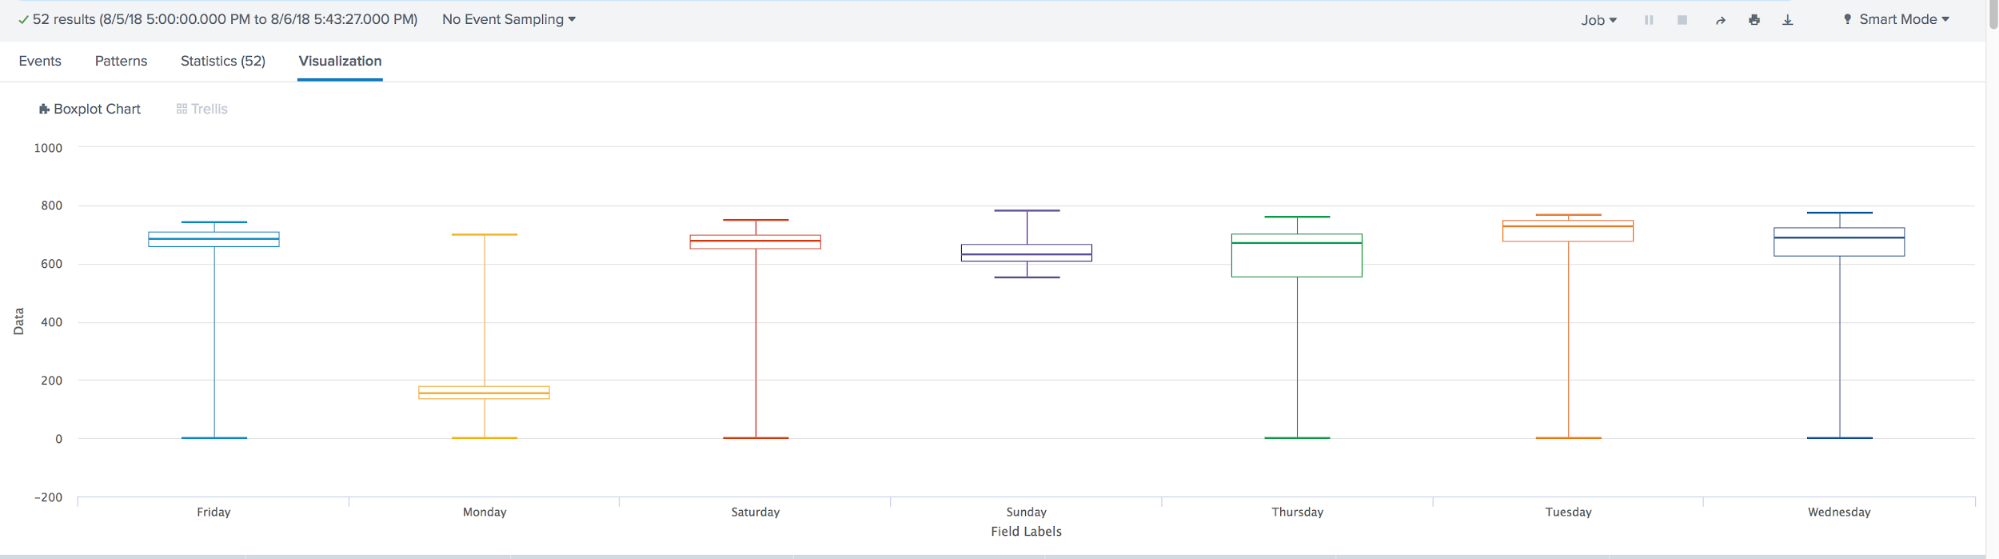
In the latest version of MLTK 3.4 a new type of visualization has been added. The famous Box Plot or, as we also call it, "The Boxes with a Mustache."
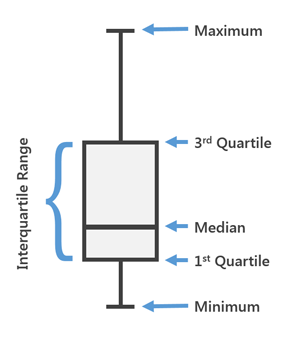
Box Plot is used in descriptive statistics, using it you can conveniently see the median (or, if necessary, the average), the lower and upper quartiles, the minimum and maximum sampling values and outliers. Several such boxes can be drawn side by side to visually compare one distribution with another. The distances between the different parts of the box allow you to determine the degree of dispersion (dispersion) and asymmetry of the data and to identify outliers.
Summing up, Splunk’s machine learning took a big step forward in a year. Appeared:
- Many new built-in algorithms, such as: ACF, PACF, ARIMA, Gradient Boosting Classifier, Gradient Boosting Regressor, X-means, RobustScaler, TFIDF, MLPClassifier;
- Role model of access and the ability to manage models and experiments;
- Box Plot Visualization
If you have not tried Splunk yet, then it's time to start, the free version up to 500MB per day is available to everyone. And if you have questions or problems with Splunk - you can ask them to us , and we will help.
We are the official Premier Splunk Partner .

Source: https://habr.com/ru/post/423783/
All Articles