Parallelism in PostgreSQL: not spherical, not a horse, not in a vacuum

Scaling a DBMS is a continually coming future. DBMSs are being improved and better scaled on hardware platforms, while hardware platforms themselves increase productivity, the number of cores, and memory — Achilles catches up with a turtle, but still has not caught up. The problem of scaling the DBMS is standing upright.
Postgres Professional faced the problem of scaling not only theoretically, but also practically: from its customers. And more than once. About one of these cases and will be discussed in this article.
')
PostgreSQL scales well on NUMA systems if it is a single motherboard with multiple processors and multiple data buses. Some optimizations can be found here and here . However, there is another class of systems, they have several motherboards, the data exchange between them is carried out using interconnect, while they have one instance of the operating system and for the user this design looks like a single machine. And although formally such systems can also be attributed to NUMA, but in essence they are closer to supercomputers, since access to the local memory of a node and access to the memory of a neighboring node differ radically. The PostgreSQL community believes that the only Postgres instance running on such architectures is a source of problems, and there is no systematic approach to solving them.
This is explained by the fact that the software architecture that uses shared memory is fundamentally designed to ensure that the access time of different processes to its own and remote memory is more or less comparable. In the case when we work with many nodes, the rate on shared memory as a fast communication channel ceases to justify itself, because due to delays (latency) it is much “cheaper” to send a request to perform a specific action to the node (node) where data of interest than to send this data on the bus. Therefore, cluster solutions are relevant for supercomputers and systems with many nodes in general.
This does not mean that the combination of multisite systems and a typical Postgres shared memory architecture must be put in a cross. After all, if the postgres processes spend most of the time doing complex calculations locally, then this architecture will even be very efficient. In our situation, the client had already purchased a powerful multi-node server, and we had to solve PostgreSQL problems on it.
And the problems were serious: the simplest write requests (change several field values in one record) were executed from a few minutes to an hour. As was later confirmed, these problems manifested themselves in all their glory precisely because of the large number of cores and, consequently, radical parallelism in the execution of requests with a relatively slow exchange between nodes.
Therefore, the article will turn out as a dual purpose:
- Share experience: what to do if the base slows down in earnest in a multi-node system. Where to start, how to diagnose, where to go.
- Tell how the problems of the PostgreSQL DBMS itself can be solved with a high level of parallelism. This includes how changing a lock algorithm affects PostgreSQL performance.
Server and DB
The system consisted of 8 blades with 2 sockets in each. In total, more than 300 cores (excluding hypertreaming). The fast tire (manufacturer's proprietary technology) connects the blades. Not that a supercomputer, but for a single instance of a DBMS, the configuration is impressive.
The load is also rather big. More than 1 terabyte of data. About 3000 transactions per second. Over 1000 connections to postgres.
Starting to deal with the hourly wait recording, the first thing we have excluded as a reason for the delay recording on the disk. As soon as incomprehensible delays began, tests began to be done exclusively on
tmpfs . The picture has not changed. The disk has nothing to do with it.Getting mining diagnoses: submission
Since problems arose, most likely due to the high competition of processes that “knock” on the same objects, the first thing to check is blocking. In PostgreSQL, for such a check, there is a
pg.catalog.pg_locks and pg_stat_activity . In the second, in version 9.6, information was added about what the process was waiting for ( Amit Kapila, Ildus Kurbangaliev ) - wait_event_type . Possible values for this field are described here .But first, just count:
postgres=# SELECT COUNT(*) FROM pg_locks; count —---— 88453 (1 row) postgres=# SELECT COUNT(*) FROM pg_stat_activity; count —---— 1826 (1 row) postgres=# SELECT COUNT(*) FROM pg_stat_activity WHERE state ='active'; count —---— 1005 These are real numbers. Reached up to 200,000 locks.
At the same time, there were such locks on the ill-fated request:
SELECT COUNT(mode), mode FROM pg_locks WHERE pid =580707 GROUP BY mode; count | mode —-----+---------------— 93 | AccessShareLock 1 | ExclusiveLock When reading the buffer, the DBMS uses the
share lock, while writing it is exclusive . That is, write locks accounted for less than 1% of all requests.In the
pg_locks types of locks do not always appear as described in the user documentation .Here is a label:
AccessShareLock = LockTupleKeyShare RowShareLock = LockTupleShare ExclusiveLock = LockTupleNoKeyExclusive AccessExclusiveLock = LockTupleExclusive The SELECT mode FROM pg_locks query showed that executions of the CREATE INDEX command (without CONCURRENTLY) are waiting for 234 INSERTs and 390 INSERTs are waiting for
buffer content lock . A possible solution is to “teach” INSERTs from different sessions to less intersect across buffers.It's time to use perf
The
perf utility collects a lot of diagnostic information. In record mode ... it records system event statistics in files (by default they are in ./perf_data ), and in report mode it maligns the collected data, you can, for example, filter events related only to postgres or this pid : $ perf record -u postgres $ perf record -p 76876 , $ perf report > ./my_results As a result, we'll see something like
How to use
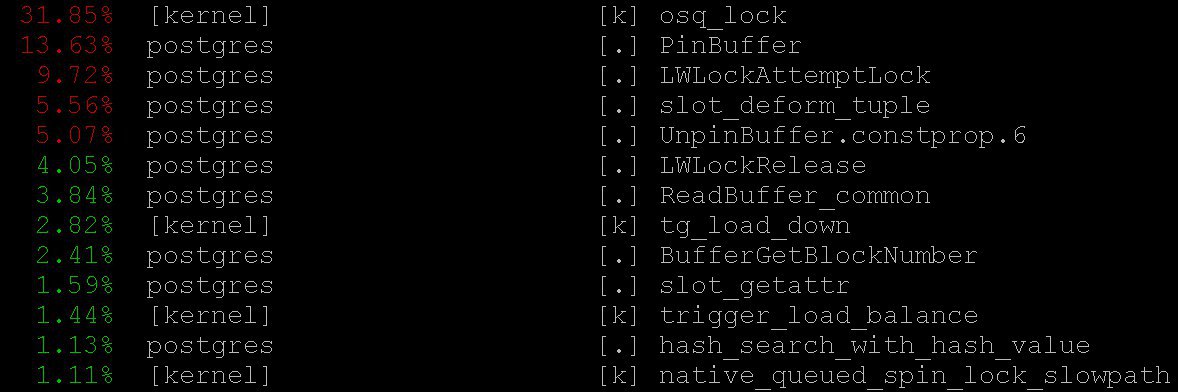
perf to diagnose PostgreSQL is described, for example, here , as well as in the pg-wiki .In our case, even the simplest mode gave important information -
perf top , which works, naturally, in the spirit of top operating system. Using perf top we saw that the processor spends most of the time in kernel PinBuffer() , as well as in the PinBuffer() and LWLockAttemptLock(). functions LWLockAttemptLock(). .PinBuffer() is a function that increases the count of buffer references (displaying a data page to RAM), thanks to which postgres processes know which buffers can be preempted and which cannot.LWLockAttemptLock() - the LWLock 's capture function. LWLock is a kind of LWLock with two levels of shared and exclusive , without defining deadlock , locks are first allocated in shared memory , waiting processes are waiting in the queue.These functions have already been seriously optimized in PostgreSQL 9.5 and 9.6. Spinlock inside them were replaced by direct use of atomic operations.
Flame graphs
It is impossible to do without them: even if they were useless, they would still be worth telling about them - they are extraordinarily beautiful. But they are useful. Here is an illustration from
github , not from our case (neither we nor the client are ready for the disclosure of details yet).
These beautiful pictures very clearly show what the processor cycles are going on. The data can be collected by the same
perf , but the flame graph lucidly visualizes the data, and builds trees based on the collected call stacks. Details about profiling with flame graphs can be found, for example, here , and download everything you need here .In our case, the flame graphs showed a huge amount of
nestloop . Apparently, the JOINs of a large number of tables in numerous parallel read requests caused a large number of access share locks.The statistics collected by
perf show where the processor cycles go. And although we have seen that most of the CPU time is spent on locks, we did not see what exactly leads to such long waits for locks, because we don’t see where locks wait exactly because pending processor time is not wasted.In order to see the expectations, you can build a query to the system view
pg_stat_activity . SELECT wait_event_type, wait_event, COUNT(*) FROM pg_stat_activity GROUP BY wait_event_type, wait_event; revealed that:
LWLockTranche | buffer_content | UPDATE ************* LWLockTranche | buffer_content | INSERT INTO ******** LWLockTranche | buffer_content | \r | | insert into B4_MUTEX | | values (nextval('hib | | returning ID Lock | relation | INSERT INTO B4_***** LWLockTranche | buffer_content | UPDATE ************* Lock | relation | INSERT INTO ******** LWLockTranche | buffer_mapping | INSERT INTO ******** LWLockTranche | buffer_content | \r (asterisks here simply replace the details of the request that we do not disclose).
buffer_content values are buffer_content (locking the contents of buffers) and buffer_mapping (locks on the components of the shared_buffers hash labels).For help with GDB
But why so many expectations for these types of locks? For more detailed information about expectations, I had to use the
GDB debugger. With GDB we can get a call stack of specific processes. Applying the sampling, i.e. By collecting a certain number of random call stacks, you can get an idea of which stacks have the longest expectations.Consider the process of building statistics. We will consider the “manual” collection of statistics, although in real life special scripts are used that do this automatically.
First,
gdb must be attached to the PostgreSQL process. To do this, find the pid server process, say from $ ps aux | grep postgres Suppose we discovered:
postgres 2025 0.0 0.1 172428 1240 pts/17 S 23 0:00 /usr/local/pgsql/bin/postgres -D /usr/local/pgsql/data and now insert the
pid into the debager: igor_le:~$gdb -p 2025 Once inside the debugger, we write
bt [i.e. backtrace ] or where . And we get a lot of information like this: (gdb) bt #0 0x00007fbb65d01cd0 in __write_nocancel () from /lib64/libc.so.6 #1 0x00000000007c92f4 in write_pipe_chunks ( data=0x110e6e8 "2018‐06‐01 15:35:38 MSK [524647]: [392‐1] db=bp,user=bp,app=[unknown],client=192.168.70.163 (http://192.168.70.163) LOG: relation 23554 new block 493: 248.389503\n2018‐06‐01 15:35:38 MSK [524647]: [393‐1] db=bp,user=bp,app=["..., len=409, dest=dest@entry=1) at elog.c:3123 #2 0x00000000007cc07b in send_message_to_server_log (edata=0xc6ee60 <errordata>) at elog.c:3024 #3 EmitErrorReport () at elog.c:1479 Collecting statistics, including call stacks from all postgre processes collected repeatedly at different points in time, we saw that for 3706 seconds (about an hour) the
buffer partition lock waiting inside the relation extension lock , that is, locking on a piece of the hash table manager, which was necessary to displace the old buffer, to later replace it with a new, corresponding to the extended part of the table. A number of buffer content lock was also noticeable, which corresponded to the expectation of locking the B-tree index pages for the implementation of the insert.
At first, there were two explanations for such a monstrous waiting time:
- Someone else took this
LWLockandLWLockstuck. But this is unlikely. Because nothing complicated inside the buffer partition lock happens. - We are faced with some pathological behavior
LWLock'a. That is, in spite of the fact that no one took a lock for too long, his wait lasted unnecessarily long.
Diagnostic patches and treatment of trees
By reducing the number of simultaneous connections, we would surely discharge the request flow for locks. But it would be like a surrender. Instead, Alexander Korotkov , the chief architect of Postgres Professional (of course, he helped prepare this article), suggested a series of patches.
First of all, it was necessary to get a more detailed picture of the disaster. No matter how good the finished tools are, the diagnostic patches of their own making will be useful.
A patch was written to add detailed logging of the time spent in the
relation extension , what happens inside the RelationAddExtraBlocks() function. So we will know what time is spent inside RelationAddExtraBlocks().And another patch was written to him in support, reporting to
pg_stat_activity about what we are currently doing in the relation extension . It was done this way: when the relation extended, application_name becomes RelationAddExtraBlocks . This process is now conveniently analyzed with maximum details using gdb bt and perf .Actually therapeutic (and not diagnostic) patches were written two. The first patch changed the behavior of the blocking of leaves of
B‐tree : earlier, when requesting to insert, the sheet was blocked as share , and after that it received exclusive . Now he immediately gets exclusive . Now this patch is already commited for PostgreSQL 12 . Fortunately, this year Alexander Korotkov received committer status - the second PostgreSQL committer in Russia and the second in the company.The value of
NUM_BUFFER_PARTITIONS was also increased from 128 to 512 to reduce the load on mapping locks: the hash table of the buffer manager was divided into smaller pieces, in the hope that the load on each specific piece would decrease.After the application of this patch, the blocking for the buffers are gone, however, despite the increase in
NUM_BUFFER_PARTITIONS , buffer_mapping remained, that is, we remind you that the buffer manager buffer_mapping pieces of the hash table: locks_count | active_session | buffer_content | buffer_mapping ----‐‐‐--‐‐‐+‐------‐‐‐‐‐‐‐‐‐+‐‐‐------‐‐‐‐‐‐‐+‐‐------‐‐‐ 12549 | 1218 | 0 | 15 And that is not much. B-tree has ceased to be a bottleneck. The
heap- expansion came to the fore.Conscience treatment
Next, Alexander put forward the following hypothesis and solution:
We have a lot of time waiting on the
buffer parittion lock 'e when the buffer is preempted. Perhaps, at the same buffer parittion lock , there is some very demanded page, for example, the root of some B‐tree . In this place there is a non-stop stream of requests for shared lock from reading requests.The wait queue in
LWLock 'e is “not fair.” Since shared lock 's can be taken as many as you like at once, then if shared lock already taken, then subsequent shared lock ' and pass without a queue. Thus, if the shared lock stream has enough intensity so that there are no “windows” between them, then the waiting of the exclusive lock goes almost to infinity.To fix this, you can try to offer - a patch of "gentleman's" behavior of locks. It awakens a
shared locker conscience and they honestly queue when an exclusive lock already there (interestingly, heavy locks - hwlock - have no problems with conscience: they always honestly queue) locks_count | active_session | buffer_content | buffer_mapping | reladdextra | inserts>30sec ‐‐‐‐‐‐-‐‐‐‐‐+‐‐‐‐‐‐‐‐‐‐‐‐‐‐‐‐+‐‐‐‐‐‐‐‐‐‐‐‐‐‐‐‐+‐‐‐‐‐‐‐‐‐‐‐--‐-‐+‐‐‐‐‐‐-‐‐‐‐‐‐+‐‐‐‐------ 173985 | 1802 | 0 | 569 | 0 | 0 All is well! There is no long
insert . Although the locks on the pieces of hash tablets remained. But what to do, these are the properties of the bus of our little supercomputer.This patch has also been proposed to the community . But whatever the fate of these patches in the community, nothing prevents them from getting into the next version of Postgres Pro Enterprise , which is designed just for customers with heavily loaded systems.
Morality
The highly moral, lightweight
share -blocks — which allow exclusive -blocks to pass — solved the problem of hourly delays in a multi-node system. The buffer manager hash label did not work because of the too large flow of share lock locks that did not leave a chance for locks needed to wipe out the old buffers and load new ones. Problems with expanding the buffer for database tables were only a consequence of this. Before that, we managed to embroider a bottleneck with access to the B-tree root.PostgreSQL was not designed for NUMA architectures and supercomputers. Adapting Postgres to such architectures is a huge job that would require (and possibly require) the coordinated efforts of many people and even companies. But the unpleasant consequences of these architectural problems can be mitigated. And we have to: the types of load that led to delays, similar to those described, are quite typical, we continue to receive similar distress signals from other places. Similar troubles were manifested before - on systems with a smaller number of cores, the consequences were simply not so monstrous, and the symptoms were treated in other ways and other patches. Now another medicine has appeared - not universal, but obviously useful.
So, when PostgreSQL works with the memory of the entire system as if it were local, no high-speed bus between nodes compares to the access time to local memory. Tasks arise because of this difficult, often urgent, but interesting. And the experience of solving them is useful not only decisive, but the entire community.

Source: https://habr.com/ru/post/423685/
All Articles