Professional skills in demand among UX-specialists (section 2018)
From August 29 to September 7, 2018, the UX SPb community (independent community of UX-specialists in St. Petersburg) conducted a survey aimed at studying the skills of specialists in user interfaces. The community promised to publish the results. The promise is fulfilled :)
The survey was conducted in the thematic groups UX SPb and UXClub in the social networks VK and Facebook. The study involved 109 respondents. First, a few words about the research methodology. After - about the results.
The goal of the survey was to get the “cut off skills” of UX industry experts, not in terms of relevance among employers (such data is easy to obtain by looking through HH), but from the point of view of practicing professionals themselves - what skills do they try to acquire, what are they planning to learn, what skills consider their strengths.
')
Why do we need these data and why are they published? The professional community holds many events of various subjects and levels. We hope that the collected information will help the organizers to hold more informative and attractive meetings for colleagues, conferences, meetings.
For this study, a remote unmoderated survey method was selected. The reason for the choice is very simple - to obtain the most complete data, it was necessary to involve the largest possible number of respondents, and it would be impossible to do this with an in-person interview (even via video link, not personal).
This study is quite simple from a technical point of view, does not imply, for example, interface studies, so the unmoderated survey came up very well.
Google Forms was chosen as the survey platform, a free and easy-to-use tool with the necessary functionality. It is important to note that Google Forms is easy to use, not only for the researcher, but also for the respondents.
The survey included 6 groups of questions focused on the following tasks:
Of course, all data was collected strictly anonymously. Respondents were not asked to give their name, company name or contact information. Raw data does not allow for the identification of participants.
Passing a survey, even so short, can be difficult or uncomfortable for the respondent (we take into account access from mobile devices, work in transport, short breaks on a social network and coffee).
Therefore, in the preparation of the questionnaire, preference was given to closed questions with a limited number of answers. Some questions suggested choosing a ready-made option or entering an arbitrary answer. Only two questions did not contain ready-made options, but provided for the introduction of short lines (the names of one or two skills, the name of the city).
To create a short questionnaire, some questions were intentionally made fairly general. Judging by the responses of several respondents, this has created certain difficulties with the choice. On the other hand, this made it possible to get a rather interesting, if not detailed, picture.
It is also worth noting that, of all the respondents, only one tenth used the opportunity to enter arbitrary values instead of choosing the preset option. This may indicate that the options were chosen correctly, and the hypothesis that respondents were not ready to enter the text is correct.
However, the questionnaire made certain mistakes, which will be discussed below.
The survey is conducted within 8 days, during which time two publications were made in profile communities on the social networks VK and Facebook. The total audience, including repost, can be estimated at 20'000 people. (it is necessary to take into account that not all of them are practitioners of the UX-industry).
109 respondents took part in the survey. Rogers distribution allows you to extend the results to a community of approximately 2,200 people. (the number of active participants who have passed the survey is taken as 5% of its number). This is comparable to the number of practitioners in St. Petersburg with a partial seizure of the audience of other cities and countries (also see distribution by city, below).
The feedback received regarding the survey form suggests that about 4% of potential respondents found it difficult to pass (less than 1% of the audience covered). However, the colleagues who left these reviews themselves suggested that they were not his target audience. There is a reason for this - as the professional grows, many begin to master related disciplines or are shifted towards management. Part of this hypothesis is confirmed by arbitrary answers given by individual participants.
Let's start with a general portrait of the audience - the professional community of UX-specialists.
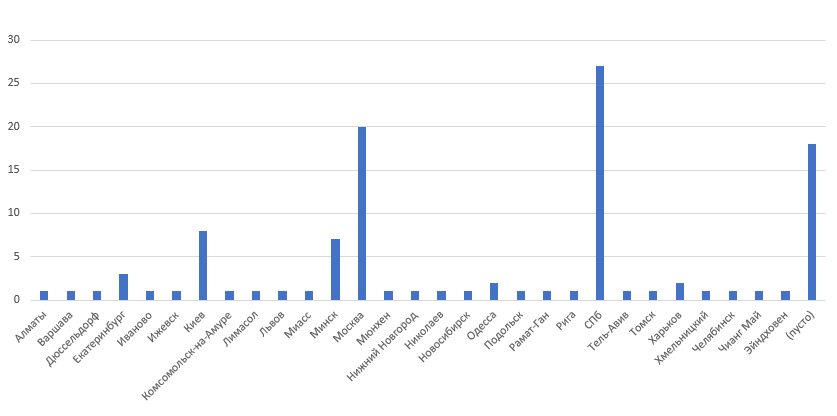
Specialists from 22 cities took part in the survey. The most actively involved were colleagues from Minsk, Kiev, Moscow and St. Petersburg (by increasing the number of respondents). Some of the participants did not indicate their place of residence - one of the limitations of the decision to simplify the filling of the questionnaire.
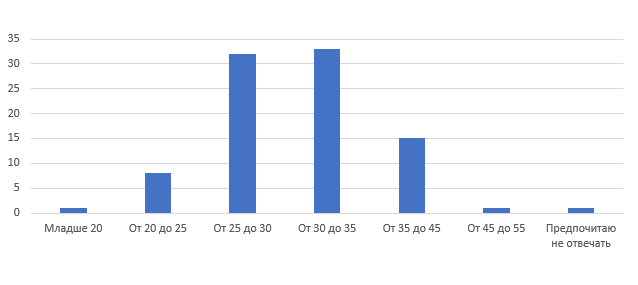
Surprisingly, the audience answered the question about age much more readily. Perhaps the fact is that the age was suggested to be set by selecting one of the predefined values (with the option of not reporting anything).
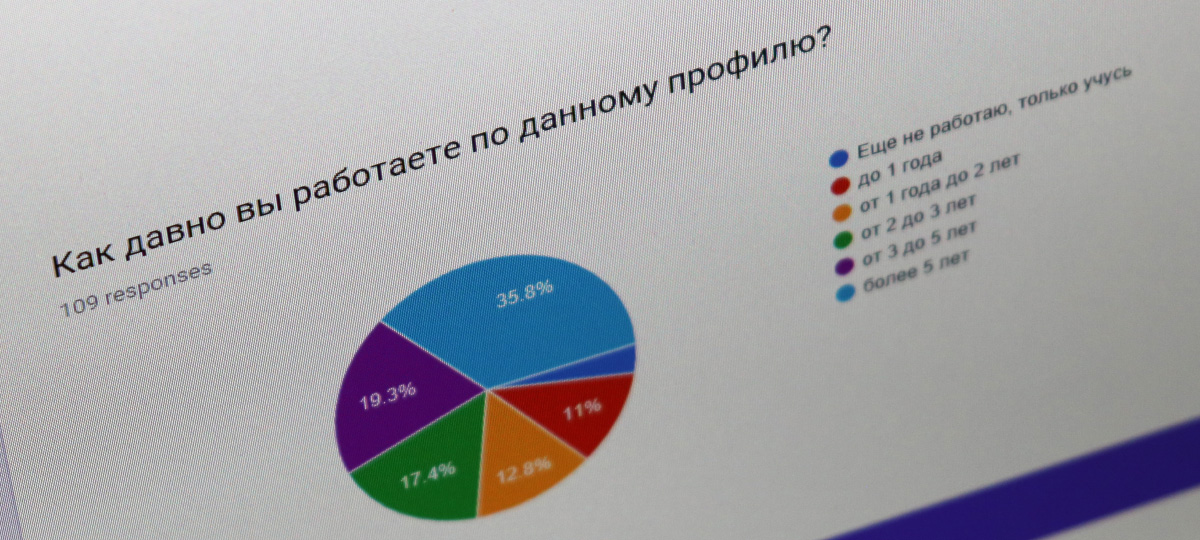
And this is how the distribution of the audience by industry experience looks like. Participants were asked to describe their position or occupation (see below), and then note how many years they have been engaged in relevant activities.
The widespread opinion about the prevalence of newbies in the young IT industry is not confirmed. At least for UX specialists. More than half of the respondents work within the profession for more than 3 years. Quite noticeable experience.
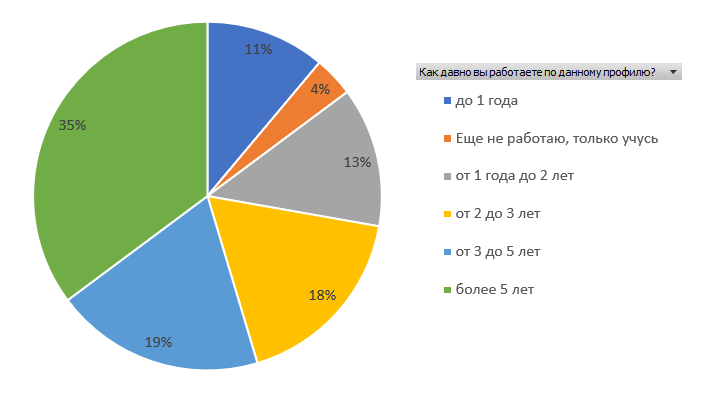
Here, for example, the age distribution of participants in the two most notable groups (work experience of 3-5 years and more than 5 years, only 59 respondents).

Respondents were asked to point out what type of company they were working for. The predefined response options are “At the grocery company,” “At the agency / studio,” “I'm a freelancer,” “While I am just learning.” Here, the authors of the study a little pierced and did not include such a logical option as “At an outsourcing company” in the number of predefined values (after all, a large outsourcer is not a grocery company, but not a small studio). Fortunately, survey participants took the opportunity to enter their own version. There are such answers as “University” or “Bank” (the respondent doubted whether it could be attributed to grocery companies). To simplify the picture, employees of outsourcers and grocery divisions of non-IT companies were included in the group of product developers, their workflows in most cases are very close. The final distribution by type of company looks like this:

It was not so easy to assess the distribution of specialists by job. First of all, everyone even writes similar names in their own way (in Russian, in English, and so on). Secondly, the titles and semantic content of posts are often abstract or blurred. Therefore, the names were grouped by external similarity and are presented here, to a greater extent, as a review of job titles, but not the tasks of the respondents resolved.
So, most of the respondents introduced themselves as “UI / UX-designers” (21 people), 20 people use the abbreviation “UX” in combination with the words “designer”, “architect” or “designer”. 16 people - analysts and researchers, 10 - representatives of senior positions (managers, art directors). 8 respondents call themselves “designers” (sometimes specifying the type of products they create). According to 7 respondents, identify themselves as “designers” of different classes or “product designers”. 5 people call themselves "product managers" or "product owners." The rest of the respondents - in small quantities "web-designers", "designers-designers" (it was unusual to find in such a survey a term from architecture or industrial design), teachers, consultants and designers of related professions.
The main objective of this study is to gain knowledge of professional skills that are valued by UX specialists. They define the "natural" path of development of a practicing professional, his aspirations or desires.
Respondents were asked to answer three questions related to skills. The first question concerned the skills that specialists are most actively learning right now. There were four possible answers to choose from:
The questions were deliberately formulated in a rather abstract way, without mentioning specific tools or methodologies. After all, specific names, especially promoted in the market, could knock a respondent down, push him to choose a fashionable answer instead of a close one to him personally. Here is the result:
The next question that was asked of respondents is much more interesting from the point of view of the researcher, and much more difficult from the point of view of data processing. Respondents were asked to describe the skills that they would have listed in the first two lines of their resume, preparing it to be sent to the company of their dreams. The purpose of this issue in the framework of the study is to try to understand what skills, in the opinion of the professionals themselves, make them professionals.
Answers to this question implied free text input, so the answers were presented in a variety of forms. However, the study authors managed to group all the skills in six groups. Someone, describing himself as a specialist, focuses on management skills, someone on the ownership of specific methods or tools, some colorfully describe their skills in analytics. There are user researchers among the respondents, there are those who appreciate the fact of having experience or the willingness to learn quickly. Finally, some respondents put their human qualities and communication skills (aka soft-skills) above all. Here is the resulting picture:

It is curious that such skills as "graphics" or "visual design" among the strengths noted literally units of respondents.
The third question in the skills series was about skills that UX specialists would like to acquire in the next 2-3 years. This, so to speak, skills "for growth". As in the case of the question about the skills most actively mastered at the moment, the wording was deliberately chosen rather abstract. In addition, a certain ambiguity was intentionally introduced into the question about the construction of the workflow (see below). This description can be interpreted as the ability to build a process and how to manage a team. That is, among those who have chosen this option, there are experts with interests in the field of technology and in the field of management. An approximate estimate of the ratio is 50/50. Final distribution:

All specialists work within different companies, use different tools, methods and processes, have different professional interests. By asking questions and naming the names of products or methods, the authors would receive information about the popularity of the product, but not about the general professional orientation of the audience.
The next block of questions on the questionnaire was devoted to ways of sharing knowledge between specialists.
In the picture you can see the distribution of the popularity of methods by which colleagues prefer to acquire new professional knowledge. Interestingly, the speeches of famous practicing pros are somewhat less popular than any other speeches at conferences. Respondents had the opportunity to choose several answers, note that none of the options is appropriate or enter their answer. At the same time, the only option proposed by the respondent related, to a greater degree, to academic articles. Difficult to make a choice of only two people.

But the question about how colleagues prefer to share their knowledge was more difficult to answer - 34.9% of respondents found it difficult to answer. On the other hand, a lot of alternative options were offered, the most popular of which are internal training within the company, speaking at conferences, consulting. The final distribution is presented below. Responses grouped by related topics proposed by the respondents themselves are highlighted in red.

At the end of the survey, respondents were asked to mark the approximate amount that they receive per month for projects related to UX. To make it easier to compare the income of specialists living in different countries, respondents were asked to note the amount that remains at their disposal after deducting all taxes and convert it into Russian rubles (it must be borne in mind, the purchasing power may still be very different ). About a third of respondents took the opportunity not to answer this question. Information obtained from the rest, you can see below. This is the distribution of the number of specialists who receive one or another income, depending on the experience in the profession:

Of course, the number of respondents is not so large, and their distribution according to work experience is uneven. Therefore, this information cannot be considered exhaustive in any way. However, it is possible to make a general opinion.
That's all. Thanks for attention!
PS A few notes on the study itself.
It is safe to say that in such rapid surveys, designed for maximum audience coverage, the input of any text leads to an increase in the number of refusals to participate. Accurately selected preset values significantly simplify the filling of the questionnaire. However, it will be useful to leave the opportunity for a non-standard answer in case someone cannot find anything suitable. The choice of preset values should be carefully compared with the objectives of the study and to avoid the use of promoted phrases, names, brands. Unless, of course, research is not directly related to them.
In the process of research, some respondents wrote to the authors about the fact that they find it difficult to choose an answer option and, perhaps, are not included in the target audience of the survey. General results suggest that this hypothesis is confirmed, and respected colleagues are actually more working or seeking to work in related disciplines. For example, in graphic design, management or consulting.
The authors hope that the description of the method itself is also of interest to someone :)
The survey was conducted in the thematic groups UX SPb and UXClub in the social networks VK and Facebook. The study involved 109 respondents. First, a few words about the research methodology. After - about the results.
Purpose of the survey
The goal of the survey was to get the “cut off skills” of UX industry experts, not in terms of relevance among employers (such data is easy to obtain by looking through HH), but from the point of view of practicing professionals themselves - what skills do they try to acquire, what are they planning to learn, what skills consider their strengths.
')
Why do we need these data and why are they published? The professional community holds many events of various subjects and levels. We hope that the collected information will help the organizers to hold more informative and attractive meetings for colleagues, conferences, meetings.
Research method
For this study, a remote unmoderated survey method was selected. The reason for the choice is very simple - to obtain the most complete data, it was necessary to involve the largest possible number of respondents, and it would be impossible to do this with an in-person interview (even via video link, not personal).
This study is quite simple from a technical point of view, does not imply, for example, interface studies, so the unmoderated survey came up very well.
Google Forms was chosen as the survey platform, a free and easy-to-use tool with the necessary functionality. It is important to note that Google Forms is easy to use, not only for the researcher, but also for the respondents.
Survey Form
The survey included 6 groups of questions focused on the following tasks:
- Getting a professional audience cutoff - occupation and work experience;
- The study of skills that are actively mastered by specialists at the moment;
- The study of skills that are in the plans for the development;
- Learning skills that experts consider their strengths;
- Overview of ways to share professional knowledge;
- Collection of data on the place of residence, age and about the salary of specialists.
Of course, all data was collected strictly anonymously. Respondents were not asked to give their name, company name or contact information. Raw data does not allow for the identification of participants.
Accepted Assumptions, Easy Survey
Passing a survey, even so short, can be difficult or uncomfortable for the respondent (we take into account access from mobile devices, work in transport, short breaks on a social network and coffee).
Therefore, in the preparation of the questionnaire, preference was given to closed questions with a limited number of answers. Some questions suggested choosing a ready-made option or entering an arbitrary answer. Only two questions did not contain ready-made options, but provided for the introduction of short lines (the names of one or two skills, the name of the city).
To create a short questionnaire, some questions were intentionally made fairly general. Judging by the responses of several respondents, this has created certain difficulties with the choice. On the other hand, this made it possible to get a rather interesting, if not detailed, picture.
It is also worth noting that, of all the respondents, only one tenth used the opportunity to enter arbitrary values instead of choosing the preset option. This may indicate that the options were chosen correctly, and the hypothesis that respondents were not ready to enter the text is correct.
However, the questionnaire made certain mistakes, which will be discussed below.
Audience rating
The survey is conducted within 8 days, during which time two publications were made in profile communities on the social networks VK and Facebook. The total audience, including repost, can be estimated at 20'000 people. (it is necessary to take into account that not all of them are practitioners of the UX-industry).
109 respondents took part in the survey. Rogers distribution allows you to extend the results to a community of approximately 2,200 people. (the number of active participants who have passed the survey is taken as 5% of its number). This is comparable to the number of practitioners in St. Petersburg with a partial seizure of the audience of other cities and countries (also see distribution by city, below).
The feedback received regarding the survey form suggests that about 4% of potential respondents found it difficult to pass (less than 1% of the audience covered). However, the colleagues who left these reviews themselves suggested that they were not his target audience. There is a reason for this - as the professional grows, many begin to master related disciplines or are shifted towards management. Part of this hypothesis is confirmed by arbitrary answers given by individual participants.
The most interesting - the results
Let's start with a general portrait of the audience - the professional community of UX-specialists.
General portrait of the audience
Specialists from 22 cities took part in the survey. The most actively involved were colleagues from Minsk, Kiev, Moscow and St. Petersburg (by increasing the number of respondents). Some of the participants did not indicate their place of residence - one of the limitations of the decision to simplify the filling of the questionnaire.
Surprisingly, the audience answered the question about age much more readily. Perhaps the fact is that the age was suggested to be set by selecting one of the predefined values (with the option of not reporting anything).
And this is how the distribution of the audience by industry experience looks like. Participants were asked to describe their position or occupation (see below), and then note how many years they have been engaged in relevant activities.
The widespread opinion about the prevalence of newbies in the young IT industry is not confirmed. At least for UX specialists. More than half of the respondents work within the profession for more than 3 years. Quite noticeable experience.
Here, for example, the age distribution of participants in the two most notable groups (work experience of 3-5 years and more than 5 years, only 59 respondents).
Respondents were asked to point out what type of company they were working for. The predefined response options are “At the grocery company,” “At the agency / studio,” “I'm a freelancer,” “While I am just learning.” Here, the authors of the study a little pierced and did not include such a logical option as “At an outsourcing company” in the number of predefined values (after all, a large outsourcer is not a grocery company, but not a small studio). Fortunately, survey participants took the opportunity to enter their own version. There are such answers as “University” or “Bank” (the respondent doubted whether it could be attributed to grocery companies). To simplify the picture, employees of outsourcers and grocery divisions of non-IT companies were included in the group of product developers, their workflows in most cases are very close. The final distribution by type of company looks like this:
It was not so easy to assess the distribution of specialists by job. First of all, everyone even writes similar names in their own way (in Russian, in English, and so on). Secondly, the titles and semantic content of posts are often abstract or blurred. Therefore, the names were grouped by external similarity and are presented here, to a greater extent, as a review of job titles, but not the tasks of the respondents resolved.
So, most of the respondents introduced themselves as “UI / UX-designers” (21 people), 20 people use the abbreviation “UX” in combination with the words “designer”, “architect” or “designer”. 16 people - analysts and researchers, 10 - representatives of senior positions (managers, art directors). 8 respondents call themselves “designers” (sometimes specifying the type of products they create). According to 7 respondents, identify themselves as “designers” of different classes or “product designers”. 5 people call themselves "product managers" or "product owners." The rest of the respondents - in small quantities "web-designers", "designers-designers" (it was unusual to find in such a survey a term from architecture or industrial design), teachers, consultants and designers of related professions.
Specialist Skills
The main objective of this study is to gain knowledge of professional skills that are valued by UX specialists. They define the "natural" path of development of a practicing professional, his aspirations or desires.
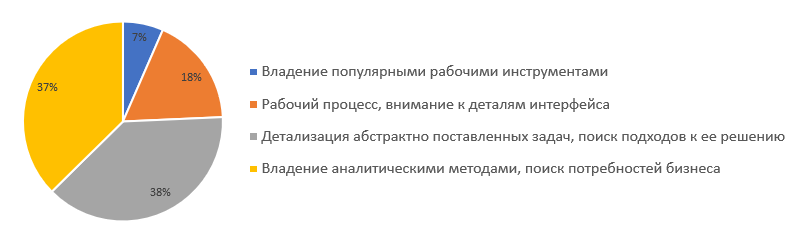
Respondents were asked to answer three questions related to skills. The first question concerned the skills that specialists are most actively learning right now. There were four possible answers to choose from:
- Possession of popular work tools;
- Workflow, attention to details of the interface;
- Detailing abstract tasks, finding approaches to its solution;
- Possession of analytical methods, search for business needs.
The questions were deliberately formulated in a rather abstract way, without mentioning specific tools or methodologies. After all, specific names, especially promoted in the market, could knock a respondent down, push him to choose a fashionable answer instead of a close one to him personally. Here is the result:
The next question that was asked of respondents is much more interesting from the point of view of the researcher, and much more difficult from the point of view of data processing. Respondents were asked to describe the skills that they would have listed in the first two lines of their resume, preparing it to be sent to the company of their dreams. The purpose of this issue in the framework of the study is to try to understand what skills, in the opinion of the professionals themselves, make them professionals.
Answers to this question implied free text input, so the answers were presented in a variety of forms. However, the study authors managed to group all the skills in six groups. Someone, describing himself as a specialist, focuses on management skills, someone on the ownership of specific methods or tools, some colorfully describe their skills in analytics. There are user researchers among the respondents, there are those who appreciate the fact of having experience or the willingness to learn quickly. Finally, some respondents put their human qualities and communication skills (aka soft-skills) above all. Here is the resulting picture:
It is curious that such skills as "graphics" or "visual design" among the strengths noted literally units of respondents.
The third question in the skills series was about skills that UX specialists would like to acquire in the next 2-3 years. This, so to speak, skills "for growth". As in the case of the question about the skills most actively mastered at the moment, the wording was deliberately chosen rather abstract. In addition, a certain ambiguity was intentionally introduced into the question about the construction of the workflow (see below). This description can be interpreted as the ability to build a process and how to manage a team. That is, among those who have chosen this option, there are experts with interests in the field of technology and in the field of management. An approximate estimate of the ratio is 50/50. Final distribution:
All specialists work within different companies, use different tools, methods and processes, have different professional interests. By asking questions and naming the names of products or methods, the authors would receive information about the popularity of the product, but not about the general professional orientation of the audience.
Ways to share knowledge
The next block of questions on the questionnaire was devoted to ways of sharing knowledge between specialists.
In the picture you can see the distribution of the popularity of methods by which colleagues prefer to acquire new professional knowledge. Interestingly, the speeches of famous practicing pros are somewhat less popular than any other speeches at conferences. Respondents had the opportunity to choose several answers, note that none of the options is appropriate or enter their answer. At the same time, the only option proposed by the respondent related, to a greater degree, to academic articles. Difficult to make a choice of only two people.
But the question about how colleagues prefer to share their knowledge was more difficult to answer - 34.9% of respondents found it difficult to answer. On the other hand, a lot of alternative options were offered, the most popular of which are internal training within the company, speaking at conferences, consulting. The final distribution is presented below. Responses grouped by related topics proposed by the respondents themselves are highlighted in red.
Salaries for UX Specialists
At the end of the survey, respondents were asked to mark the approximate amount that they receive per month for projects related to UX. To make it easier to compare the income of specialists living in different countries, respondents were asked to note the amount that remains at their disposal after deducting all taxes and convert it into Russian rubles (it must be borne in mind, the purchasing power may still be very different ). About a third of respondents took the opportunity not to answer this question. Information obtained from the rest, you can see below. This is the distribution of the number of specialists who receive one or another income, depending on the experience in the profession:
Of course, the number of respondents is not so large, and their distribution according to work experience is uneven. Therefore, this information cannot be considered exhaustive in any way. However, it is possible to make a general opinion.
That's all. Thanks for attention!
PS A few notes on the study itself.
It is safe to say that in such rapid surveys, designed for maximum audience coverage, the input of any text leads to an increase in the number of refusals to participate. Accurately selected preset values significantly simplify the filling of the questionnaire. However, it will be useful to leave the opportunity for a non-standard answer in case someone cannot find anything suitable. The choice of preset values should be carefully compared with the objectives of the study and to avoid the use of promoted phrases, names, brands. Unless, of course, research is not directly related to them.
In the process of research, some respondents wrote to the authors about the fact that they find it difficult to choose an answer option and, perhaps, are not included in the target audience of the survey. General results suggest that this hypothesis is confirmed, and respected colleagues are actually more working or seeking to work in related disciplines. For example, in graphic design, management or consulting.
The authors hope that the description of the method itself is also of interest to someone :)
Source: https://habr.com/ru/post/423615/
All Articles