How and what clusters can be allocated in the client base
Today we will add another aspect to the analysis - the segmentation and clustering of the client base. As I have written more than once, the analysis of the client base remains incomplete if we look at our clients as a big bunch of identical people. Customers are divided into types and differently consume the product. Someone buys often, but not much, someone quickly leaves, someone buys a lot and often. To increase efficiency, it is worthwhile to find out what groups of clients there are and then figure out how your actions will allow you to attract the clients you need. Use two basic ways to sort out your customer groups: heuristics and clustering.
Method 1: Heuristics and Expert Evaluation
As part of this approach, based on your experience, the logic of using your product and customer stories, you come up with various consumer portraits and then assess how many customers you have fall under these definitions. Or you can use more numerical approaches based on the analysis of customer performance. Several popular numerical heuristic approaches are:
ABC-XYZ
The main idea is to divide customers by total contribution to your revenue and by the dynamics of growth of indicators. ABC is responsible for contributing to revenue, XYZ is responsible for the stability of revenue. It forms 9 segments.
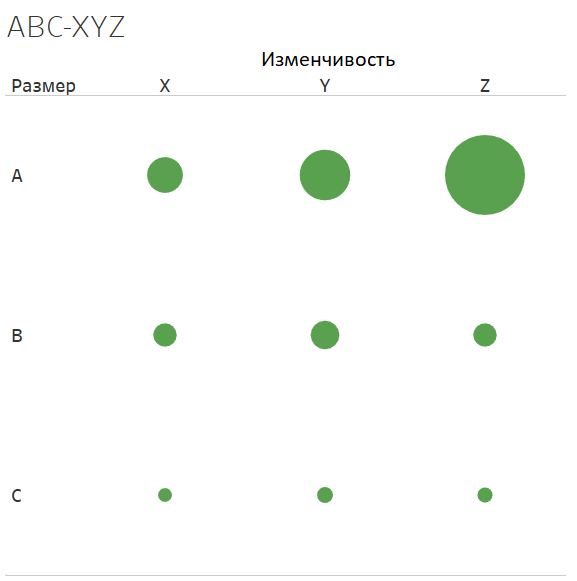
AX - the biggest and with stable revenue
AZ - Large, but they rarely make purchases, revenue is not stable
CX - the smallest, but with stable revenue
CZ - small and revenue is not stable, rarely make purchases
Segment A determines customers who generate 80% of revenue, segment B, who gives another 15% and segment C, who give 5%. In the X segment - the lowest variability of revenue (you can take 33 percentile), Z - the highest variability (respectively, the top 33 percentile). By variability, I mean the value of the variance of revenue.
What this analysis provides: it allows you to divide your customers into groups according to their importance to your business. Clients from the group AX, AY, AZ are the biggest and you should pay them the most attention. Clients of BX, BY groups require additional attention, they can be developed. Attention to groups in other categories can be reduced. Especially good if you manage to highlight the commonality between customers in different segments, which will allow you to target efforts to attract the right customers.
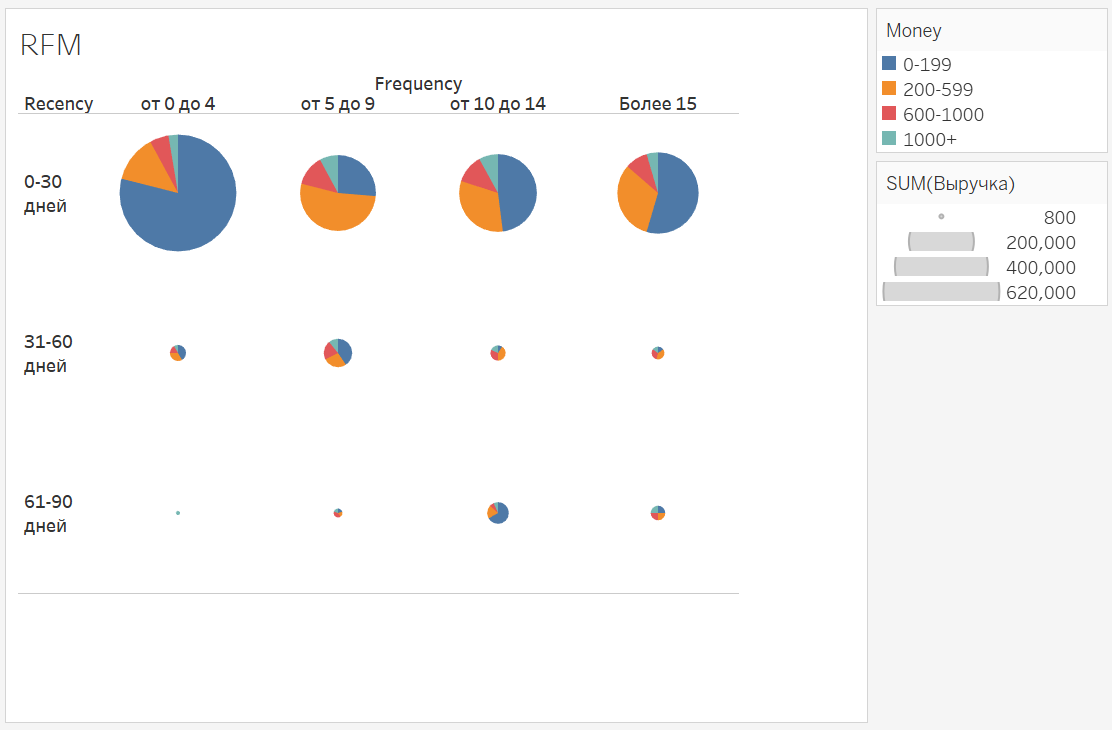
RFM (Recency-Frequency-Money)
The main idea is to divide customers by 3 properties: how long was the sale to the customer (recency), how often he buys goods (frequency), how much revenue he generated (money). In general, the approach resembles ABC-XYZ, but somewhat from a different angle.
In this approach, you divide customers into Recency groups, for example:
- 0-30 days
- 31-60 days
- 61-90 days
- 90+
By count of purchases, for example:
- More than 15
- 10-14
- 5-9
- 0-4
In terms of revenue:
- 1000+
- 600-1000
- 200-599
- 0-199
It is clear that for each specific product, application or product you need to set your own boundaries.
As a result, you will be able to divide customers into many segments, each of which characterizes a customer in order of importance to you.
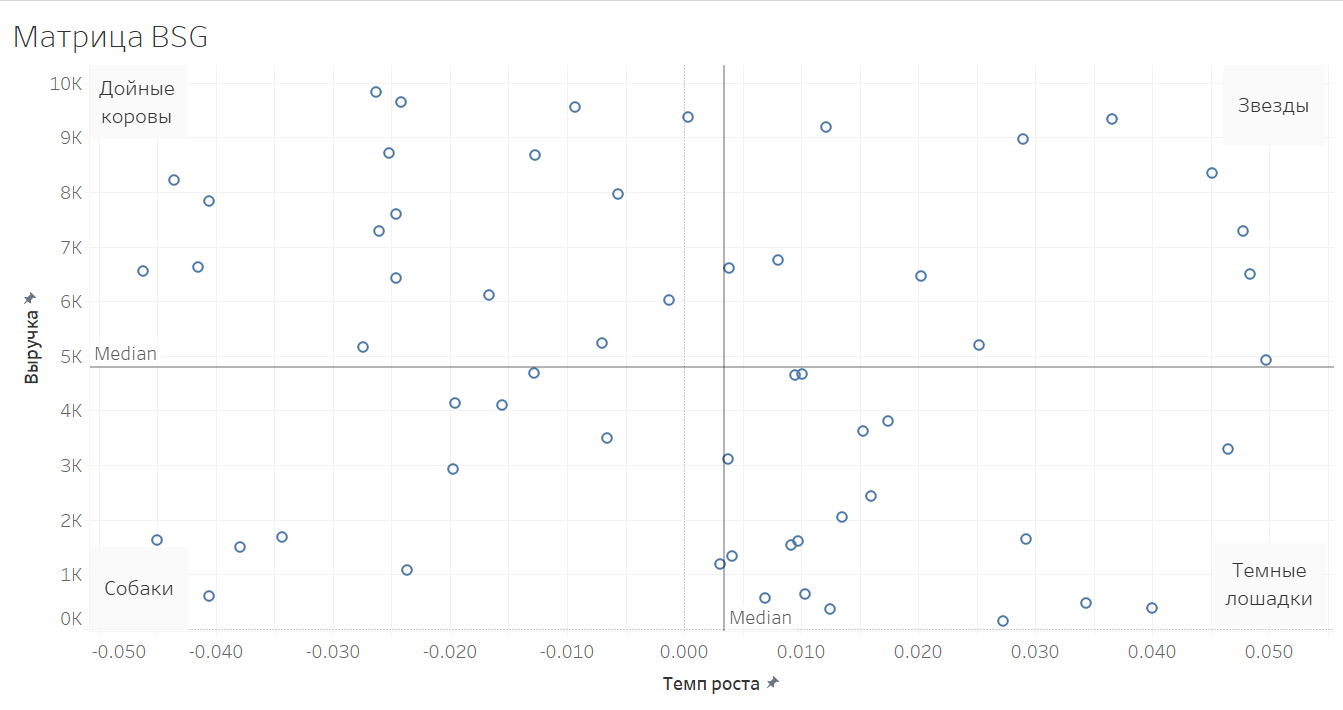
BCG Matrix
The main idea is to divide customers into categories of revenue and revenue growth. This approach allows you to determine who is big and how fast is growing. All customers are decomposed into 4 quadrants:
- Stars are the largest customers with high revenue growth. These are the customers who need the most attention. This is a strong point of growth.
- Dairy cows are large customers with low or negative revenue rates. These customers will form the core of your current revenue. Look over the cows and lose the business.
- Dark horses - while small customers, but with a large growth rate. These are groups of customers who need to pay attention, because they can grow to be stars or dairy cows.
- Dogs are small customers with low or negative growth rates. These are clients who can be given the least attention and apply mass service methods to them to reduce costs.
The advantages of all heuristic methods are the relative ease of implementation and the ability to divide their clients into groups that are understandable from a business point of view.
The disadvantages are that we use only a few customer properties to describe them and exclude other factors from consideration. In addition, clients most often find themselves temporarily in segments, change positions, and it’s difficult to establish real commonality within a segment.
Method 2: Clustering
The basic idea is to find groups of clients without using preliminary hypotheses about the structure of the client base, to find natural clusters among the properties of clients based on the available data.
There is a set of methods (K-mean, C-mean, hierarchical clustering, etc.) that allow you to determine the proximity of each other's objects based on their properties. In general, you describe your client as a vector, each element of this vector describes some characteristic of the client (be it revenue, number of months of cooperation, address of registration, products purchased, etc.). After that, you convert this vector into the desired format for your algorithm, set the algorithm on the data (and set it up for clustering) and get the separation of clients into clusters at the output.
Although the process does not look complicated, the details of the methods and their interpretation are important. The selected “distance” metrics, the way in which the data is transformed, and the number of factors chosen can greatly change the picture. Since ultimately there is no uniquely “correct” solution to the clustering problem in multidimensional data, you will ultimately have to independently evaluate the quality of clusters, namely, to search for a “business” interpretation for them if you are going to use these clusters in decision making by people.
From experience, I can say that you should not use complex and logically unrelated properties of clients, as well as cunning transformations. Despite the likely, elegant solutions along the lines of the output algorithms, you can get difficult-to-interpret clusters that are not inflated into the business context. Perhaps your method is good if the cluster will be used for the input parameters of another machine learning system. But when you want to divide the client base and formulate a marketing strategy, such tricky clusters will not lead you anywhere.
The clustering process itself is an iterative process:
- Make up vector
- Transform the data
- Configure the parameters of the algorithm
- Do the clustering
- Evaluate clusters expertly, can you use them?
- Repeat step 1. if clusters do not satisfy you
The advantage of this approach is that through a lot of iterations you will understand your clients and their data much better, because Each clustering attempt will show you a section of customer behavior and properties that you have most likely never looked at. You will also better understand the relationships and relationships between different customers. Therefore, I advise you to do this exercise and display your own clusters.
Past articles in cycle:
This is the 6th article in a series of articles on product analysis:
- Top-Down approach. Product economics. Gross profit
- Product economics. Revenue analysis
- Dive into the dynamics of the client base: cohort analysis and flow analysis
- We collect cohort analysis / flow analysis on the example of Excel
- Sales Funnel Analytics
- MPRU, revenue and how it relates to revenue and customer base dynamics
')
Source: https://habr.com/ru/post/423597/
All Articles